Broward County Investment Properties for Sale
Browse homes for sale and investment properties in Broward County. Refine your search by price, property type, or more.
Best cash flowing properties in Broward County

Active
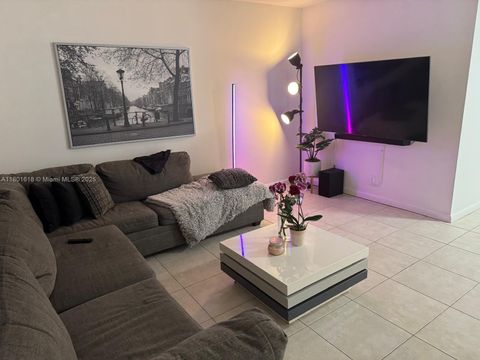
$178,000
1
bds
|
1
ba
|
712
sqft
|
built
1989
3310 Pinewalk Dr N, Margate, FL 33063
$-47
Cash flow
-1.4%
Cash-on-Cash Return
5.8%
Cap rate
1.0%
Rent to Value Ratio
Active
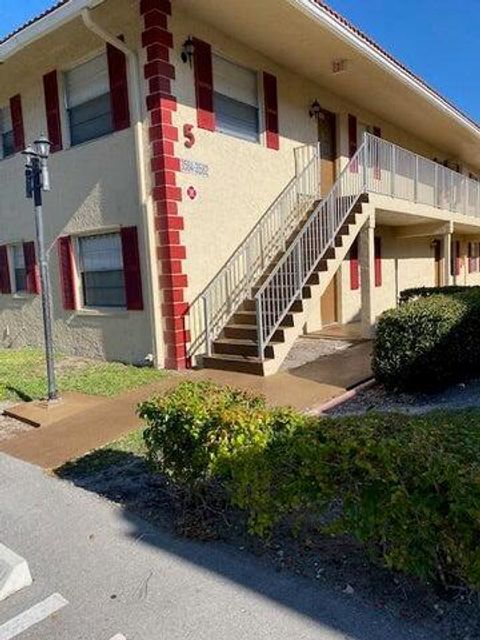
$139,900
2
bds
|
2
ba
|
775
sqft
|
built
1983
6020 Shakerwood Cir, Tamarac, FL 33319
$-299
Cash flow
-11.2%
Cash-on-Cash Return
3.6%
Cap rate
1.3%
Rent to Value Ratio
7,582 out of 8,882 properties for sale in Broward County
Limited Results Shown
Create a free account, or log in to reveal all property listings and enjoy the complete experience.
Active
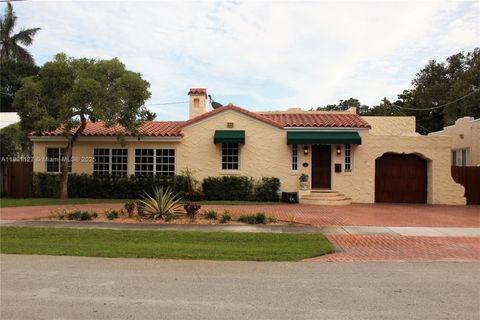
$1,100,000
3
bds
|
2
ba
|
1,748
sqft
|
built
1967
5005 Johnson St, Hollywood, FL 33021
$-1,736
Cash flow
-8.2%
Cash-on-Cash Return
4.3%
Cap rate
0.6%
Rent to Value Ratio
Active
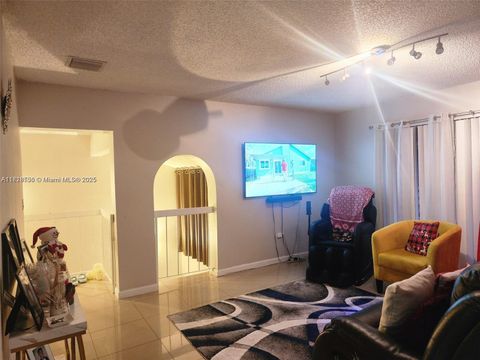
$699,000
4
bds
|
2
ba
|
1,987
sqft
|
built
1971
1101 SW 75th Ter, Plantation, FL 33317
$-1,094
Cash flow
-8.2%
Cash-on-Cash Return
4.3%
Cap rate
0.6%
Rent to Value Ratio
Active
$505,000
4
bds
|
2
ba
|
1,676
sqft
|
built
1971
6714 Boulevard Of Champions, North Lauderdale, FL 33068
$-988
Cash flow
-10.2%
Cash-on-Cash Return
3.8%
Cap rate
0.7%
Rent to Value Ratio
Active
$399,777
2
bds
|
2
ba
|
1,035
sqft
|
built
1971
777 S Federal Hwy, Pompano Beach, FL 33062
$-1,513
Cash flow
-19.7%
Cash-on-Cash Return
1.6%
Cap rate
0.6%
Rent to Value Ratio
Active
$1,479,000
bds
|
0
ba
|
1,883
sqft
|
built
1965
3212 SE 6th St, Pompano Beach, FL 33062
$-5,903
Cash flow
-20.8%
Cash-on-Cash Return
1.4%
Cap rate
0.3%
Rent to Value Ratio
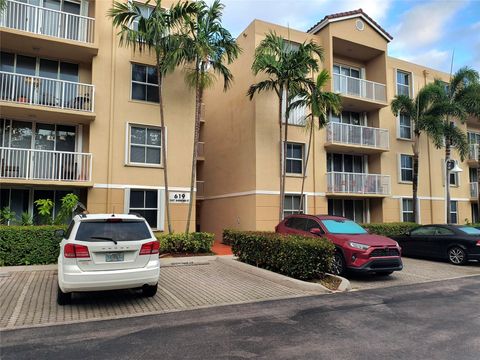
Active
$299,500
2
bds
|
2
ba
|
1,162
sqft
|
built
2005
619 E Sheridan St, Dania Beach, FL 33004
$-727
Cash flow
-12.7%
Cash-on-Cash Return
3.2%
Cap rate
0.8%
Rent to Value Ratio
Active
$299,000
2
bds
|
2
ba
|
1,064
sqft
|
built
1972
3051 S Palm Aire Dr, Pompano Beach, FL 33069
$-1,267
Cash flow
-22.1%
Cash-on-Cash Return
1.1%
Cap rate
0.7%
Rent to Value Ratio
Active
$549,000
2
bds
|
2
ba
|
975
sqft
|
built
1969
1620 N Ocean Blvd, Pompano Beach, FL 33062
$-1,075
Cash flow
-10.2%
Cash-on-Cash Return
3.8%
Cap rate
0.6%
Rent to Value Ratio
Active
$1,395,000
5
bds
|
3
ba
|
2,982
sqft
|
built
1972
3351 NE 17th Way, Oakland Park, FL 33334
$-2,899
Cash flow
-10.8%
Cash-on-Cash Return
3.7%
Cap rate
0.6%
Rent to Value Ratio
Active
$775,000
2
bds
|
2
ba
|
1,660
sqft
|
built
1971
3750 Galt Ocean Dr, Fort Lauderdale, FL 33308
$-3,588
Cash flow
-24.2%
Cash-on-Cash Return
0.6%
Cap rate
0.5%
Rent to Value Ratio
Active
$415,000
3
bds
|
2
ba
|
930
sqft
|
built
1958
3700 SW 56th Ave, West Park, FL 33023
$-656
Cash flow
-8.2%
Cash-on-Cash Return
4.3%
Cap rate
0.7%
Rent to Value Ratio
Active
$329,000
2
bds
|
2
ba
|
1,126
sqft
|
built
1989
1993 Discovery Cir E, Deerfield Beach, FL 33442
$-473
Cash flow
-7.5%
Cash-on-Cash Return
4.4%
Cap rate
0.8%
Rent to Value Ratio
Active
$495,900
3
bds
|
3
ba
|
1,500
sqft
|
built
1991
6800 Bayfront Cir, Margate, FL 33063
$-972
Cash flow
-10.2%
Cash-on-Cash Return
3.8%
Cap rate
0.6%
Rent to Value Ratio
Active
$1,680,000
4
bds
|
3
ba
|
2,010
sqft
|
built
1952
726 NE 17th Way, Fort Lauderdale, FL 33304
$-3,553
Cash flow
-11.0%
Cash-on-Cash Return
3.6%
Cap rate
0.6%
Rent to Value Ratio
Active
$319,900
2
bds
|
2
ba
|
1,290
sqft
|
built
1988
426 SE 11th Ter, Dania Beach, FL 33004
$-1,010
Cash flow
-16.5%
Cash-on-Cash Return
2.4%
Cap rate
0.8%
Rent to Value Ratio
Active
$525,000
3
bds
|
2
ba
|
1,682
sqft
|
built
1994
11672 NW 13th Mnr, Coral Springs, FL 33071
$-941
Cash flow
-9.4%
Cash-on-Cash Return
4.0%
Cap rate
0.7%
Rent to Value Ratio
Active
$365,000
2
bds
|
2
ba
|
1,165
sqft
|
built
2009
2681 N Flamingo Rd, Sunrise, FL 33323
$-1,611
Cash flow
-23.0%
Cash-on-Cash Return
0.9%
Cap rate
0.8%
Rent to Value Ratio
Active
$349,777
2
bds
|
2
ba
|
1,035
sqft
|
built
1972
777 S Federal Hwy, Pompano Beach, FL 33062
$-1,353
Cash flow
-20.2%
Cash-on-Cash Return
1.5%
Cap rate
0.7%
Rent to Value Ratio
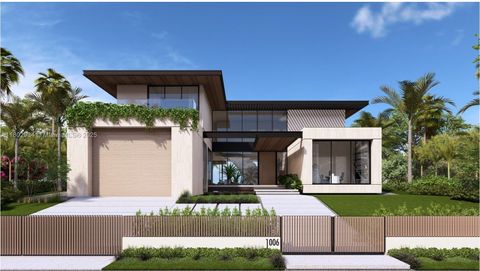
Active
$4,800,000
3
bds
|
4
ba
|
3,206
sqft
|
built
1960
1006 N Southlake Dr, Hollywood, FL 33019
$-19,412
Cash flow
-21.1%
Cash-on-Cash Return
1.3%
Cap rate
0.2%
Rent to Value Ratio
Active
$670,000
4
bds
|
3
ba
|
1,883
sqft
|
built
1999
1220 SW 46th Ter, Deerfield Beach, FL 33442
$-1,515
Cash flow
-11.8%
Cash-on-Cash Return
3.4%
Cap rate
0.7%
Rent to Value Ratio

Active
$350,000
1
bds
|
1
ba
|
786
sqft
|
built
2001
520 SE 5th Ave, Fort Lauderdale, FL 33301
$-1,342
Cash flow
-20.0%
Cash-on-Cash Return
1.5%
Cap rate
0.7%
Rent to Value Ratio
Active
$829,000
2
bds
|
3
ba
|
2,020
sqft
|
built
1980
1800 S Ocean Blvd, Pompano Beach, FL 33062
$-3,170
Cash flow
-20.0%
Cash-on-Cash Return
1.6%
Cap rate
0.6%
Rent to Value Ratio
Active
$1,450,000
4
bds
|
3
ba
|
2,460
sqft
|
built
1999
5530 SW 195th Ter, Fort Lauderdale, FL 33332
$-4,747
Cash flow
-17.1%
Cash-on-Cash Return
2.2%
Cap rate
0.4%
Rent to Value Ratio

Active
$969,000
4
bds
|
3
ba
|
2,650
sqft
|
built
2001
3230 SW 194th Ter, Miramar, FL 33029
$-2,380
Cash flow
-12.8%
Cash-on-Cash Return
3.2%
Cap rate
0.5%
Rent to Value Ratio
Active
$1,049,000
4
bds
|
4
ba
|
2,580
sqft
|
built
2004
1812 SW 10th Ave, Fort Lauderdale, FL 33315
$-2,177
Cash flow
-10.8%
Cash-on-Cash Return
3.7%
Cap rate
0.5%
Rent to Value Ratio

Active
$250,000
2
bds
|
2
ba
|
960
sqft
|
built
1965
3711 Van Buren St, Hollywood, FL 33021
$-494
Cash flow
-10.3%
Cash-on-Cash Return
3.8%
Cap rate
0.9%
Rent to Value Ratio
Active
$1,040,000
4
bds
|
3
ba
|
3,424
sqft
|
built
2022
4578 SW 174th Ave, Miramar, FL 33029
$-3,683
Cash flow
-18.5%
Cash-on-Cash Return
1.9%
Cap rate
0.5%
Rent to Value Ratio

Active
$389,900
3
bds
|
3
ba
|
1,750
sqft
|
built
1990
9765 NW 37th St, Sunrise, FL 33351
$-1,136
Cash flow
-15.2%
Cash-on-Cash Return
2.6%
Cap rate
0.7%
Rent to Value Ratio
Active
$250,000
2
bds
|
1
ba
|
875
sqft
|
built
1965
2455 NE 51st St, Fort Lauderdale, FL 33308
$-816
Cash flow
-17.0%
Cash-on-Cash Return
2.2%
Cap rate
0.8%
Rent to Value Ratio

Active
$255,000
2
bds
|
2
ba
|
806
sqft
|
built
1986
1124 NW 106th Ter, Pembroke Pines, FL 33026
$-596
Cash flow
-12.2%
Cash-on-Cash Return
3.3%
Cap rate
0.9%
Rent to Value Ratio
Active
$780,000
3
bds
|
2
ba
|
1,144
sqft
|
built
1963
1910 NW 36th St, Oakland Park, FL 33309
$-1,010
Cash flow
-6.8%
Cash-on-Cash Return
4.6%
Cap rate
0.7%
Rent to Value Ratio
Active
$725,000
7
bds
|
0
ba
|
4,088
sqft
|
built
1952
242 SW 9th St, Dania Beach, FL 33004
$-2,031
Cash flow
-14.6%
Cash-on-Cash Return
2.8%
Cap rate
0.5%
Rent to Value Ratio
Active
$160,000
1
bds
|
1
ba
|
620
sqft
|
built
1965
467 Golden Isles Dr, Hallandale Beach, FL 33009
$-456
Cash flow
-14.9%
Cash-on-Cash Return
2.7%
Cap rate
1.1%
Rent to Value Ratio
Active
$1,440,000
3
bds
|
3
ba
|
1,970
sqft
|
built
1921
804 SE 10th St, Fort Lauderdale, FL 33316
$-4,333
Cash flow
-15.7%
Cash-on-Cash Return
2.5%
Cap rate
0.4%
Rent to Value Ratio
Active
$204,900
2
bds
|
2
ba
|
809
sqft
|
built
1982
3566 N University Dr, Coral Springs, FL 33065
$-654
Cash flow
-16.7%
Cash-on-Cash Return
2.3%
Cap rate
0.9%
Rent to Value Ratio
Active
$345,000
3
bds
|
2
ba
|
1,200
sqft
|
built
1974
8409 N Missionwood Cir, Miramar, FL 33025
$-844
Cash flow
-12.8%
Cash-on-Cash Return
3.2%
Cap rate
0.8%
Rent to Value Ratio
Active
$799,000
4
bds
|
2
ba
|
2,008
sqft
|
built
1961
420 SE 5th St, Pompano Beach, FL 33060
$-1,784
Cash flow
-11.6%
Cash-on-Cash Return
3.5%
Cap rate
0.5%
Rent to Value Ratio

Active
$169,995
1
bds
|
2
ba
|
850
sqft
|
built
1980
3550 Blue Lake Dr, Pompano Beach, FL 33064
$-407
Cash flow
-12.5%
Cash-on-Cash Return
3.3%
Cap rate
1.0%
Rent to Value Ratio