Broward County Investment Properties for Sale
Browse homes for sale and investment properties in Broward County. Refine your search by price, property type, or more.
Best cash flowing properties in Broward County
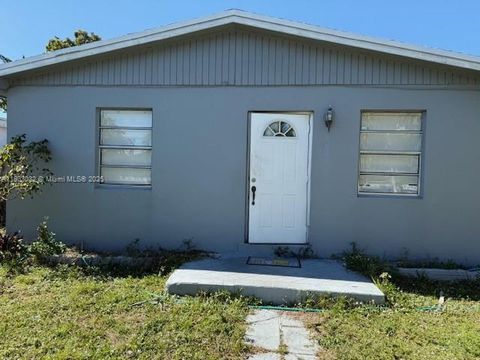
Active
$185,000
2
bds
|
2
ba
|
873
sqft
|
built
1975
4211 NW 19th St, Lauderhill, FL 33313
$-139
Cash flow
-3.9%
Cash-on-Cash Return
5.2%
Cap rate
0.9%
Rent to Value Ratio
Active
$159,000
1
bds
|
1
ba
|
650
sqft
|
built
1965
3033 NW 43rd Ave, Lauderdale Lakes, FL 33313
$-444
Cash flow
-14.6%
Cash-on-Cash Return
2.8%
Cap rate
0.9%
Rent to Value Ratio
8,153 out of 9,522 properties for sale in Broward County
Limited Results Shown
Create a free account, or log in to reveal all property listings and enjoy the complete experience.
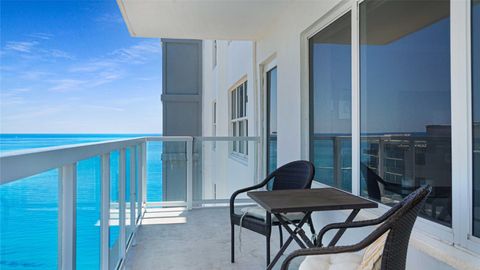
Active
$359,000
1
bds
|
2
ba
|
870
sqft
|
built
1971
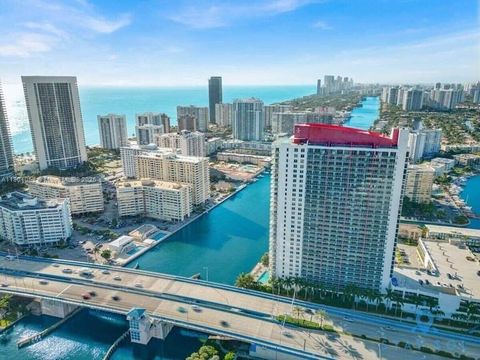
1980 S Ocean Dr, Hallandale Beach, FL 33009
$-1,071
Cash flow
-15.6%
Cash-on-Cash Return
2.6%
Cap rate
0.8%
Rent to Value Ratio
Active
$6,850,000
3
bds
|
5
ba
|
3,833
sqft
|
built
2008
1 N Fort Lauderdale Beach Blvd, Fort Lauderdale, FL 33304
$-36,888
Cash flow
-28.1%
Cash-on-Cash Return
-0.3%
Cap rate
0.1%
Rent to Value Ratio
Active
$363,000
3
bds
|
1
ba
|
1,399
sqft
|
built
1967
4240 NW 22nd St, Lauderhill, FL 33313
$-582
Cash flow
-8.4%
Cash-on-Cash Return
4.2%
Cap rate
0.7%
Rent to Value Ratio
Active
$1,199,000
3
bds
|
3
ba
|
2,400
sqft
|
built
1970
4280 Galt Ocean Dr, Fort Lauderdale, FL 33308
$-4,286
Cash flow
-18.7%
Cash-on-Cash Return
1.9%
Cap rate
0.7%
Rent to Value Ratio
Active
$474,000
4
bds
|
2
ba
|
1,846
sqft
|
built
1968
3226 NW 41st St, Lauderdale Lakes, FL 33309
$-1,119
Cash flow
-12.3%
Cash-on-Cash Return
3.3%
Cap rate
0.7%
Rent to Value Ratio
Active
$475,000
2
bds
|
1
ba
|
720
sqft
|
built
1962
6421 Allen St, Hollywood, FL 33024
$-1,008
Cash flow
-11.1%
Cash-on-Cash Return
3.6%
Cap rate
0.6%
Rent to Value Ratio
Active
$650,000
3
bds
|
2
ba
|
1,658
sqft
|
built
1970
7601 Harbour Blvd, Miramar, FL 33023
$-1,495
Cash flow
-12.0%
Cash-on-Cash Return
3.4%
Cap rate
0.6%
Rent to Value Ratio
Active
$625,000
2
bds
|
2
ba
|
1,760
sqft
|
built
1982
3432 NE 16th Ave, Oakland Park, FL 33334
$-2,143
Cash flow
-17.9%
Cash-on-Cash Return
2.0%
Cap rate
0.4%
Rent to Value Ratio
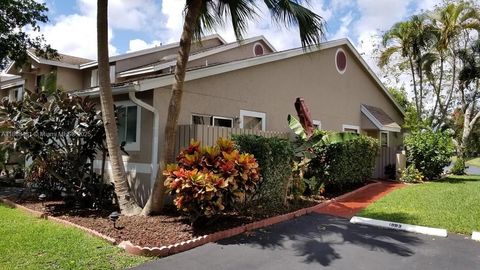
Active
$189,900
2
bds
|
2
ba
|
890
sqft
|
built
1985
212 Lake Pointe Dr, Oakland Park, FL 33309
$-496
Cash flow
-13.6%
Cash-on-Cash Return
3.0%
Cap rate
1.0%
Rent to Value Ratio
Active
$269,000
2
bds
|
2
ba
|
1,246
sqft
|
built
2002
5045 Wiles Rd, Coconut Creek, FL 33073
$-783
Cash flow
-15.2%
Cash-on-Cash Return
2.7%
Cap rate
0.9%
Rent to Value Ratio
Active
$699,000
2
bds
|
2
ba
|
1,028
sqft
|
built
2015
2600 E Hallandale Beach Blvd, Hallandale Beach, FL 33009
$-3,094
Cash flow
-23.1%
Cash-on-Cash Return
0.8%
Cap rate
0.5%
Rent to Value Ratio
Active
$320,000
2
bds
|
2
ba
|
1,292
sqft
|
built
1981
16141 Blatt Blvd, Weston, FL 33326
$-527
Cash flow
-8.6%
Cash-on-Cash Return
4.2%
Cap rate
0.7%
Rent to Value Ratio
Active
$329,000
0
bds
|
1
ba
|
644
sqft
|
built
1963
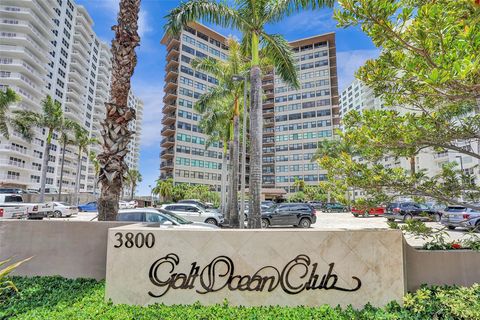
3800 Galt Ocean Dr, Fort Lauderdale, FL 33308
$-1,225
Cash flow
-19.4%
Cash-on-Cash Return
1.7%
Cap rate
0.7%
Rent to Value Ratio
Active
$299,000
1
bds
|
1
ba
|
616
sqft
|
built
1958
805 NE 17th Ave, Fort Lauderdale, FL 33304
$-1,017
Cash flow
-17.7%
Cash-on-Cash Return
2.1%
Cap rate
0.6%
Rent to Value Ratio
Active
$879,000
2
bds
|
2
ba
|
1,768
sqft
|
built
1973
2751 S Ocean Dr, Hollywood, FL 33019
$-2,983
Cash flow
-17.7%
Cash-on-Cash Return
2.1%
Cap rate
0.7%
Rent to Value Ratio
Active
$555,000
2
bds
|
2
ba
|
1,500
sqft
|
built
1982
1101 River Reach Dr, Fort Lauderdale, FL 33315
$-2,565
Cash flow
-24.1%
Cash-on-Cash Return
0.6%
Cap rate
0.5%
Rent to Value Ratio
Active
$437,000
3
bds
|
2
ba
|
1,245
sqft
|
built
1963
6631 Meade St, Hollywood, FL 33024
$-710
Cash flow
-8.5%
Cash-on-Cash Return
4.2%
Cap rate
0.7%
Rent to Value Ratio
Active
$1,100,000
3
bds
|
2
ba
|
1,748
sqft
|
built
1967
5005 Johnson St, Hollywood, FL 33021
$-1,736
Cash flow
-8.2%
Cash-on-Cash Return
4.3%
Cap rate
0.6%
Rent to Value Ratio
Active
$699,000
4
bds
|
2
ba
|
1,987
sqft
|
built
1971
1101 SW 75th Ter, Plantation, FL 33317
$-1,094
Cash flow
-8.2%
Cash-on-Cash Return
4.3%
Cap rate
0.6%
Rent to Value Ratio
Active
$505,000
4
bds
|
2
ba
|
1,676
sqft
|
built
1971
6714 Boulevard Of Champions, North Lauderdale, FL 33068
$-988
Cash flow
-10.2%
Cash-on-Cash Return
3.8%
Cap rate
0.7%
Rent to Value Ratio
Active
$399,777
2
bds
|
2
ba
|
1,035
sqft
|
built
1971
777 S Federal Hwy, Pompano Beach, FL 33062
$-1,513
Cash flow
-19.7%
Cash-on-Cash Return
1.6%
Cap rate
0.6%
Rent to Value Ratio
Active
$1,479,000
bds
|
0
ba
|
1,883
sqft
|
built
1965
3212 SE 6th St, Pompano Beach, FL 33062
$-5,903
Cash flow
-20.8%
Cash-on-Cash Return
1.4%
Cap rate
0.3%
Rent to Value Ratio
Active
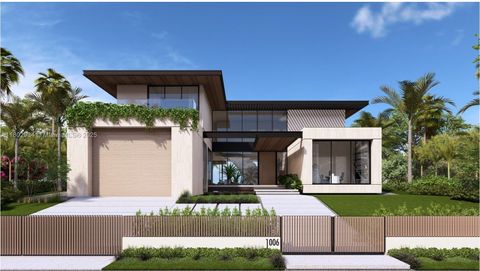
$4,800,000
3
bds
|
4
ba
|
3,206
sqft
|
built
1960
1006 N Southlake Dr, Hollywood, FL 33019
$-19,412
Cash flow
-21.1%
Cash-on-Cash Return
1.3%
Cap rate
0.2%
Rent to Value Ratio
Active
$775,000
2
bds
|
2
ba
|
1,660
sqft
|
built
1971
3750 Galt Ocean Dr, Fort Lauderdale, FL 33308
$-3,588
Cash flow
-24.2%
Cash-on-Cash Return
0.6%
Cap rate
0.5%
Rent to Value Ratio
Active
$329,000
2
bds
|
2
ba
|
1,126
sqft
|
built
1989
1993 Discovery Cir E, Deerfield Beach, FL 33442
$-473
Cash flow
-7.5%
Cash-on-Cash Return
4.4%
Cap rate
0.8%
Rent to Value Ratio
Active
$415,000
3
bds
|
2
ba
|
930
sqft
|
built
1958
3700 SW 56th Ave, West Park, FL 33023
$-656
Cash flow
-8.2%
Cash-on-Cash Return
4.3%
Cap rate
0.7%
Rent to Value Ratio
Active
$1,150,000
5
bds
|
4
ba
|
3,040
sqft
|
built
1975
6001 SW 18th St, Plantation, FL 33317
$-672
Cash flow
-3.0%
Cash-on-Cash Return
5.4%
Cap rate
0.7%
Rent to Value Ratio
Active
$1,395,000
5
bds
|
3
ba
|
2,982
sqft
|
built
1972
3351 NE 17th Way, Oakland Park, FL 33334
$-2,899
Cash flow
-10.8%
Cash-on-Cash Return
3.7%
Cap rate
0.6%
Rent to Value Ratio
Active
$495,900
3
bds
|
3
ba
|
1,500
sqft
|
built
1991
6800 Bayfront Cir, Margate, FL 33063
$-972
Cash flow
-10.2%
Cash-on-Cash Return
3.8%
Cap rate
0.6%
Rent to Value Ratio
Active
$1,680,000
4
bds
|
3
ba
|
2,010
sqft
|
built
1952
726 NE 17th Way, Fort Lauderdale, FL 33304
$-3,553
Cash flow
-11.0%
Cash-on-Cash Return
3.6%
Cap rate
0.6%
Rent to Value Ratio
Active
$319,900
2
bds
|
2
ba
|
1,290
sqft
|
built
1988
426 SE 11th Ter, Dania Beach, FL 33004
$-1,010
Cash flow
-16.5%
Cash-on-Cash Return
2.4%
Cap rate
0.8%
Rent to Value Ratio
Active
$525,000
3
bds
|
2
ba
|
1,682
sqft
|
built
1994
11672 NW 13th Mnr, Coral Springs, FL 33071
$-941
Cash flow
-9.4%
Cash-on-Cash Return
4.0%
Cap rate
0.7%
Rent to Value Ratio
Active
$365,000
2
bds
|
2
ba
|
1,165
sqft
|
built
2009
2681 N Flamingo Rd, Sunrise, FL 33323
$-1,611
Cash flow
-23.0%
Cash-on-Cash Return
0.9%
Cap rate
0.8%
Rent to Value Ratio
Active
$349,777
2
bds
|
2
ba
|
1,035
sqft
|
built
1972
777 S Federal Hwy, Pompano Beach, FL 33062
$-1,353
Cash flow
-20.2%
Cash-on-Cash Return
1.5%
Cap rate
0.7%
Rent to Value Ratio
Active
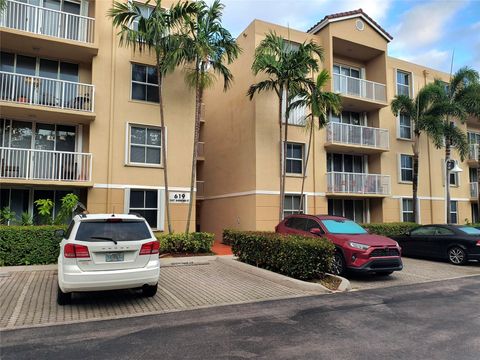
$299,500
2
bds
|
2
ba
|
1,162
sqft
|
built
2005
619 E Sheridan St, Dania Beach, FL 33004
$-727
Cash flow
-12.7%
Cash-on-Cash Return
3.2%
Cap rate
0.8%
Rent to Value Ratio
Active
$299,000
2
bds
|
2
ba
|
1,064
sqft
|
built
1972
3051 S Palm Aire Dr, Pompano Beach, FL 33069
$-1,267
Cash flow
-22.1%
Cash-on-Cash Return
1.1%
Cap rate
0.7%
Rent to Value Ratio
Active
$549,000
2
bds
|
2
ba
|
975
sqft
|
built
1969
1620 N Ocean Blvd, Pompano Beach, FL 33062
$-1,075
Cash flow
-10.2%
Cash-on-Cash Return
3.8%
Cap rate
0.6%
Rent to Value Ratio
Active
$670,000
4
bds
|
3
ba
|
1,883
sqft
|
built
1999
1220 SW 46th Ter, Deerfield Beach, FL 33442
$-1,515
Cash flow
-11.8%
Cash-on-Cash Return
3.4%
Cap rate
0.7%
Rent to Value Ratio