Broward County Investment Properties for Sale
Browse homes for sale and investment properties in Broward County. Refine your search by price, property type, or more.
Best cash flowing properties in Broward County
Active
$125,000
2
bds
|
2
ba
|
815
sqft
|
built
1969
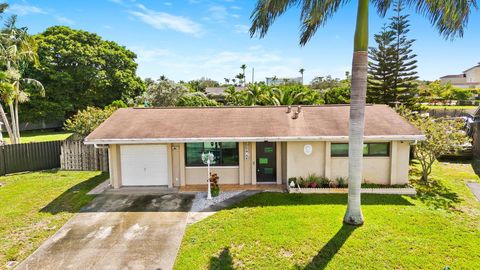
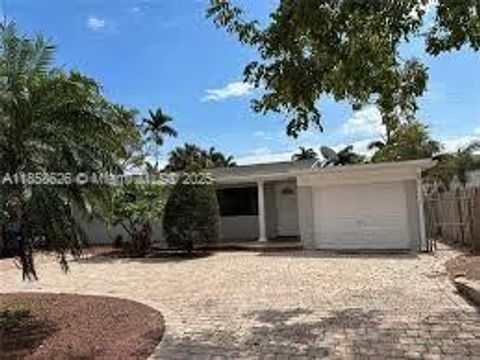
4043 NW 16th St, Lauderhill, FL 33313
$69
Cash flow
2.9%
Cash-on-Cash Return
6.8%
Cap rate
1.4%
Rent to Value Ratio
Active
$475,000
3
bds
|
1
ba
|
1,402
sqft
|
built
1980
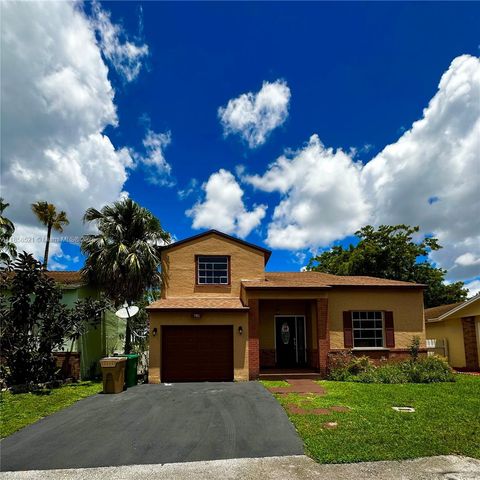
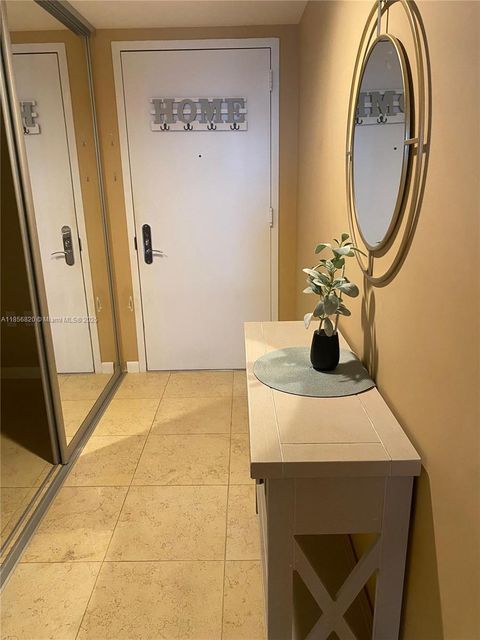
3290 NW 113th Ave, Sunrise, FL 33323
$-179
Cash flow
-2.0%
Cash-on-Cash Return
5.7%
Cap rate
0.7%
Rent to Value Ratio
9,255 out of 10,784 properties for sale in Broward County
Limited Results Shown
Create a free account, or log in to reveal all property listings and enjoy the complete experience.
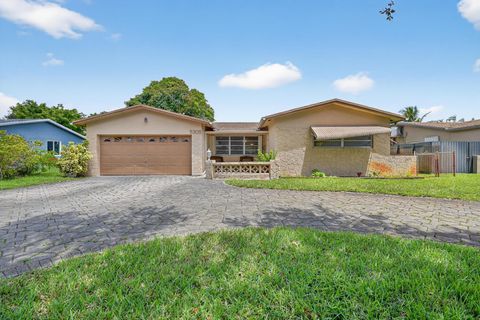
Active
$529,000
3
bds
|
2
ba
|
1,541
sqft
|
built
1988
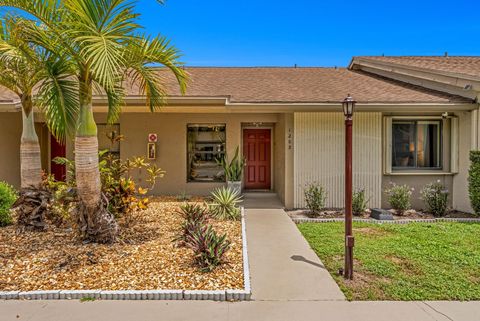
506 Danville Ter, Davie, FL 33325
$-1,196
Cash flow
-11.8%
Cash-on-Cash Return
3.4%
Cap rate
0.7%
Rent to Value Ratio
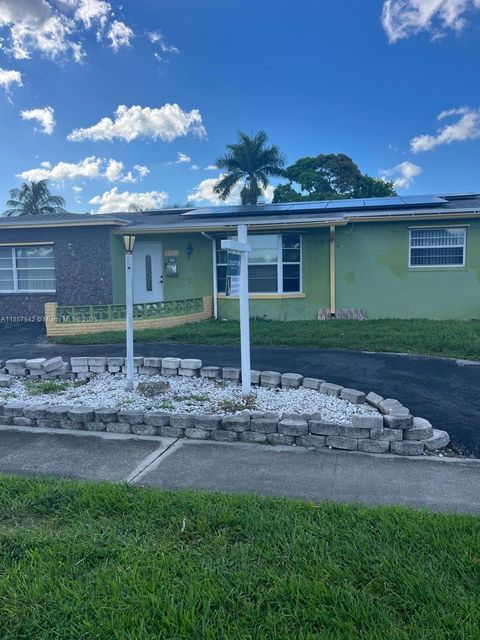
Active
$179,777
2
bds
|
2
ba
|
1,399
sqft
|
built
1981
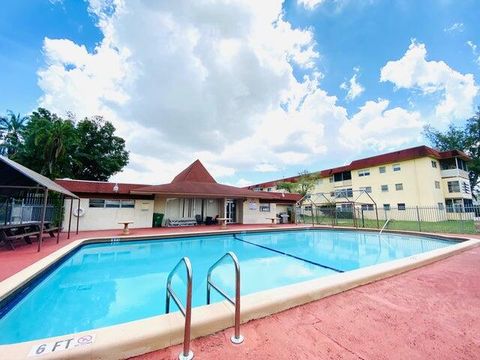
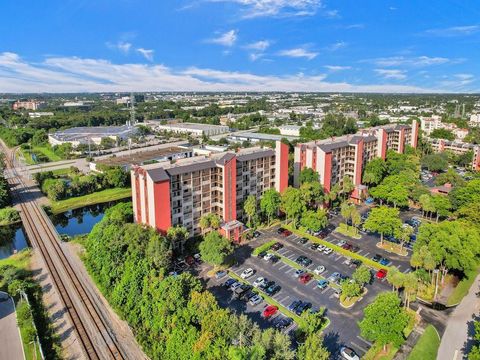
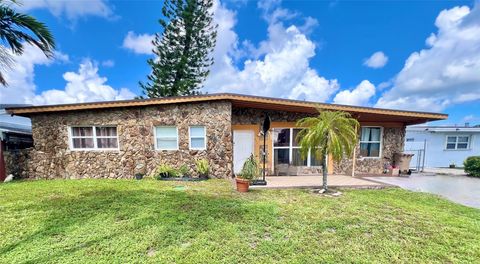
2200 S Cypress Bend Dr, Pompano Beach, FL 33069
$-406
Cash flow
-11.8%
Cash-on-Cash Return
3.4%
Cap rate
1.4%
Rent to Value Ratio
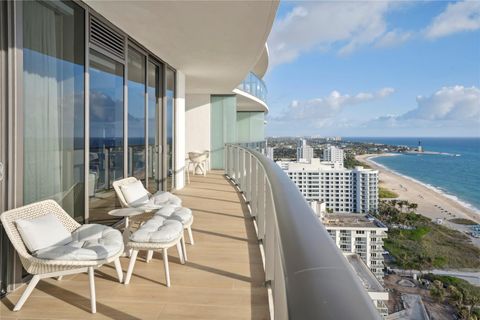
Active
$557,000
3
bds
|
3
ba
|
1,378
sqft
|
built
1990
4190 SW 70th Ter, Davie, FL 33314
$-1,085
Cash flow
-10.2%
Cash-on-Cash Return
3.8%
Cap rate
0.6%
Rent to Value Ratio

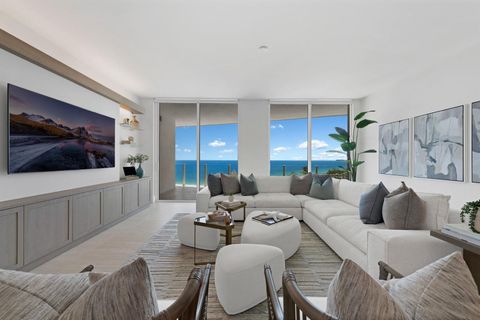
Active
$550,000
3
bds
|
2
ba
|
1,523
sqft
|
built
1958
6670 Perry St, Hollywood, FL 33024
$-819
Cash flow
-7.8%
Cash-on-Cash Return
4.4%
Cap rate
0.6%
Rent to Value Ratio
Active
$349,900
2
bds
|
2
ba
|
1,217
sqft
|
built
1978
185 SE 7th St, Deerfield Beach, FL 33441
$-1,087
Cash flow
-16.2%
Cash-on-Cash Return
2.4%
Cap rate
0.7%
Rent to Value Ratio
Active
$649,000
2
bds
|
3
ba
|
1,498
sqft
|
built
1981
1100 SE 5th Ct, Pompano Beach, FL 33060
$-2,754
Cash flow
-22.1%
Cash-on-Cash Return
1.1%
Cap rate
0.6%
Rent to Value Ratio
Active
$350,000
3
bds
|
3
ba
|
1,620
sqft
|
built
1979
4020 W Palm Aire Dr, Pompano Beach, FL 33069
$-1,457
Cash flow
-21.7%
Cash-on-Cash Return
1.2%
Cap rate
0.7%
Rent to Value Ratio
Active
$1,100,000
5
bds
|
3
ba
|
3,214
sqft
|
built
1997
11253 NW 49th St, Coral Springs, FL 33076
$-2,760
Cash flow
-13.1%
Cash-on-Cash Return
3.1%
Cap rate
0.5%
Rent to Value Ratio
Active
$775,000
3
bds
|
2
ba
|
1,608
sqft
|
built
1976
5217 SW 87th Ave, Cooper City, FL 33328
$-1,831
Cash flow
-12.3%
Cash-on-Cash Return
3.3%
Cap rate
0.5%
Rent to Value Ratio
Active
$570,000
4
bds
|
3
ba
|
1,638
sqft
|
built
1974
8231 SW 9th St, North Lauderdale, FL 33068
$-1,067
Cash flow
-9.8%
Cash-on-Cash Return
3.9%
Cap rate
0.6%
Rent to Value Ratio
Active
$790,000
5
bds
|
3
ba
|
2,951
sqft
|
built
2001
2310 SW 127th Ave, Miramar, FL 33027
$-2,196
Cash flow
-14.5%
Cash-on-Cash Return
2.8%
Cap rate
0.5%
Rent to Value Ratio
Active
$219,900
2
bds
|
2
ba
|
1,075
sqft
|
built
1988
3300 NW 46th St, Oakland Park, FL 33309
$-550
Cash flow
-13.0%
Cash-on-Cash Return
3.1%
Cap rate
0.9%
Rent to Value Ratio
Active
$5,400,000
2
bds
|
0
ba
|
1,250
sqft
|
built
2008
1316 NW 3rd St, Fort Lauderdale, FL 33311
$-26,789
Cash flow
-25.9%
Cash-on-Cash Return
0.2%
Cap rate
0.0%
Rent to Value Ratio
Active
$509,000
2
bds
|
3
ba
|
1,610
sqft
|
built
2019
4645 Caspian Way, Davie, FL 33314
$-1,517
Cash flow
-15.5%
Cash-on-Cash Return
2.6%
Cap rate
0.6%
Rent to Value Ratio
Active
$275,000
2
bds
|
2
ba
|
984
sqft
|
built
1970
4500 N Federal Hwy, Lighthouse Point, FL 33064
$-685
Cash flow
-13.0%
Cash-on-Cash Return
3.2%
Cap rate
0.7%
Rent to Value Ratio
Active
$169,000
2
bds
|
2
ba
|
899
sqft
|
built
1966
1001 Hillcrest Ct, Hollywood, FL 33021
$-388
Cash flow
-12.0%
Cash-on-Cash Return
3.4%
Cap rate
1.3%
Rent to Value Ratio
Active
$2,925,000
3
bds
|
4
ba
|
2,356
sqft
|
built
2013
3951 S Ocean Dr, Hollywood, FL 33019
$-13,855
Cash flow
-24.7%
Cash-on-Cash Return
0.5%
Cap rate
0.3%
Rent to Value Ratio
Active
$359,900
1
bds
|
2
ba
|
900
sqft
|
built
1974
1301 River Reach Dr, Fort Lauderdale, FL 33315
$-1,526
Cash flow
-22.1%
Cash-on-Cash Return
1.1%
Cap rate
0.6%
Rent to Value Ratio
Active
$1,169,000
3
bds
|
3
ba
|
2,522
sqft
|
built
1977
3100 NE 48th St, Fort Lauderdale, FL 33308
$-3,106
Cash flow
-13.9%
Cash-on-Cash Return
3.0%
Cap rate
0.7%
Rent to Value Ratio
Active
$490,000
3
bds
|
1
ba
|
1,318
sqft
|
built
1956
804 NE 2nd St, Hallandale Beach, FL 33009
$-924
Cash flow
-9.8%
Cash-on-Cash Return
3.9%
Cap rate
0.7%
Rent to Value Ratio
Active
$740,000
1
bds
|
1
ba
|
844
sqft
|
built
2006
1830 S Ocean Dr, Hallandale Beach, FL 33009
$-2,885
Cash flow
-20.3%
Cash-on-Cash Return
1.5%
Cap rate
0.6%
Rent to Value Ratio
Active
$283,000
2
bds
|
2
ba
|
960
sqft
|
built
1985
3086 S Oakland Forest Dr, Oakland Park, FL 33309
$-672
Cash flow
-12.4%
Cash-on-Cash Return
3.3%
Cap rate
0.8%
Rent to Value Ratio
Active
$439,000
4
bds
|
2
ba
|
1,369
sqft
|
built
1960
5751 SW 54th Ave, Davie, FL 33314
$-688
Cash flow
-8.2%
Cash-on-Cash Return
4.3%
Cap rate
0.7%
Rent to Value Ratio
Active
$610,000
4
bds
|
2
ba
|
1,603
sqft
|
built
1967
5305 Johnson St, Hollywood, FL 33021
$-511
Cash flow
-4.4%
Cash-on-Cash Return
5.1%
Cap rate
0.6%
Rent to Value Ratio
Active
$490,000
4
bds
|
2
ba
|
2,138
sqft
|
built
1968
3401 NW 40th St, Lauderdale Lakes, FL 33309
$-560
Cash flow
-6.0%
Cash-on-Cash Return
4.8%
Cap rate
0.7%
Rent to Value Ratio
Active
$2,850,000
2
bds
|
3
ba
|
2,037
sqft
|
built
2023
1116 N Ocean Blvd, Pompano Beach, FL 33062
$-11,214
Cash flow
-20.5%
Cash-on-Cash Return
1.4%
Cap rate
0.3%
Rent to Value Ratio
Active
$5,250,000
3
bds
|
4
ba
|
2,340
sqft
|
built
2022
525 N Fort Lauderdale Beach Blvd, Fort Lauderdale, FL 33304
$-31,950
Cash flow
-31.8%
Cash-on-Cash Return
-1.2%
Cap rate
0.2%
Rent to Value Ratio

Active
$1,250,000
2
bds
|
2
ba
|
1,120
sqft
|
built
1956
814 SE 14th Ct, Fort Lauderdale, FL 33316
$-4,065
Cash flow
-17.0%
Cash-on-Cash Return
2.2%
Cap rate
0.4%
Rent to Value Ratio

Active
$889,000
4
bds
|
3
ba
|
2,503
sqft
|
built
1990
9351 NW 10th Ct, Plantation, FL 33322
$-2,409
Cash flow
-14.1%
Cash-on-Cash Return
2.9%
Cap rate
0.4%
Rent to Value Ratio

Active
$450,000
4
bds
|
2
ba
|
1,643
sqft
|
built
1990
2701 NE 9th Ave, Pompano Beach, FL 33064
$-284
Cash flow
-3.3%
Cash-on-Cash Return
5.4%
Cap rate
0.9%
Rent to Value Ratio
Active
$350,000
2
bds
|
1
ba
|
728
sqft
|
built
1963
2625 NW 10th St, Pompano Beach, FL 33069
$-758
Cash flow
-11.3%
Cash-on-Cash Return
3.5%
Cap rate
0.6%
Rent to Value Ratio
Active
$599,900
3
bds
|
2
ba
|
0
sqft
|
built
1967
120 NW 77th Way, Pembroke Pines, FL 33024
$-1,416
Cash flow
-12.3%
Cash-on-Cash Return
3.3%
Cap rate
0.7%
Rent to Value Ratio
Active
$375,000
2
bds
|
1
ba
|
1,105
sqft
|
built
1961
341 NW 55th St, Oakland Park, FL 33309
$-654
Cash flow
-9.1%
Cash-on-Cash Return
4.1%
Cap rate
0.7%
Rent to Value Ratio
Active
$265,000
2
bds
|
2
ba
|
1,039
sqft
|
built
1967
180 NE 12th Ave, Hallandale Beach, FL 33009
$-597
Cash flow
-11.8%
Cash-on-Cash Return
3.4%
Cap rate
0.9%
Rent to Value Ratio

Active
$669,900
3
bds
|
3
ba
|
2,146
sqft
|
built
1950
433 N 26th Ave, Hollywood, FL 33020
$-1,729
Cash flow
-13.5%
Cash-on-Cash Return
3.1%
Cap rate
0.5%
Rent to Value Ratio
Active
$329,900
2
bds
|
2
ba
|
1,081
sqft
|
built
2005
5820 W Sample Rd, Coral Springs, FL 33067
$-1,236
Cash flow
-19.5%
Cash-on-Cash Return
1.7%
Cap rate
0.7%
Rent to Value Ratio

Active
$389,000
2
bds
|
1
ba
|
800
sqft
|
built
1951
3910 SW 25th St, West Park, FL 33023
$-643
Cash flow
-8.6%
Cash-on-Cash Return
4.2%
Cap rate
0.6%
Rent to Value Ratio
Active
$2,375,000
3
bds
|
4
ba
|
2,857
sqft
|
built
2006
3535 S Ocean Dr, Hollywood, FL 33019
$-11,775
Cash flow
-25.9%
Cash-on-Cash Return
0.2%
Cap rate
0.4%
Rent to Value Ratio