Broward County Investment Properties for Sale
Browse homes for sale and investment properties in Broward County. Refine your search by price, property type, or more.
Best cash flowing properties in Broward County
Active
$159,000
1
bds
|
1
ba
|
450
sqft
|
built
1966
1301 N 12th Ct, Hollywood, FL 33019
$-312
Cash flow
-10.2%
Cash-on-Cash Return
3.8%
Cap rate
1.0%
Rent to Value Ratio
Active
$150,000
2
bds
|
1
ba
|
870
sqft
|
built
1964
455 Golden Isles Dr, Hallandale Beach, FL 33009
$-422
Cash flow
-14.7%
Cash-on-Cash Return
2.8%
Cap rate
1.5%
Rent to Value Ratio
7,941 out of 9,280 properties for sale in Broward County
Limited Results Shown
Create a free account, or log in to reveal all property listings and enjoy the complete experience.
Active
$899,000
3
bds
|
3
ba
|
2,230
sqft
|
built
1999
320 NE 7th Ave, Fort Lauderdale, FL 33301
$-2,503
Cash flow
-14.5%
Cash-on-Cash Return
2.8%
Cap rate
0.6%
Rent to Value Ratio
Active
$234,000
1
bds
|
1
ba
|
722
sqft
|
built
1973
801 NE 18th Ct, Fort Lauderdale, FL 33305
$-865
Cash flow
-19.3%
Cash-on-Cash Return
1.7%
Cap rate
0.8%
Rent to Value Ratio
Active
$925,000
4
bds
|
3
ba
|
2,607
sqft
|
built
1989
3140 Maple Ln, Davie, FL 33328
$-2,021
Cash flow
-11.4%
Cash-on-Cash Return
3.5%
Cap rate
0.6%
Rent to Value Ratio
Active
$469,000
3
bds
|
3
ba
|
1,935
sqft
|
built
2009
4759 Cypress St, Coconut Creek, FL 33073
$-983
Cash flow
-10.9%
Cash-on-Cash Return
3.6%
Cap rate
0.7%
Rent to Value Ratio
Active
$799,900
4
bds
|
3
ba
|
2,634
sqft
|
built
2002
12974 SW 24th St, Miramar, FL 33027
$-1,471
Cash flow
-9.6%
Cash-on-Cash Return
3.9%
Cap rate
0.6%
Rent to Value Ratio
Active
$415,000
2
bds
|
1
ba
|
897
sqft
|
built
1965
7740 NW 15th Ct, Pembroke Pines, FL 33024
$-750
Cash flow
-9.4%
Cash-on-Cash Return
4.0%
Cap rate
0.6%
Rent to Value Ratio
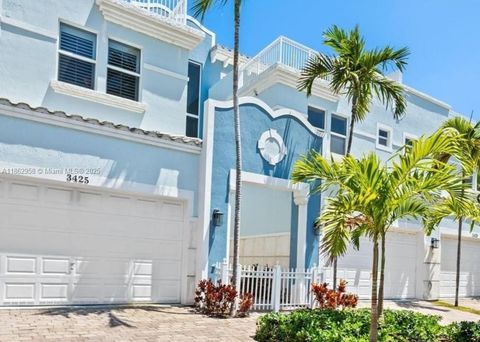
Active
$1,195,000
3
bds
|
4
ba
|
2,502
sqft
|
built
2005
3425 Norfolk St, Pompano Beach, FL 33062
$-1,848
Cash flow
-8.1%
Cash-on-Cash Return
4.3%
Cap rate
0.7%
Rent to Value Ratio
Active
$460,000
3
bds
|
2
ba
|
1,144
sqft
|
built
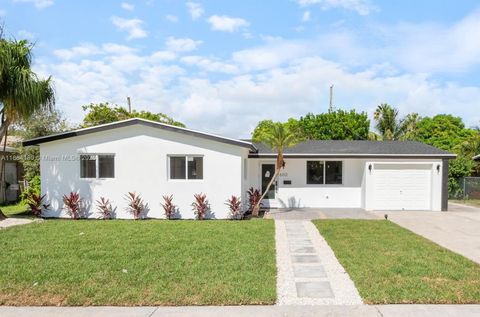
1954
640 E Melrose Cir, Fort Lauderdale, FL 33312
$-808
Cash flow
-9.2%
Cash-on-Cash Return
4.0%
Cap rate
0.7%
Rent to Value Ratio
Active
$350,000
4
bds
|
3
ba
|
1,865
sqft
|
built
1973
94 Pleasant Hill Ln, Tamarac, FL 33319
$-1,071
Cash flow
-16.0%
Cash-on-Cash Return
2.5%
Cap rate
0.7%
Rent to Value Ratio
Active
$259,000
2
bds
|
2
ba
|
914
sqft
|
built
1986
721 NW 103rd Ter, Pembroke Pines, FL 33026
$-583
Cash flow
-11.7%
Cash-on-Cash Return
3.4%
Cap rate
0.8%
Rent to Value Ratio
Active
$675,000
3
bds
|
2
ba
|
1,774
sqft
|
built
1993
15661 SW 16th Ct, Pembroke Pines, FL 33027
$-1,586
Cash flow
-12.3%
Cash-on-Cash Return
3.3%
Cap rate
0.6%
Rent to Value Ratio
Active
$900,000
5
bds
|
3
ba
|
3,501
sqft
|
built
2002
5062 SW 167th Ave, Miramar, FL 33027
$-1,097
Cash flow
-6.4%
Cash-on-Cash Return
4.7%
Cap rate
0.7%
Rent to Value Ratio
Active
$799,999
3
bds
|
3
ba
|
2,234
sqft
|
built
2002
7284 NW 116th Way, Parkland, FL 33076
$-1,433
Cash flow
-9.3%
Cash-on-Cash Return
4.0%
Cap rate
0.7%
Rent to Value Ratio
Active
$474,987
3
bds
|
3
ba
|
1,428
sqft
|
built
1997
449 SW 122nd Ter, Pembroke Pines, FL 33025
$-1,161
Cash flow
-12.8%
Cash-on-Cash Return
3.2%
Cap rate
0.7%
Rent to Value Ratio
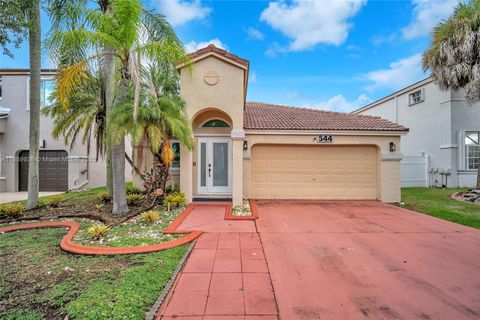
Active
$640,000
3
bds
|
2
ba
|
1,582
sqft
|
built
1995
544 NW 159th Ln, Pembroke Pines, FL 33028
$-1,604
Cash flow
-13.1%
Cash-on-Cash Return
3.1%
Cap rate
0.6%
Rent to Value Ratio
Active
$949,999
3
bds
|
3
ba
|
2,720
sqft
|
built
1979
2557 SW 14th Ct, Deerfield Beach, FL 33442
$-2,002
Cash flow
-11.0%
Cash-on-Cash Return
3.6%
Cap rate
0.6%
Rent to Value Ratio
Active
$550,000
4
bds
|
2
ba
|
1,829
sqft
|
built
1975
7821 NW 45th St, Lauderhill, FL 33351
$-698
Cash flow
-6.6%
Cash-on-Cash Return
4.6%
Cap rate
0.7%
Rent to Value Ratio
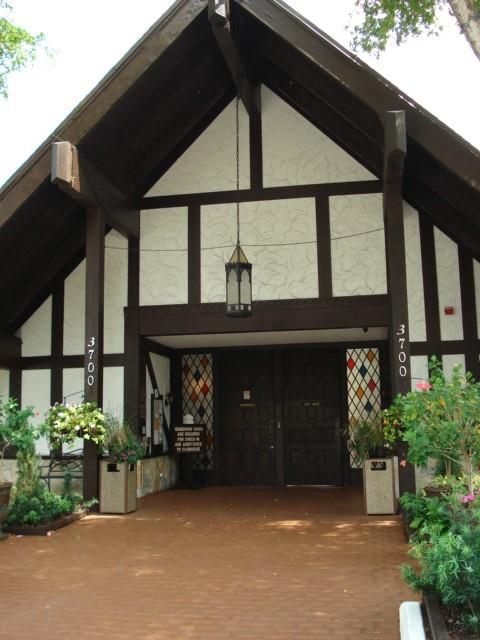
Active
$175,000
2
bds
|
2
ba
|
1,260
sqft
|
built
1973
3720 Inverrary Dr, Lauderhill, FL 33319
$-535
Cash flow
-16.0%
Cash-on-Cash Return
2.5%
Cap rate
1.1%
Rent to Value Ratio
Active
$648,800
3
bds
|
2
ba
|
1,624
sqft
|
built
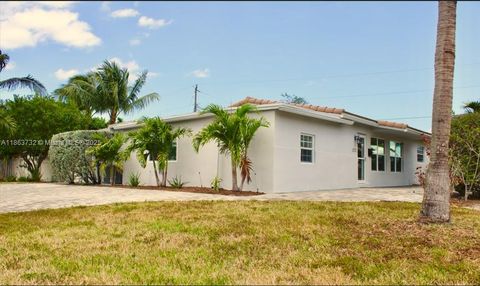
1979
2731 S Parkview Dr, Hallandale Beach, FL 33009
$-2,685
Cash flow
-21.6%
Cash-on-Cash Return
1.2%
Cap rate
0.5%
Rent to Value Ratio
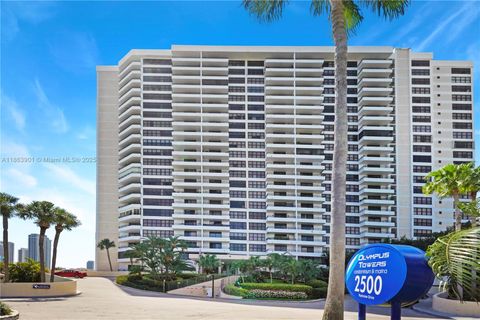
Active
$500,000
1
bds
|
2
ba
|
950
sqft
|
built
1980
2500 Parkview Dr, Hallandale Beach, FL 33009
$-2,293
Cash flow
-23.9%
Cash-on-Cash Return
0.6%
Cap rate
0.5%
Rent to Value Ratio
Active
$325,000
3
bds
|
2
ba
|
1,200
sqft
|
built
1974
7173 Orange Dr, Davie, FL 33314
$-764
Cash flow
-12.3%
Cash-on-Cash Return
3.3%
Cap rate
0.9%
Rent to Value Ratio
Active
$600,000
3
bds
|
2
ba
|
1,495
sqft
|
built
1998
5065 NW 121st Dr, Coral Springs, FL 33076
$-1,285
Cash flow
-11.2%
Cash-on-Cash Return
3.6%
Cap rate
0.6%
Rent to Value Ratio
Active
$490,000
3
bds
|
3
ba
|
1,779
sqft
|
built
1992
4850 Grapevine Way, Davie, FL 33331
$-1,360
Cash flow
-14.5%
Cash-on-Cash Return
2.8%
Cap rate
0.7%
Rent to Value Ratio
Active
$505,000
4
bds
|
2
ba
|
1,511
sqft
|
built
1966
2609 SW 13th Pl, Fort Lauderdale, FL 33312
$-1,443
Cash flow
-14.9%
Cash-on-Cash Return
2.7%
Cap rate
0.5%
Rent to Value Ratio
Active
$160,000
2
bds
|
2
ba
|
1,156
sqft
|
built
1978
4401 Martinique Ct, Coconut Creek, FL 33066
$-620
Cash flow
-20.2%
Cash-on-Cash Return
1.5%
Cap rate
1.0%
Rent to Value Ratio
Active
$1,150,000
3
bds
|
2
ba
|
1,734
sqft
|
built
1950
1426 Tyler St, Hollywood, FL 33020
$-1,898
Cash flow
-8.6%
Cash-on-Cash Return
4.2%
Cap rate
0.7%
Rent to Value Ratio
Active
$2,450,000
4
bds
|
4
ba
|
3,056
sqft
|
built
2018
2516 NE 32nd Ave, Fort Lauderdale, FL 33305
$-8,161
Cash flow
-17.4%
Cash-on-Cash Return
2.1%
Cap rate
0.4%
Rent to Value Ratio
Active
$619,000
4
bds
|
2
ba
|
1,952
sqft
|
built
1972
3170 NW 69th St, Fort Lauderdale, FL 33309
$-1,704
Cash flow
-14.4%
Cash-on-Cash Return
2.8%
Cap rate
0.5%
Rent to Value Ratio
Active
$519,000
3
bds
|
2
ba
|
1,665
sqft
|
built
1959
620 N 64th Ave, Hollywood, FL 33024
$-849
Cash flow
-8.5%
Cash-on-Cash Return
4.2%
Cap rate
0.5%
Rent to Value Ratio
Active
$389,900
2
bds
|
2
ba
|
1,194
sqft
|
built
1987
7808 NW 60th St, Tamarac, FL 33321
$-548
Cash flow
-7.3%
Cash-on-Cash Return
4.5%
Cap rate
0.6%
Rent to Value Ratio
Active
$649,999
3
bds
|
2
ba
|
1,699
sqft
|
built
1960
600 SW 64th Pkwy, Pembroke Pines, FL 33023
$-1,299
Cash flow
-10.4%
Cash-on-Cash Return
3.7%
Cap rate
0.5%
Rent to Value Ratio
Active
$359,000
3
bds
|
2
ba
|
1,756
sqft
|
built
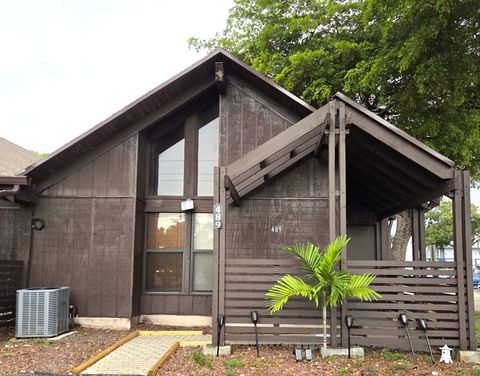
1978
489 N University Dr, Plantation, FL 33324
$-1,013
Cash flow
-14.7%
Cash-on-Cash Return
2.8%
Cap rate
0.9%
Rent to Value Ratio
Active
$229,800
2
bds
|
2
ba
|
920
sqft
|
built
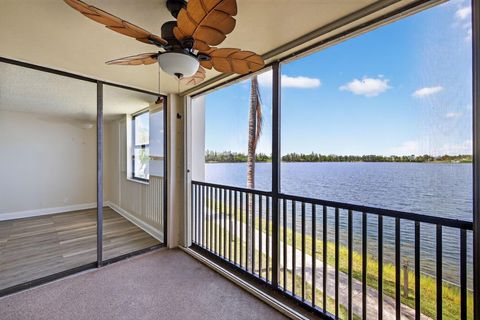
1986
117 Lake Emerald Dr, Oakland Park, FL 33309
$-609
Cash flow
-13.8%
Cash-on-Cash Return
3.0%
Cap rate
0.9%
Rent to Value Ratio
Active
$950,000
4
bds
|
3
ba
|
2,050
sqft
|
built
1963
1301 NE 42nd St, Oakland Park, FL 33334
$-2,243
Cash flow
-12.3%
Cash-on-Cash Return
3.3%
Cap rate
0.6%
Rent to Value Ratio

Active
$489,900
3
bds
|
2
ba
|
1,127
sqft
|
built
1973
520 SW 81st Ter, North Lauderdale, FL 33068
$-815
Cash flow
-8.7%
Cash-on-Cash Return
4.2%
Cap rate
0.7%
Rent to Value Ratio
Active
$679,000
3
bds
|
2
ba
|
1,764
sqft
|
built
1991
3835 Lombardy St, Hollywood, FL 33021
$-1,631
Cash flow
-12.5%
Cash-on-Cash Return
3.3%
Cap rate
0.5%
Rent to Value Ratio
Active
$2,600,000
5
bds
|
4
ba
|
3,191
sqft
|
built
2002
920 SE 6th St, Fort Lauderdale, FL 33301
$-8,660
Cash flow
-17.4%
Cash-on-Cash Return
2.1%
Cap rate
0.3%
Rent to Value Ratio
Active
$1,010,000
3
bds
|
3
ba
|
1,866
sqft
|
built
1956
2413 Nassau Ln, Fort Lauderdale, FL 33312
$-2,307
Cash flow
-11.9%
Cash-on-Cash Return
3.4%
Cap rate
0.6%
Rent to Value Ratio