Broward County Investment Properties for Sale
Browse homes for sale and investment properties in Broward County. Refine your search by price, property type, or more.
Best cash flowing properties in Broward County
Active
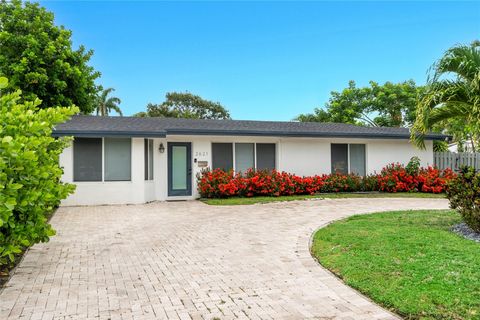
$869,000
3
bds
|
4
ba
|
1,519
sqft
|
built
1956
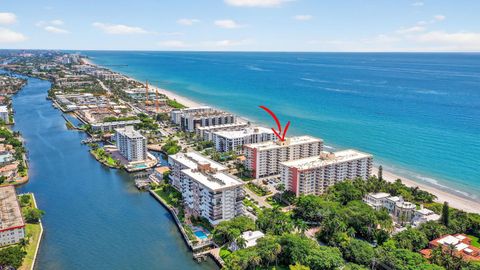
2621 NE 20th Ave, Lighthouse Point, FL 33064
$-110
Cash flow
-0.7%
Cash-on-Cash Return
6.0%
Cap rate
0.9%
Rent to Value Ratio
Active
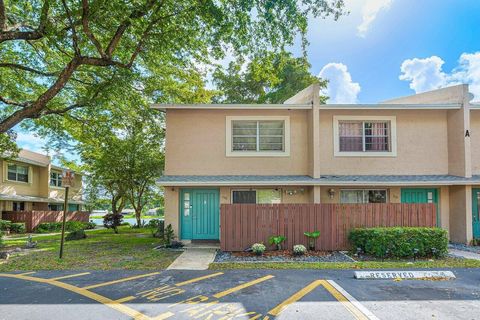
$312,000
2
bds
|
2
ba
|
1,224
sqft
|
built
1979
756 Banks Rd, Coconut Creek, FL 33063
$-315
Cash flow
-5.3%
Cash-on-Cash Return
4.9%
Cap rate
0.8%
Rent to Value Ratio
7,898 out of 9,234 properties for sale in Broward County
Limited Results Shown
Create a free account, or log in to reveal all property listings and enjoy the complete experience.
Active
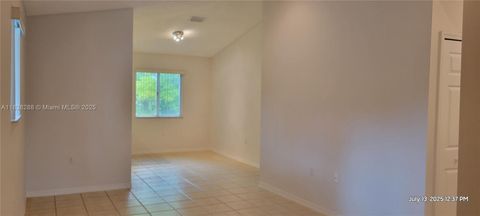
$330,000
3
bds
|
2
ba
|
1,009
sqft
|
built
2001
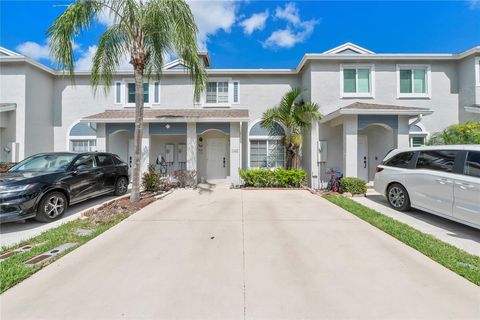
2125 NW 77th Way, Pembroke Pines, FL 33024
$-813
Cash flow
-12.9%
Cash-on-Cash Return
3.2%
Cap rate
0.8%
Rent to Value Ratio
Active
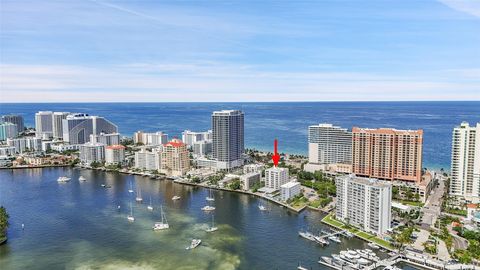
$420,000
1
bds
|
1
ba
|
795
sqft
|
built
1970
95 N Birch Rd, Fort Lauderdale, FL 33304
$-1,375
Cash flow
-17.1%
Cash-on-Cash Return
2.2%
Cap rate
0.8%
Rent to Value Ratio
Active
$780,000
4
bds
|
3
ba
|
2,346
sqft
|
built
1969
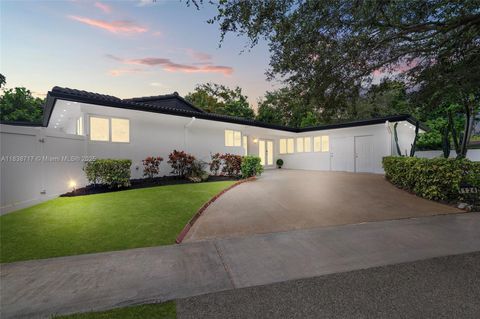
1730 N 55th Ave, Hollywood, FL 33021
$-1,639
Cash flow
-11.0%
Cash-on-Cash Return
3.6%
Cap rate
0.6%
Rent to Value Ratio
Active
$3,299,000
7
bds
|
5
ba
|
5,042
sqft
|
built
1993
2914 Medinah, Weston, FL 33332
$-14,455
Cash flow
-22.9%
Cash-on-Cash Return
0.9%
Cap rate
0.2%
Rent to Value Ratio
Active
$250,000
2
bds
|
2
ba
|
725
sqft
|
built
1973
2400 NE 10th St, Pompano Beach, FL 33062
$-753
Cash flow
-15.7%
Cash-on-Cash Return
2.5%
Cap rate
0.8%
Rent to Value Ratio
Active
$689,000
3
bds
|
3
ba
|
2,093
sqft
|
built
2001
19459 SW 29th Ct, Miramar, FL 33029
$-2,128
Cash flow
-16.1%
Cash-on-Cash Return
2.4%
Cap rate
0.6%
Rent to Value Ratio
Active
$219,000
3
bds
|
2
ba
|
1,365
sqft
|
built
1974
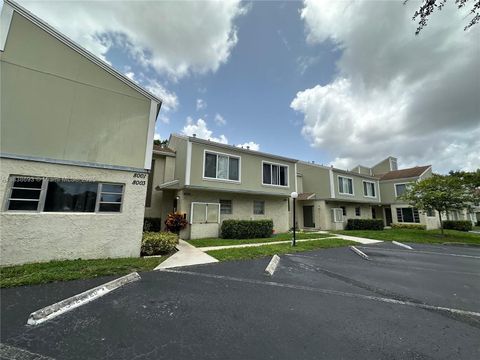
8103 NW 27th St, Coral Springs, FL 33065
$-622
Cash flow
-14.8%
Cash-on-Cash Return
2.7%
Cap rate
1.1%
Rent to Value Ratio
Active
$250,000
1
bds
|
2
ba
|
870
sqft
|
built
1972
1985 S Ocean Dr, Hallandale Beach, FL 33009
$-8,302
Cash flow
-173.3%
Cash-on-Cash Return
-33.7%
Cap rate
1.0%
Rent to Value Ratio
Active
$190,000
1
bds
|
2
ba
|
847
sqft
|
built
1969
218 NE 12th Ave, Hallandale Beach, FL 33009
$-336
Cash flow
-9.2%
Cash-on-Cash Return
4.0%
Cap rate
0.9%
Rent to Value Ratio
Active
$263,000
1
bds
|
1
ba
|
756
sqft
|
built
2007
510 NW 84th Ave, Plantation, FL 33324
$-1,392
Cash flow
-27.6%
Cash-on-Cash Return
-0.2%
Cap rate
0.8%
Rent to Value Ratio
Active
$475,000
2
bds
|
2
ba
|
1,044
sqft
|
built
1981
11730 NW 33rd St, Sunrise, FL 33323
$-612
Cash flow
-6.7%
Cash-on-Cash Return
4.6%
Cap rate
0.6%
Rent to Value Ratio
Active
$560,000
4
bds
|
2
ba
|
1,597
sqft
|
built
1990
9862 NW 2nd St, Plantation, FL 33324
$-1,284
Cash flow
-12.0%
Cash-on-Cash Return
3.4%
Cap rate
0.5%
Rent to Value Ratio
Active
$609,000
3
bds
|
3
ba
|
2,306
sqft
|
built
2006
1812 Coral Heights Ln, Oakland Park, FL 33308
$-1,849
Cash flow
-15.8%
Cash-on-Cash Return
2.5%
Cap rate
0.7%
Rent to Value Ratio
Active
$579,000
2
bds
|
2
ba
|
1,122
sqft
|
built
1949
1141 SW 8th Ter, Fort Lauderdale, FL 33315
$-813
Cash flow
-7.3%
Cash-on-Cash Return
4.5%
Cap rate
0.6%
Rent to Value Ratio
Active
$480,000
2
bds
|
2
ba
|
1,200
sqft
|
built
1971
1149 Hillsboro Mile, Hillsboro Beach, FL 33062
$-2,559
Cash flow
-27.8%
Cash-on-Cash Return
-0.3%
Cap rate
0.7%
Rent to Value Ratio

Active
$1,595,000
3
bds
|
3
ba
|
2,350
sqft
|
built
1965
2109 NE 64th St, Fort Lauderdale, FL 33308
$-5,050
Cash flow
-16.5%
Cash-on-Cash Return
2.3%
Cap rate
0.3%
Rent to Value Ratio
Active
$340,000
2
bds
|
3
ba
|
1,286
sqft
|
built
2000
1367 SW 48th Ter, Deerfield Beach, FL 33442
$-792
Cash flow
-12.2%
Cash-on-Cash Return
3.4%
Cap rate
0.7%
Rent to Value Ratio
Active
$950,000
4
bds
|
4
ba
|
1,734
sqft
|
built
1961
1124 Yale Dr, Hollywood, FL 33021
$-1,191
Cash flow
-6.5%
Cash-on-Cash Return
4.6%
Cap rate
0.7%
Rent to Value Ratio
Active
$200,000
2
bds
|
2
ba
|
1,072
sqft
|
built
1975
8005 Lagos De Campo Blvd, Tamarac, FL 33321
$-788
Cash flow
-20.6%
Cash-on-Cash Return
1.4%
Cap rate
1.0%
Rent to Value Ratio
Active
$499,000
3
bds
|
2
ba
|
1,760
sqft
|
built
1991
7525 NW 61st Ter, Parkland, FL 33067
$-1,041
Cash flow
-10.9%
Cash-on-Cash Return
3.6%
Cap rate
0.6%
Rent to Value Ratio
Active
$875,000
4
bds
|
2
ba
|
2,482
sqft
|
built
1991
3136 Peachtree Cir, Davie, FL 33328
$-2,405
Cash flow
-14.3%
Cash-on-Cash Return
2.8%
Cap rate
0.6%
Rent to Value Ratio
Active
$189,900
2
bds
|
1
ba
|
832
sqft
|
built
1982
8560 N Sherman Cir, Miramar, FL 33025
$-374
Cash flow
-10.3%
Cash-on-Cash Return
3.8%
Cap rate
1.1%
Rent to Value Ratio

Active
$470,000
3
bds
|
2
ba
|
1,537
sqft
|
built
1975
9540 NW 25th St, Sunrise, FL 33322
$-969
Cash flow
-10.8%
Cash-on-Cash Return
3.7%
Cap rate
0.7%
Rent to Value Ratio
Active
$710,000
3
bds
|
3
ba
|
2,056
sqft
|
built
1991
15281 Wilshire Ct, Pembroke Pines, FL 33027
$-1,683
Cash flow
-12.4%
Cash-on-Cash Return
3.3%
Cap rate
0.6%
Rent to Value Ratio
Active
$295,000
2
bds
|
2
ba
|
1,400
sqft
|
built
1975
600 Three Islands Blvd, Hallandale Beach, FL 33009
$-1,191
Cash flow
-21.1%
Cash-on-Cash Return
1.3%
Cap rate
1.0%
Rent to Value Ratio
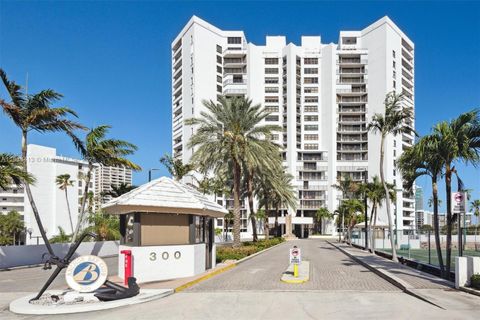
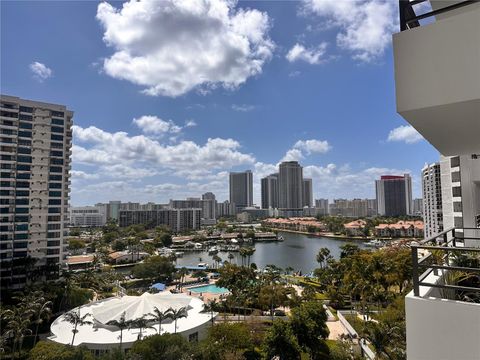
Active
$375,000
1
bds
|
2
ba
|
1,221
sqft
|
built
1987
300 Three Islands Blvd, Hallandale Beach, FL 33009
$-600
Cash flow
-8.3%
Cash-on-Cash Return
4.2%
Cap rate
0.7%
Rent to Value Ratio
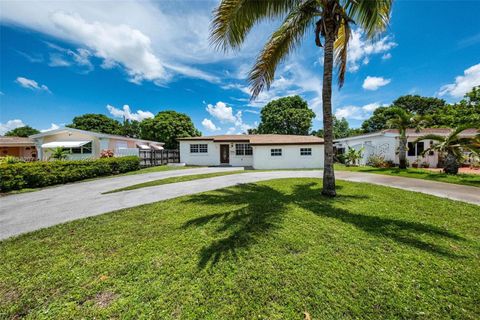
Active
$495,000
4
bds
|
2
ba
|
1,571
sqft
|
built
1959
7521 Indigo St, Miramar, FL 33023
$-969
Cash flow
-10.2%
Cash-on-Cash Return
3.8%
Cap rate
0.6%
Rent to Value Ratio
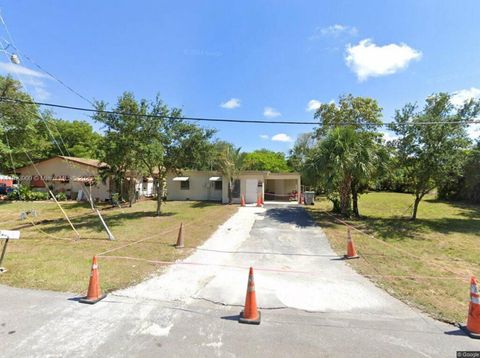
Active
$499,999
3
bds
|
1
ba
|
988
sqft
|
built
1959
894 SW 9th Ct, Pompano Beach, FL 33060
$-1,422
Cash flow
-14.8%
Cash-on-Cash Return
2.7%
Cap rate
0.4%
Rent to Value Ratio
Active
$450,000
1
bds
|
1
ba
|
621
sqft
|
built
1993
341 N Birch Rd, Fort Lauderdale, FL 33304
$-2,069
Cash flow
-24.0%
Cash-on-Cash Return
0.6%
Cap rate
0.6%
Rent to Value Ratio
Active
$8,800,000
5
bds
|
6
ba
|
4,690
sqft
|
built
2009
2898 NE 26th St, Fort Lauderdale, FL 33305
$-44,516
Cash flow
-26.4%
Cash-on-Cash Return
0.1%
Cap rate
0.1%
Rent to Value Ratio
Active
$620,000
3
bds
|
2
ba
|
1,619
sqft
|
built
1978
1740 NW 113th Ave, Pembroke Pines, FL 33026
$-1,118
Cash flow
-9.4%
Cash-on-Cash Return
4.0%
Cap rate
0.6%
Rent to Value Ratio
Active
$371,000
3
bds
|
2
ba
|
920
sqft
|
built
1959
2569 NW 61st Ave, Margate, FL 33063
$-568
Cash flow
-8.0%
Cash-on-Cash Return
4.3%
Cap rate
0.8%
Rent to Value Ratio
Active
$400,000
3
bds
|
2
ba
|
1,111
sqft
|
built
1963
1910 SW 63rd Ter, North Lauderdale, FL 33068
$-979
Cash flow
-12.8%
Cash-on-Cash Return
3.2%
Cap rate
0.5%
Rent to Value Ratio
Active
$2,699,000
4
bds
|
3
ba
|
2,530
sqft
|
built
1985
13500 SW 55th St, Southwest Ranches, FL 33330
$-9,639
Cash flow
-18.6%
Cash-on-Cash Return
1.9%
Cap rate
0.4%
Rent to Value Ratio
Active
$1,599,999
3
bds
|
2
ba
|
2,099
sqft
|
built
1960
340 SE 5th Ave, Pompano Beach, FL 33060
$-4,208
Cash flow
-13.7%
Cash-on-Cash Return
3.0%
Cap rate
0.6%
Rent to Value Ratio
Active
$425,000
2
bds
|
2
ba
|
1,020
sqft
|
built
1968
1200 SW 12th St, Fort Lauderdale, FL 33315
$-1,505
Cash flow
-18.5%
Cash-on-Cash Return
1.9%
Cap rate
0.7%
Rent to Value Ratio
Active
$649,000
3
bds
|
3
ba
|
1,815
sqft
|
built
1999
14125 S Cypress Cove Cir, Davie, FL 33325
$-1,790
Cash flow
-14.4%
Cash-on-Cash Return
2.8%
Cap rate
0.6%
Rent to Value Ratio
Active
$725,000
4
bds
|
3
ba
|
2,580
sqft
|
built
1998
4074 NW 62nd Dr, Coconut Creek, FL 33073
$-1,644
Cash flow
-11.8%
Cash-on-Cash Return
3.4%
Cap rate
0.7%
Rent to Value Ratio