Broward County Investment Properties for Sale
Browse homes for sale and investment properties in Broward County. Refine your search by price, property type, or more.
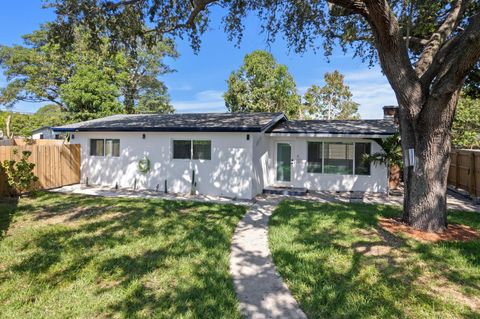
Best cash flowing properties in Broward County

Active
$120,000
2
bds
|
2
ba
|
975
sqft
|
built
1976
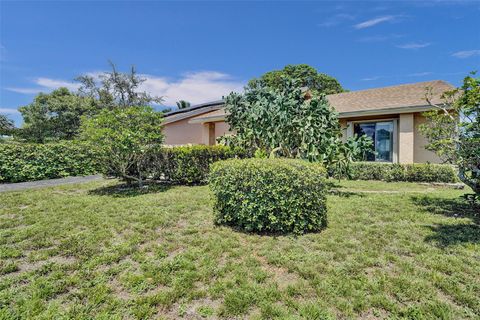
2401 NW 41st Ave, Lauderhill, FL 33313
$307
Cash flow
13.3%
Cash-on-Cash Return
9.2%
Cap rate
1.7%
Rent to Value Ratio
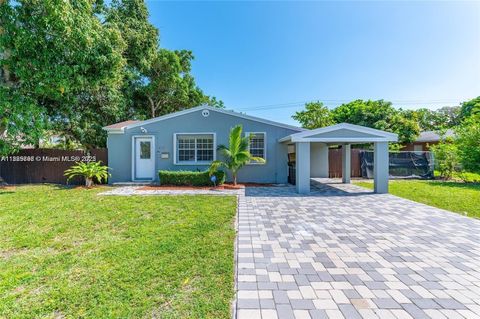
Active
$178,000
2
bds
|
2
ba
|
950
sqft
|
built
1974
4354 NW 9th Ave, Deerfield Beach, FL 33064
$-293
Cash flow
-8.6%
Cash-on-Cash Return
4.2%
Cap rate
1.1%
Rent to Value Ratio
9,033 out of 10,523 properties for sale in Broward County
Limited Results Shown
Create a free account, or log in to reveal all property listings and enjoy the complete experience.

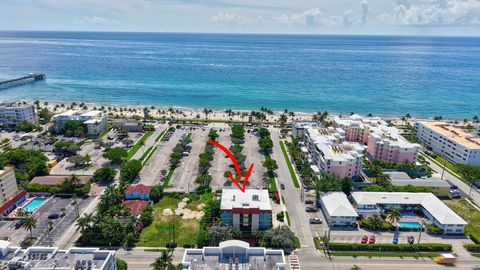
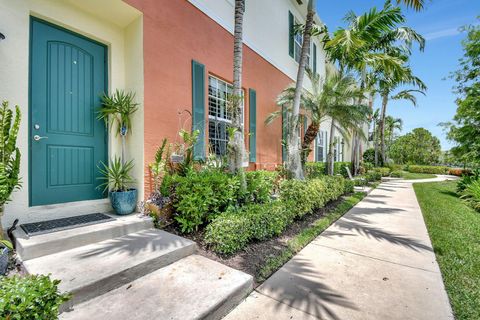
Active
$499,900
1
bds
|
1
ba
|
874
sqft
|
built
1969
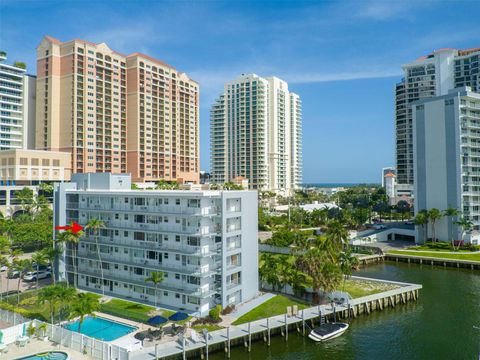
3901 S Ocean Dr, Hollywood, FL 33019
$-1,943
Cash flow
-20.3%
Cash-on-Cash Return
1.5%
Cap rate
0.6%
Rent to Value Ratio
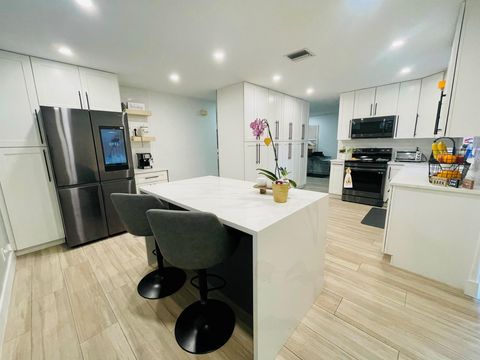
Active
$305,000
2
bds
|
2
ba
|
1,480
sqft
|
built
1984
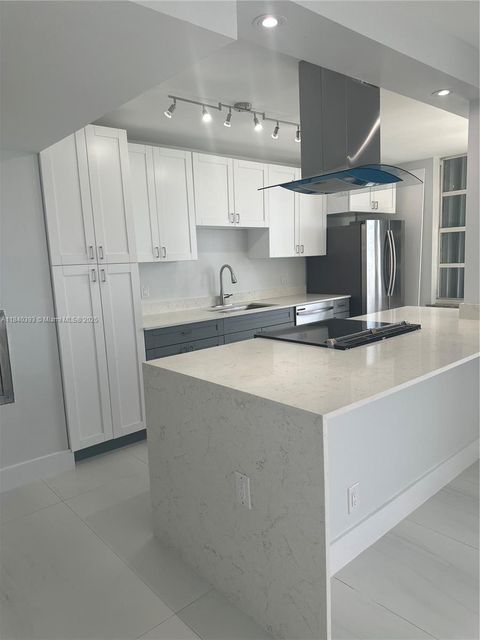
7625 NW 79th Ave, Tamarac, FL 33321
$-808
Cash flow
-13.8%
Cash-on-Cash Return
3.0%
Cap rate
0.8%
Rent to Value Ratio

Active
$255,000
2
bds
|
2
ba
|
850
sqft
|
built
1965
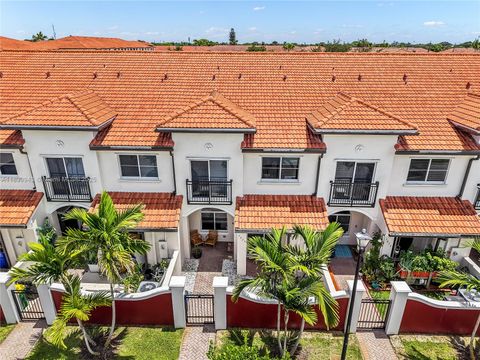
2990 NE 16th Ave, Oakland Park, FL 33334
$-1,065
Cash flow
-21.8%
Cash-on-Cash Return
1.1%
Cap rate
0.9%
Rent to Value Ratio
Active
$579,000
3
bds
|
2
ba
|
1,824
sqft
|
built
1959
1900 SW 33rd Ave, Fort Lauderdale, FL 33312
$-1,134
Cash flow
-10.2%
Cash-on-Cash Return
3.8%
Cap rate
0.7%
Rent to Value Ratio
Active
$450,000
3
bds
|
2
ba
|
1,250
sqft
|
built
1961
5219 NE 20th Ter, Pompano Beach, FL 33064
$-777
Cash flow
-9.0%
Cash-on-Cash Return
4.1%
Cap rate
0.7%
Rent to Value Ratio
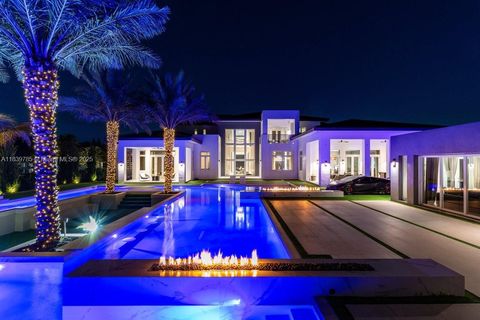
Active
$11,900,000
7
bds
|
9
ba
|
8,718
sqft
|
built
2024
17900 SW 70th Pl, Southwest Ranches, FL 33331
$-60,179
Cash flow
-26.4%
Cash-on-Cash Return
0.1%
Cap rate
0.1%
Rent to Value Ratio
Active
$259,900
2
bds
|
2
ba
|
1,160
sqft
|
built
1986
3001 N Oakland Forest Dr, Oakland Park, FL 33309
$-415
Cash flow
-8.3%
Cash-on-Cash Return
4.2%
Cap rate
0.9%
Rent to Value Ratio

Active
$530,000
bds
|
0
ba
|
1,357
sqft
|
built
1956
805 NW 12th Ave, Fort Lauderdale, FL 33311
$-990
Cash flow
-9.7%
Cash-on-Cash Return
3.9%
Cap rate
0.5%
Rent to Value Ratio

Active
$125,000
1
bds
|
2
ba
|
800
sqft
|
built
1973
3660 Inverrary Dr, Lauderhill, FL 33319
$-459
Cash flow
-19.2%
Cash-on-Cash Return
1.7%
Cap rate
1.3%
Rent to Value Ratio
Active
$525,000
3
bds
|
2
ba
|
1,500
sqft
|
built
1980
16041 Fairway Ter, Weston, FL 33326
$-2,010
Cash flow
-20.0%
Cash-on-Cash Return
1.6%
Cap rate
0.6%
Rent to Value Ratio

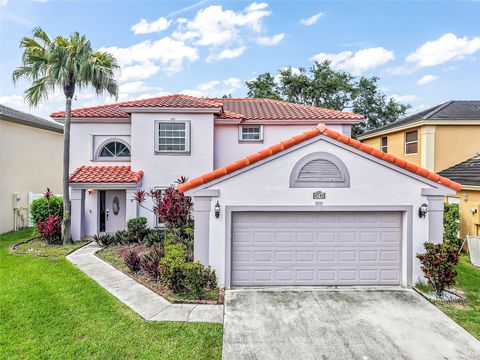
Active
$349,990
2
bds
|
3
ba
|
1,260
sqft
|
built
1980
16475 Golf Club Rd, Weston, FL 33326
$-1,070
Cash flow
-16.0%
Cash-on-Cash Return
2.5%
Cap rate
0.8%
Rent to Value Ratio

Active
$630,000
4
bds
|
4
ba
|
1,460
sqft
|
built
1955
2406 N 28th Ave, Hollywood, FL 33020
$-1,656
Cash flow
-13.7%
Cash-on-Cash Return
3.0%
Cap rate
0.6%
Rent to Value Ratio
Active
$378,000
2
bds
|
3
ba
|
1,424
sqft
|
built
2007
2979 NW 30th Pl, Oakland Park, FL 33311
$-707
Cash flow
-9.8%
Cash-on-Cash Return
3.9%
Cap rate
0.7%
Rent to Value Ratio
Active
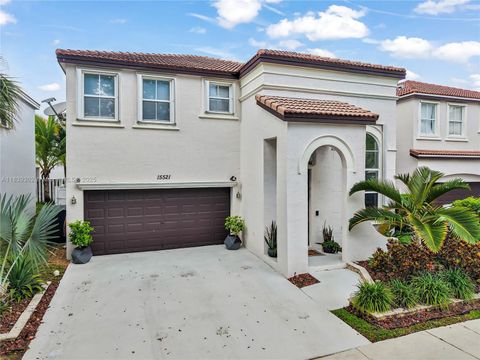
$679,000
4
bds
|
3
ba
|
2,054
sqft
|
built
2003
15521 SW 50th Ct, Miramar, FL 33027
$-1,661
Cash flow
-12.8%
Cash-on-Cash Return
3.2%
Cap rate
0.6%
Rent to Value Ratio
Active
$479,000
2
bds
|
2
ba
|
1,033
sqft
|
built
1986
180 SE 20th Ave, Deerfield Beach, FL 33441
$-1,579
Cash flow
-17.2%
Cash-on-Cash Return
2.2%
Cap rate
0.7%
Rent to Value Ratio
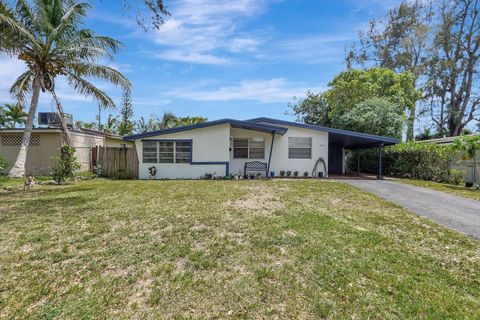
Active
$499,900
3
bds
|
2
ba
|
1,232
sqft
|
built
1960
7530 Atlanta St, Hollywood, FL 33024
$-962
Cash flow
-10.0%
Cash-on-Cash Return
3.8%
Cap rate
0.6%
Rent to Value Ratio

Active
$345,000
2
bds
|
2
ba
|
924
sqft
|
built
1974
701 Three Islands Blvd, Hallandale Beach, FL 33009
$-666
Cash flow
-10.1%
Cash-on-Cash Return
3.8%
Cap rate
0.8%
Rent to Value Ratio

Active
$450,000
2
bds
|
2
ba
|
1,100
sqft
|
built
1979
3140 S Ocean Dr, Hallandale Beach, FL 33009
$-1,553
Cash flow
-18.0%
Cash-on-Cash Return
2.0%
Cap rate
0.8%
Rent to Value Ratio

Active
$639,000
4
bds
|
3
ba
|
2,271
sqft
|
built
1973
8201 NW 67th Ave, Tamarac, FL 33321
$-1,999
Cash flow
-16.3%
Cash-on-Cash Return
2.4%
Cap rate
0.5%
Rent to Value Ratio
Active
$630,000
4
bds
|
3
ba
|
2,583
sqft
|
built
1992
4743 NW 3rd St, Deerfield Beach, FL 33442
$-332
Cash flow
-2.7%
Cash-on-Cash Return
5.5%
Cap rate
0.8%
Rent to Value Ratio
Active
$529,900
3
bds
|
2
ba
|
2,087
sqft
|
built
1980
1060 SW 55th Way, Margate, FL 33068
$-450
Cash flow
-4.4%
Cash-on-Cash Return
5.1%
Cap rate
0.7%
Rent to Value Ratio
Active
$499,000
1
bds
|
1
ba
|
640
sqft
|
built
1966
9 N Birch Rd, Fort Lauderdale, FL 33304
$-2,043
Cash flow
-21.4%
Cash-on-Cash Return
1.2%
Cap rate
0.5%
Rent to Value Ratio
Active
$850,000
2
bds
|
2
ba
|
1,650
sqft
|
built
1970
4280 Galt Ocean Dr, Fort Lauderdale, FL 33308
$-3,486
Cash flow
-21.4%
Cash-on-Cash Return
1.2%
Cap rate
0.6%
Rent to Value Ratio

Active
$989,900
3
bds
|
3
ba
|
1,887
sqft
|
built
1959
920 SE 4th Ave, Pompano Beach, FL 33060
$-811
Cash flow
-4.3%
Cash-on-Cash Return
5.2%
Cap rate
0.7%
Rent to Value Ratio
Active
$325,000
2
bds
|
3
ba
|
1,104
sqft
|
built
2018
3624 NW 30th Pl, Lauderdale Lakes, FL 33311
$-932
Cash flow
-15.0%
Cash-on-Cash Return
2.7%
Cap rate
0.7%
Rent to Value Ratio
Active
$650,000
4
bds
|
3
ba
|
1,985
sqft
|
built
1952
1517 NW 12th Ave, Fort Lauderdale, FL 33311
$-1,630
Cash flow
-13.1%
Cash-on-Cash Return
3.1%
Cap rate
0.6%
Rent to Value Ratio
Active
$750,000
3
bds
|
1
ba
|
1,202
sqft
|
built
1950
412 SW 16th Ct, Fort Lauderdale, FL 33315
$-2,053
Cash flow
-14.3%
Cash-on-Cash Return
2.9%
Cap rate
0.5%
Rent to Value Ratio
Active
$510,000
3
bds
|
3
ba
|
1,965
sqft
|
built
2015
264 SW 6th Ct, Pompano Beach, FL 33060
$-1,389
Cash flow
-14.2%
Cash-on-Cash Return
2.9%
Cap rate
0.6%
Rent to Value Ratio
Active
$610,000
4
bds
|
3
ba
|
1,900
sqft
|
built
1998
4231 NW 1st Dr, Deerfield Beach, FL 33442
$-1,007
Cash flow
-8.6%
Cash-on-Cash Return
4.2%
Cap rate
0.7%
Rent to Value Ratio

Active
$220,000
1
bds
|
2
ba
|
915
sqft
|
built
1976
800 Parkview Dr, Hallandale Beach, FL 33009
$-648
Cash flow
-15.4%
Cash-on-Cash Return
2.6%
Cap rate
1.0%
Rent to Value Ratio

Active
$780,000
2
bds
|
2
ba
|
2,100
sqft
|
built
1952
1107 Adams St, Hollywood, FL 33019
$-1,690
Cash flow
-11.3%
Cash-on-Cash Return
3.5%
Cap rate
0.7%
Rent to Value Ratio

Active
$788,800
3
bds
|
4
ba
|
2,477
sqft
|
built
2000
676 W Palm Aire Dr, Pompano Beach, FL 33069
$-2,485
Cash flow
-16.4%
Cash-on-Cash Return
2.4%
Cap rate
0.5%
Rent to Value Ratio

Active
$475,000
3
bds
|
2
ba
|
864
sqft
|
built
1957
4110 SW 32nd Ct, West Park, FL 33023
$-1,337
Cash flow
-14.7%
Cash-on-Cash Return
2.8%
Cap rate
0.5%
Rent to Value Ratio

Active
$229,000
2
bds
|
2
ba
|
820
sqft
|
built
1987
2226 N Cypress Bend Dr, Pompano Beach, FL 33069
$-529
Cash flow
-12.1%
Cash-on-Cash Return
3.4%
Cap rate
1.0%
Rent to Value Ratio

Active
$275,000
2
bds
|
2
ba
|
1,180
sqft
|
built
1970
1801 S Ocean Dr, Hallandale Beach, FL 33009
$-905
Cash flow
-17.2%
Cash-on-Cash Return
2.2%
Cap rate
1.0%
Rent to Value Ratio
Active
$499,000
2
bds
|
1
ba
|
1,300
sqft
|
built
1956
2171 SW 36th Ter, Fort Lauderdale, FL 33312
$-770
Cash flow
-8.1%
Cash-on-Cash Return
4.3%
Cap rate
0.7%
Rent to Value Ratio
Active
$215,777
2
bds
|
2
ba
|
963
sqft
|
built
1998
6900 SW 39th St, Davie, FL 33314
$-619
Cash flow
-15.0%
Cash-on-Cash Return
2.7%
Cap rate
0.9%
Rent to Value Ratio

Active
$294,000
1
bds
|
1
ba
|
815
sqft
|
built
2007
1830 Radius Dr, Hollywood, FL 33020
$-1,243
Cash flow
-22.1%
Cash-on-Cash Return
1.1%
Cap rate
0.9%
Rent to Value Ratio