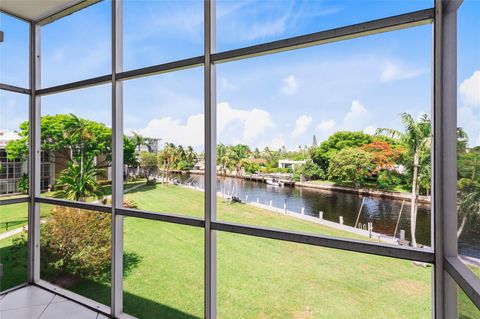
Broward County Investment Properties for Sale
Browse homes for sale and investment properties in Broward County. Refine your search by price, property type, or more.
Best cash flowing properties in Broward County
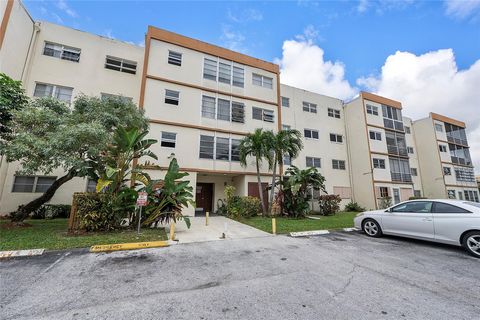
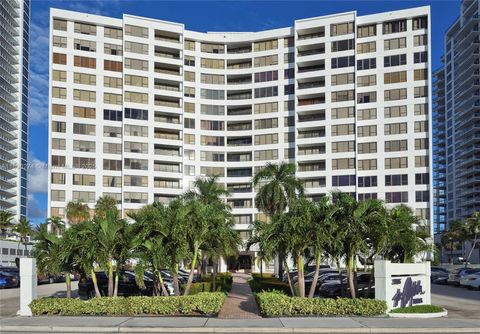
Active
$99,000
1
bds
|
1
ba
|
735
sqft
|
built
1973
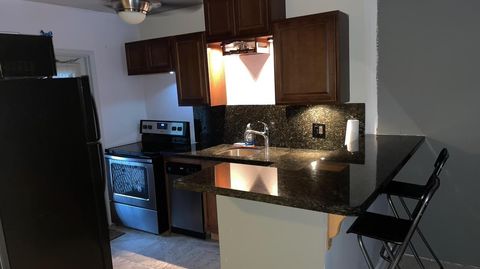
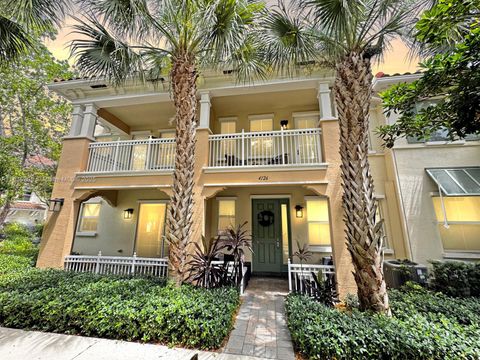
4042 NW 19th St, Lauderhill, FL 33313
$-110
Cash flow
-5.8%
Cash-on-Cash Return
4.8%
Cap rate
1.6%
Rent to Value Ratio
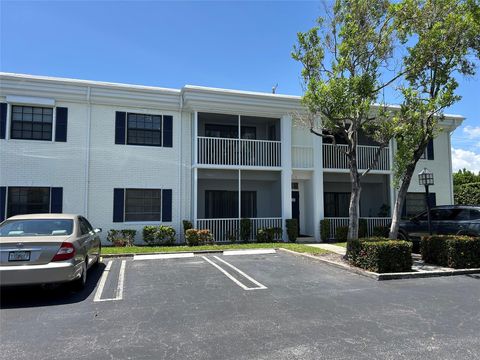
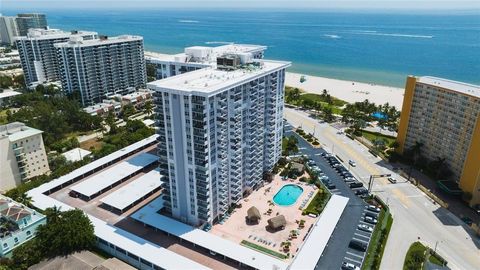
Active
$149,900
1
bds
|
2
ba
|
694
sqft
|
built
1972
180 Cypress Club Dr, Pompano Beach, FL 33060
$-234
Cash flow
-8.1%
Cash-on-Cash Return
4.3%
Cap rate
1.2%
Rent to Value Ratio
8,674 out of 10,116 properties for sale in Broward County
Limited Results Shown
Create a free account, or log in to reveal all property listings and enjoy the complete experience.
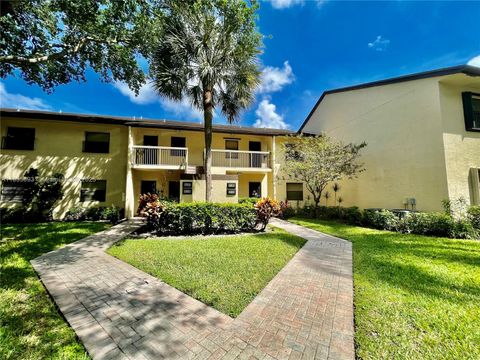
Active
$245,000
2
bds
|
2
ba
|
1,010
sqft
|
built
1983
3137 Carambola Cir S, Coconut Creek, FL 33066
$-422
Cash flow
-9.0%
Cash-on-Cash Return
4.1%
Cap rate
0.9%
Rent to Value Ratio
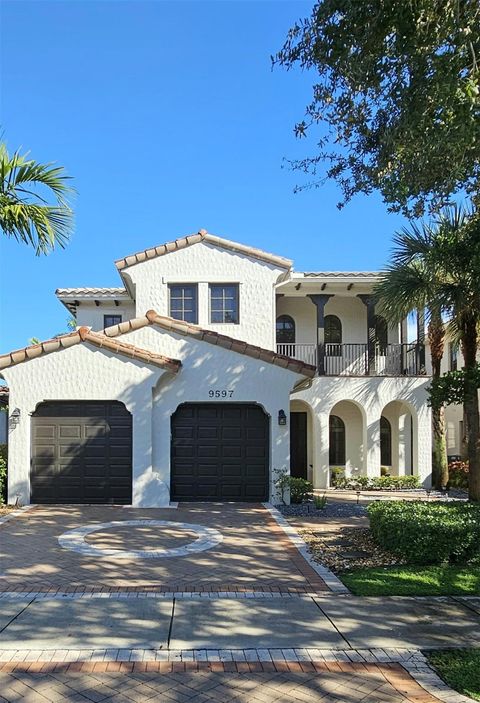
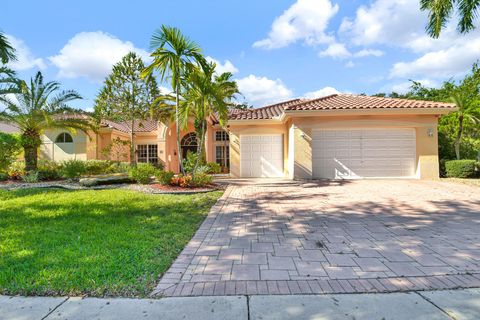
Active
$1,199,000
5
bds
|
3
ba
|
2,816
sqft
|
built
2006
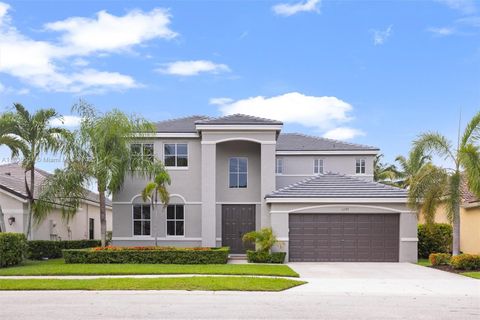
9597 Cinnamon Ct, Parkland, FL 33076
$-3,091
Cash flow
-13.5%
Cash-on-Cash Return
3.1%
Cap rate
0.7%
Rent to Value Ratio
Active
$230,000
2
bds
|
2
ba
|
920
sqft
|
built
1985
115 Lake Emerald Dr, Oakland Park, FL 33309
$-784
Cash flow
-17.8%
Cash-on-Cash Return
2.1%
Cap rate
1.0%
Rent to Value Ratio
Active
$210,000
2
bds
|
2
ba
|
984
sqft
|
built
1991
7640 Westwood Dr, Tamarac, FL 33321
$-743
Cash flow
-18.5%
Cash-on-Cash Return
1.9%
Cap rate
1.0%
Rent to Value Ratio
Active
$437,000
2
bds
|
2
ba
|
946
sqft
|
built
2018
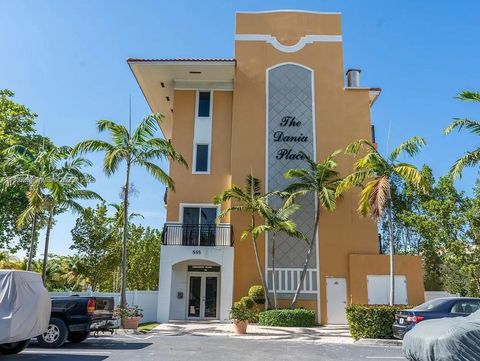
555 E Dania Beach Blvd, Dania Beach, FL 33004
$-1,151
Cash flow
-13.7%
Cash-on-Cash Return
3.0%
Cap rate
0.7%
Rent to Value Ratio
Active
$499,000
3
bds
|
2
ba
|
1,462
sqft
|
built
1959
6531 Harding St, Hollywood, FL 33024
$-585
Cash flow
-6.1%
Cash-on-Cash Return
4.7%
Cap rate
0.6%
Rent to Value Ratio
Active
$189,000
1
bds
|
2
ba
|
775
sqft
|
built
1967
4900 Washington St, Hollywood, FL 33021
$-247
Cash flow
-6.8%
Cash-on-Cash Return
4.6%
Cap rate
1.0%
Rent to Value Ratio
Active
$130,000
1
bds
|
1
ba
|
480
sqft
|
built
1969
241 SE 9th Ave, Pompano Beach, FL 33060
$-261
Cash flow
-10.5%
Cash-on-Cash Return
3.7%
Cap rate
1.1%
Rent to Value Ratio
Active
$919,900
4
bds
|
3
ba
|
3,246
sqft
|
built
1986
9099 NW 47th Ct, Coral Springs, FL 33067
$-1,897
Cash flow
-10.8%
Cash-on-Cash Return
3.7%
Cap rate
0.5%
Rent to Value Ratio
Active
$749,900
4
bds
|
2
ba
|
2,220
sqft
|
built
1990
9955 NW 52nd St, Coral Springs, FL 33076
$-1,358
Cash flow
-9.4%
Cash-on-Cash Return
4.0%
Cap rate
0.6%
Rent to Value Ratio
Active
$395,000
2
bds
|
3
ba
|
1,372
sqft
|
built
1989
701 NW 98th Cir, Plantation, FL 33324
$-1,094
Cash flow
-14.5%
Cash-on-Cash Return
2.8%
Cap rate
0.7%
Rent to Value Ratio
Active
$520,000
3
bds
|
2
ba
|
1,373
sqft
|
built
1962
7642 Venetian St, Miramar, FL 33023
$-626
Cash flow
-6.3%
Cash-on-Cash Return
4.7%
Cap rate
0.6%
Rent to Value Ratio
Active
$519,900
4
bds
|
2
ba
|
1,877
sqft
|
built
1970
970 SW 67th Ave, North Lauderdale, FL 33068
$-413
Cash flow
-4.1%
Cash-on-Cash Return
5.2%
Cap rate
0.7%
Rent to Value Ratio
Active
$548,500
3
bds
|
3
ba
|
1,421
sqft
|
built
2020
1190 Eucalyptus Dr, Hollywood, FL 33021
$-1,368
Cash flow
-13.0%
Cash-on-Cash Return
3.2%
Cap rate
0.6%
Rent to Value Ratio
Active
$380,000
2
bds
|
2
ba
|
1,370
sqft
|
built
1968
3505 S Ocean Dr, Hollywood, FL 33019
$-290
Cash flow
-4.0%
Cash-on-Cash Return
5.2%
Cap rate
0.9%
Rent to Value Ratio
Active
$619,000
4
bds
|
3
ba
|
2,608
sqft
|
built
2023
3838 NW 5th Ct, Lauderhill, FL 33311
$-2,023
Cash flow
-17.1%
Cash-on-Cash Return
2.2%
Cap rate
0.6%
Rent to Value Ratio
Active
$365,000
1
bds
|
2
ba
|
890
sqft
|
built
1970
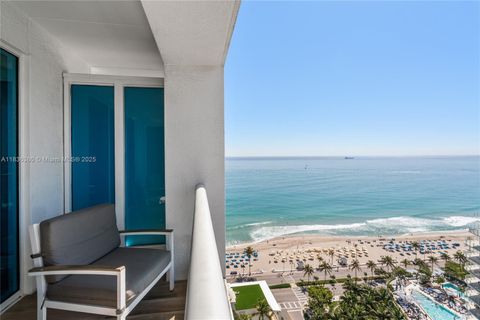
405 N Ocean Blvd, Pompano Beach, FL 33062
$-1,493
Cash flow
-21.3%
Cash-on-Cash Return
1.2%
Cap rate
0.7%
Rent to Value Ratio
Active
$550,000
3
bds
|
2
ba
|
1,687
sqft
|
built
1971
2239 NW 65th Ave, Margate, FL 33063
$-1,048
Cash flow
-9.9%
Cash-on-Cash Return
3.9%
Cap rate
0.6%
Rent to Value Ratio
Active
$1,195,000
2
bds
|
2
ba
|
1,460
sqft
|
built
1957
1205 Orange Isle, Fort Lauderdale, FL 33315
$-2,775
Cash flow
-12.1%
Cash-on-Cash Return
3.4%
Cap rate
0.5%
Rent to Value Ratio
Active
$1,399,000
4
bds
|
3
ba
|
2,674
sqft
|
built
1980
11965 SW 15th Ct, Davie, FL 33325
$-1,531
Cash flow
-5.7%
Cash-on-Cash Return
4.8%
Cap rate
0.6%
Rent to Value Ratio
Active
$274,000
2
bds
|
1
ba
|
725
sqft
|
built
1972
1460 NE 18th St, Fort Lauderdale, FL 33305
$-921
Cash flow
-17.5%
Cash-on-Cash Return
2.1%
Cap rate
0.7%
Rent to Value Ratio
Active
$899,000
2
bds
|
2
ba
|
1,955
sqft
|
built
1975
1912 S Ocean Dr, Hallandale Beach, FL 33009
$-3,578
Cash flow
-20.8%
Cash-on-Cash Return
1.4%
Cap rate
0.6%
Rent to Value Ratio
Active
$215,000
1
bds
|
1
ba
|
600
sqft
|
built
1965
2970 NE 16th Ave, Oakland Park, FL 33334
$-706
Cash flow
-17.1%
Cash-on-Cash Return
2.2%
Cap rate
0.8%
Rent to Value Ratio
Active
$674,999
3
bds
|
3
ba
|
2,392
sqft
|
built
1970
5712 White Hickory Cir, Tamarac, FL 33319
$-2,029
Cash flow
-15.7%
Cash-on-Cash Return
2.5%
Cap rate
0.5%
Rent to Value Ratio
Active
$799,900
4
bds
|
2
ba
|
2,091
sqft
|
built
1995
16226 Opal Creek Dr, Weston, FL 33331
$-633
Cash flow
-4.1%
Cash-on-Cash Return
5.2%
Cap rate
0.8%
Rent to Value Ratio
Active
$1,500,000
4
bds
|
3
ba
|
1,987
sqft
|
built
1970
1801 NE 23rd Ave, Fort Lauderdale, FL 33305
$-4,666
Cash flow
-16.2%
Cash-on-Cash Return
2.4%
Cap rate
0.5%
Rent to Value Ratio
Active
$550,000
3
bds
|
3
ba
|
1,334
sqft
|
built
2011
4126 Cascada Cir, Hollywood, FL 33024
$-1,277
Cash flow
-12.1%
Cash-on-Cash Return
3.4%
Cap rate
0.6%
Rent to Value Ratio
Active
$612,900
1
bds
|
1
ba
|
567
sqft
|
built
2009
551 N Fort Lauderdale Beach Blvd, Fort Lauderdale, FL 33304
$-3,244
Cash flow
-27.6%
Cash-on-Cash Return
-0.2%
Cap rate
0.5%
Rent to Value Ratio
Active
$1,150,000
5
bds
|
4
ba
|
2,798
sqft
|
built
1999
1249 Chenille Cir, Weston, FL 33327
$-3,191
Cash flow
-14.5%
Cash-on-Cash Return
2.8%
Cap rate
0.5%
Rent to Value Ratio
Active
$629,900
4
bds
|
2
ba
|
1,965
sqft
|
built
2001
2472 SW 106th Ave, Miramar, FL 33025
$-1,096
Cash flow
-9.1%
Cash-on-Cash Return
4.1%
Cap rate
0.6%
Rent to Value Ratio
Active
$995,000
2
bds
|
2
ba
|
1,468
sqft
|
built
2009
2821 N Ocean Blvd, Fort Lauderdale, FL 33308
$-3,025
Cash flow
-15.9%
Cash-on-Cash Return
2.5%
Cap rate
0.6%
Rent to Value Ratio
Active
$540,000
3
bds
|
3
ba
|
1,572
sqft
|
built
1993
10948 NW 12th Ct, Plantation, FL 33322
$-1,546
Cash flow
-14.9%
Cash-on-Cash Return
2.7%
Cap rate
0.6%
Rent to Value Ratio
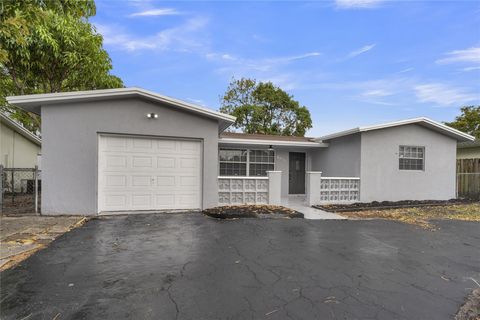
Active
$330,000
3
bds
|
1
ba
|
950
sqft
|
built
1958
1589 NW 6th Ave, Pompano Beach, FL 33060
$-664
Cash flow
-10.5%
Cash-on-Cash Return
3.7%
Cap rate
0.6%
Rent to Value Ratio
Active
$249,000
1
bds
|
1
ba
|
590
sqft
|
built
1968
2501 S Ocean Dr, Hollywood, FL 33019
$-1,126
Cash flow
-23.6%
Cash-on-Cash Return
0.7%
Cap rate
0.8%
Rent to Value Ratio
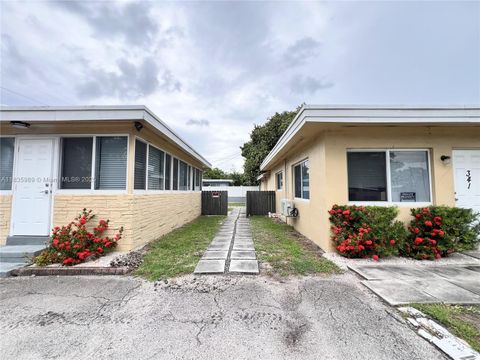
Active
$1,100,000
bds
|
0
ba
|
3,807
sqft
|
built
1951
341 S 24th Ave, Hollywood, FL 33020
$-4,804
Cash flow
-22.8%
Cash-on-Cash Return
0.9%
Cap rate
0.2%
Rent to Value Ratio
Active
$1,450,000
5
bds
|
5
ba
|
3,300
sqft
|
built
1992
2965 Wentworth, Weston, FL 33332
$-4,077
Cash flow
-14.7%
Cash-on-Cash Return
2.8%
Cap rate
0.5%
Rent to Value Ratio
Active
$499,900
3
bds
|
2
ba
|
1,685
sqft
|
built
1966
5970 NW 15th St, Sunrise, FL 33313
$-895
Cash flow
-9.3%
Cash-on-Cash Return
4.0%
Cap rate
0.6%
Rent to Value Ratio
Active
$274,900
3
bds
|
2
ba
|
1,120
sqft
|
built
1986
2748 Carambola Cir S, Coconut Creek, FL 33066
$-420
Cash flow
-8.0%
Cash-on-Cash Return
4.3%
Cap rate
0.9%
Rent to Value Ratio