Broward County Investment Properties for Sale
Browse homes for sale and investment properties in Broward County. Refine your search by price, property type, or more.
Best cash flowing properties in Broward County
Active
$245,000
2
bds
|
2
ba
|
1,130
sqft
|
built
1987
2524 NW 104th Ave, Sunrise, FL 33322
$237
Cash flow
5.0%
Cash-on-Cash Return
7.3%
Cap rate
0.9%
Rent to Value Ratio
Active
$775,000
4
bds
|
3
ba
|
1,944
sqft
|
built
1959
261 SE 8th St, Pompano Beach, FL 33060
$-86
Cash flow
-0.6%
Cash-on-Cash Return
6.0%
Cap rate
0.9%
Rent to Value Ratio
9,164 out of 10,677 properties for sale in Broward County
Limited Results Shown
Create a free account, or log in to reveal all property listings and enjoy the complete experience.

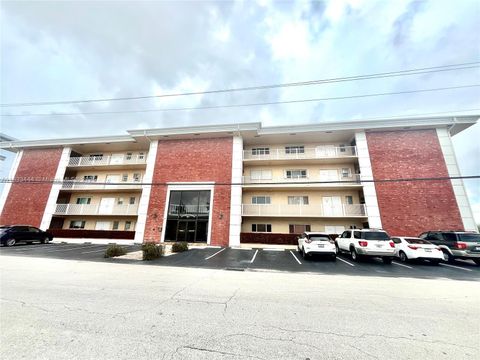
Active
$399,000
1
bds
|
2
ba
|
870
sqft
|
built
1971
1980 S Ocean Dr, Hallandale Beach, FL 33009
$-1,469
Cash flow
-19.2%
Cash-on-Cash Return
1.7%
Cap rate
0.7%
Rent to Value Ratio
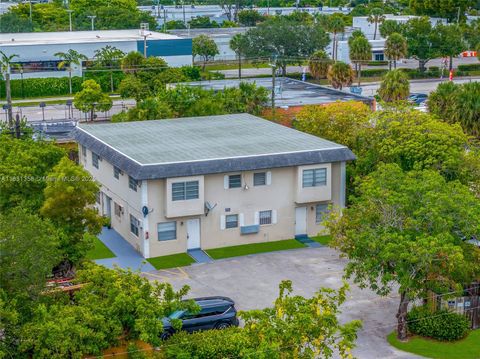
Active
$5,290,000
5
bds
|
4
ba
|
3,125
sqft
|
built
1959
1100 N Northlake Dr, Hollywood, FL 33019
$-24,737
Cash flow
-24.4%
Cash-on-Cash Return
0.5%
Cap rate
0.1%
Rent to Value Ratio

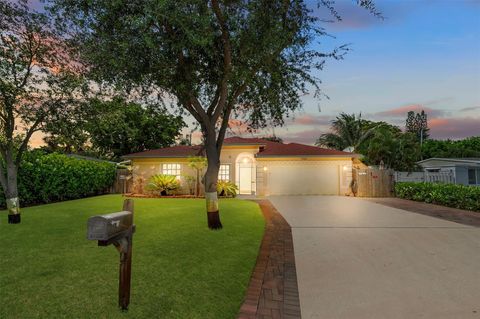
Active
$1,395,000
4
bds
|
3
ba
|
1,432
sqft
|
built
1937
1108 Harrison St, Hollywood, FL 33019
$-6,287
Cash flow
-23.5%
Cash-on-Cash Return
0.7%
Cap rate
0.2%
Rent to Value Ratio
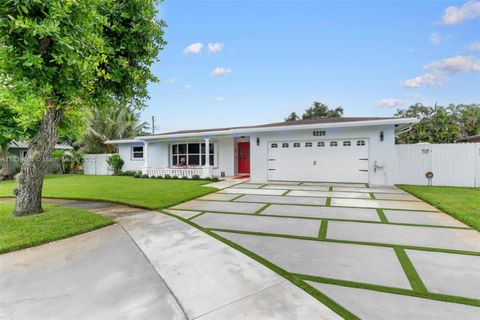
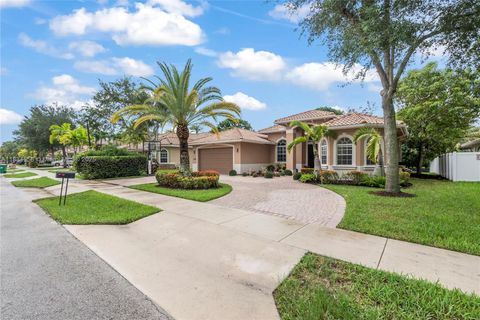
Active
$725,000
4
bds
|
2
ba
|
1,710
sqft
|
built
1970
5220 SW 6th St, Plantation, FL 33317
$-959
Cash flow
-6.9%
Cash-on-Cash Return
4.6%
Cap rate
0.6%
Rent to Value Ratio

Active
$709,990
4
bds
|
2
ba
|
2,529
sqft
|
built
1970
7241 NW 10th Ct, Plantation, FL 33313
$-1,403
Cash flow
-10.3%
Cash-on-Cash Return
3.8%
Cap rate
0.6%
Rent to Value Ratio
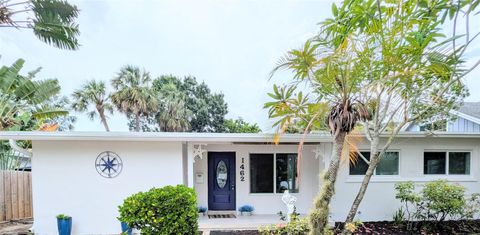
Active
$615,000
4
bds
|
3
ba
|
1,504
sqft
|
built
1957
1462 SW 16th Ter, Fort Lauderdale, FL 33312
$-954
Cash flow
-8.1%
Cash-on-Cash Return
4.3%
Cap rate
0.6%
Rent to Value Ratio
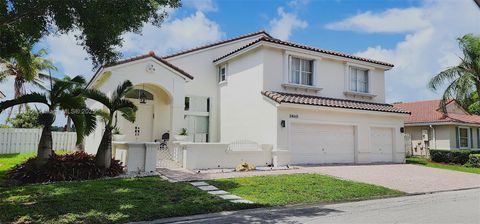
Active
$1,699,000
5
bds
|
4
ba
|
2,896
sqft
|
built
1996
3460 SW 52nd St, Fort Lauderdale, FL 33312
$-5,817
Cash flow
-17.9%
Cash-on-Cash Return
2.0%
Cap rate
0.3%
Rent to Value Ratio
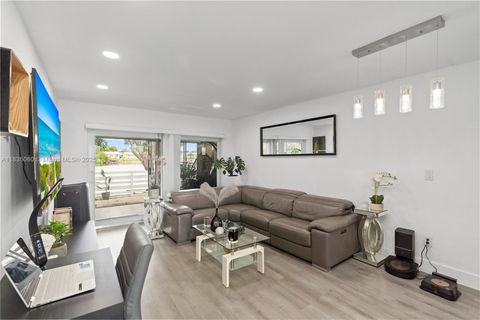
Active
$339,900
2
bds
|
1
ba
|
875
sqft
|
built
1966
2418 NW 52nd St, Tamarac, FL 33309
$-682
Cash flow
-10.5%
Cash-on-Cash Return
3.7%
Cap rate
0.7%
Rent to Value Ratio

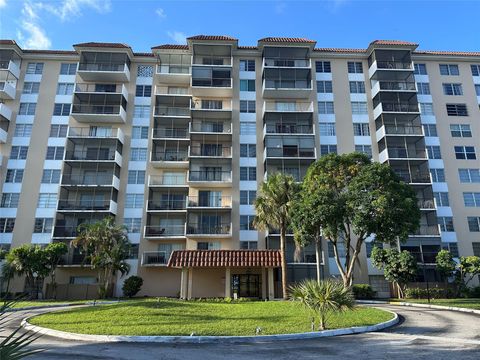
Active
$155,000
1
bds
|
1
ba
|
690
sqft
|
built
1968
2101 NE 68th St, Fort Lauderdale, FL 33308
$-394
Cash flow
-13.3%
Cash-on-Cash Return
3.1%
Cap rate
1.0%
Rent to Value Ratio
Active
$104,950
2
bds
|
2
ba
|
1,008
sqft
|
built
1974
4174 Inverrary Dr, Lauderhill, FL 33319
$-776
Cash flow
-38.6%
Cash-on-Cash Return
-2.7%
Cap rate
1.7%
Rent to Value Ratio
Active
$285,000
2
bds
|
2
ba
|
1,480
sqft
|
built
1984
7653 NW 79th Ave, Tamarac, FL 33321
$-919
Cash flow
-16.8%
Cash-on-Cash Return
2.3%
Cap rate
0.8%
Rent to Value Ratio

Active
$395,000
3
bds
|
3
ba
|
1,311
sqft
|
built
1984
7780 NW 79th Ave, Tamarac, FL 33321
$-1,263
Cash flow
-16.7%
Cash-on-Cash Return
2.3%
Cap rate
0.7%
Rent to Value Ratio
Active
$740,000
3
bds
|
2
ba
|
1,892
sqft
|
built
1990
5737 SW 89th Way, Cooper City, FL 33328
$-1,521
Cash flow
-10.7%
Cash-on-Cash Return
3.7%
Cap rate
0.5%
Rent to Value Ratio
Active
$265,000
1
bds
|
1
ba
|
530
sqft
|
built
1962
2501 N Ocean Blvd, Pompano Beach, FL 33062
$-773
Cash flow
-15.2%
Cash-on-Cash Return
2.6%
Cap rate
0.7%
Rent to Value Ratio

Active
$525,500
4
bds
|
2
ba
|
1,750
sqft
|
built
2022
167 SW 3rd St, Deerfield Beach, FL 33441
$-846
Cash flow
-8.4%
Cash-on-Cash Return
4.2%
Cap rate
0.7%
Rent to Value Ratio

Active
$399,000
2
bds
|
2
ba
|
1,221
sqft
|
built
1984
300 Three Islands Blvd, Hallandale Beach, FL 33009
$-1,724
Cash flow
-22.5%
Cash-on-Cash Return
1.0%
Cap rate
0.7%
Rent to Value Ratio

Active
$559,000
3
bds
|
2
ba
|
1,533
sqft
|
built
1981
4011 NW 115th Ave, Coral Springs, FL 33065
$-940
Cash flow
-8.8%
Cash-on-Cash Return
4.1%
Cap rate
0.7%
Rent to Value Ratio
Active
$160,000
2
bds
|
2
ba
|
1,150
sqft
|
built
1972
3690 Inverrary Dr, Lauderhill, FL 33319
$-402
Cash flow
-13.1%
Cash-on-Cash Return
3.1%
Cap rate
1.2%
Rent to Value Ratio

Active
$1,250,000
3
bds
|
3
ba
|
2,112
sqft
|
built
1974
3400 Galt Ocean Dr, Fort Lauderdale, FL 33308
$-5,305
Cash flow
-22.1%
Cash-on-Cash Return
1.1%
Cap rate
0.5%
Rent to Value Ratio

Active
$544,400
4
bds
|
2
ba
|
1,108
sqft
|
built
1958
3721 N 66th Ave, Hollywood, FL 33024
$-1,471
Cash flow
-14.1%
Cash-on-Cash Return
2.9%
Cap rate
0.5%
Rent to Value Ratio

Active
$185,000
2
bds
|
2
ba
|
1,120
sqft
|
built
1986
117 Lake Emerald Dr, Oakland Park, FL 33309
$-481
Cash flow
-13.6%
Cash-on-Cash Return
3.0%
Cap rate
1.2%
Rent to Value Ratio
Active
$175,000
2
bds
|
2
ba
|
1,050
sqft
|
built
1973
860 SE 6th Ave, Deerfield Beach, FL 33441
$-386
Cash flow
-11.5%
Cash-on-Cash Return
3.5%
Cap rate
1.1%
Rent to Value Ratio
Active
$338,000
3
bds
|
3
ba
|
1,360
sqft
|
built
1974
15 Laredo Pl, Davie, FL 33324
$-801
Cash flow
-12.4%
Cash-on-Cash Return
3.3%
Cap rate
0.7%
Rent to Value Ratio
Active
$469,000
3
bds
|
1
ba
|
1,473
sqft
|
built
1938
1719 Hayes St, Hollywood, FL 33020
$-396
Cash flow
-4.4%
Cash-on-Cash Return
5.1%
Cap rate
0.7%
Rent to Value Ratio

Active
$7,200,000
7
bds
|
8
ba
|
6,301
sqft
|
built
2003
7 Pelican Dr, Fort Lauderdale, FL 33301
$-38,301
Cash flow
-27.8%
Cash-on-Cash Return
-0.2%
Cap rate
0.1%
Rent to Value Ratio
Active
$520,000
4
bds
|
2
ba
|
1,523
sqft
|
built
1956
1520 SW 47th Ter, Fort Lauderdale, FL 33317
$-761
Cash flow
-7.6%
Cash-on-Cash Return
4.4%
Cap rate
0.6%
Rent to Value Ratio
Active
$239,900
2
bds
|
2
ba
|
1,000
sqft
|
built
1972
809 W Oakland Park Blvd, Wilton Manors, FL 33311
$-697
Cash flow
-15.2%
Cash-on-Cash Return
2.7%
Cap rate
1.0%
Rent to Value Ratio
Active
$199,999
1
bds
|
2
ba
|
1,308
sqft
|
built
1981
2200 S Cypress Bend Dr, Pompano Beach, FL 33069
$-743
Cash flow
-19.4%
Cash-on-Cash Return
1.7%
Cap rate
1.1%
Rent to Value Ratio

Active
$298,900
2
bds
|
2
ba
|
977
sqft
|
built
2005
2151 W Preserve Way, Miramar, FL 33025
$-716
Cash flow
-12.5%
Cash-on-Cash Return
3.3%
Cap rate
0.8%
Rent to Value Ratio
Active
$629,900
4
bds
|
2
ba
|
2,256
sqft
|
built
1975
7771 NW 46th St, Lauderhill, FL 33351
$-1,647
Cash flow
-13.6%
Cash-on-Cash Return
3.0%
Cap rate
0.6%
Rent to Value Ratio

Active
$2,100,000
3
bds
|
3
ba
|
2,213
sqft
|
built
1947
904 SE 11th Ct, Fort Lauderdale, FL 33316
$-8,838
Cash flow
-22.0%
Cash-on-Cash Return
1.1%
Cap rate
0.3%
Rent to Value Ratio
Active
$779,000
4
bds
|
3
ba
|
2,143
sqft
|
built
1999
2036 SW 159th Ave, Miramar, FL 33027
$-2,070
Cash flow
-13.9%
Cash-on-Cash Return
3.0%
Cap rate
0.6%
Rent to Value Ratio
Active
$325,000
2
bds
|
2
ba
|
960
sqft
|
built
1963
2841 NE 33rd Ct, Fort Lauderdale, FL 33306
$-818
Cash flow
-13.1%
Cash-on-Cash Return
3.1%
Cap rate
0.8%
Rent to Value Ratio
Active
$2,050,000
bds
|
0
ba
|
4,753
sqft
|
built
1973
842 NW 1st Ave, Fort Lauderdale, FL 33311
$-10,618
Cash flow
-27.0%
Cash-on-Cash Return
-0.1%
Cap rate
0.1%
Rent to Value Ratio
Active
$679,900
3
bds
|
2
ba
|
1,757
sqft
|
built
2005
1383 NE 27th St, Pompano Beach, FL 33064
$-1,529
Cash flow
-11.7%
Cash-on-Cash Return
3.4%
Cap rate
0.5%
Rent to Value Ratio
Active
$1,250,000
4
bds
|
3
ba
|
2,728
sqft
|
built
2009
8346 SW 51st St, Cooper City, FL 33328
$-3,769
Cash flow
-15.7%
Cash-on-Cash Return
2.5%
Cap rate
0.4%
Rent to Value Ratio

Active
$1,485,000
3
bds
|
2
ba
|
1,739
sqft
|
built
1956
330 SE 14th Ave, Pompano Beach, FL 33060
$-4,514
Cash flow
-15.9%
Cash-on-Cash Return
2.5%
Cap rate
0.3%
Rent to Value Ratio
Active
$690,000
4
bds
|
2
ba
|
1,878
sqft
|
built
2001
13758 SW 31st St, Miramar, FL 33027
$-2,022
Cash flow
-15.3%
Cash-on-Cash Return
2.6%
Cap rate
0.4%
Rent to Value Ratio