Broward County Investment Properties for Sale
Browse homes for sale and investment properties in Broward County. Refine your search by price, property type, or more.
Best cash flowing properties in Broward County
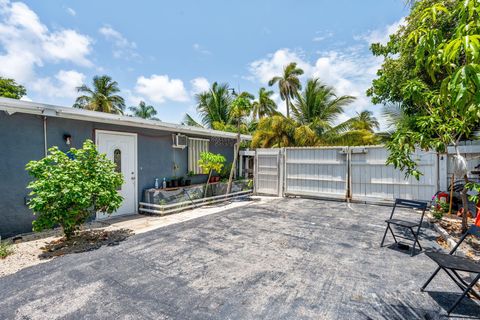
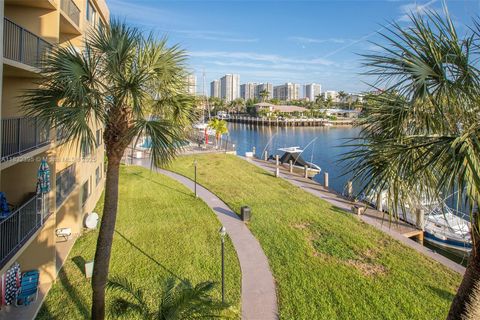
Active
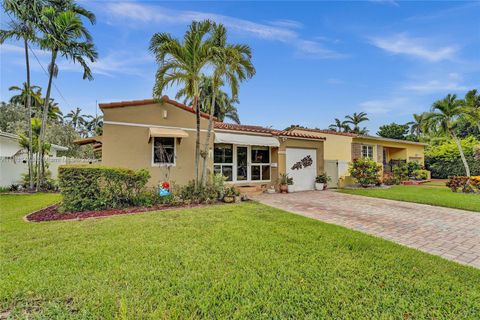
$375,000
3
bds
|
2
ba
|
1,271
sqft
|
built
1956
4740 NE 17th Ave, Pompano Beach, FL 33064
$49
Cash flow
0.7%
Cash-on-Cash Return
6.3%
Cap rate
0.8%
Rent to Value Ratio
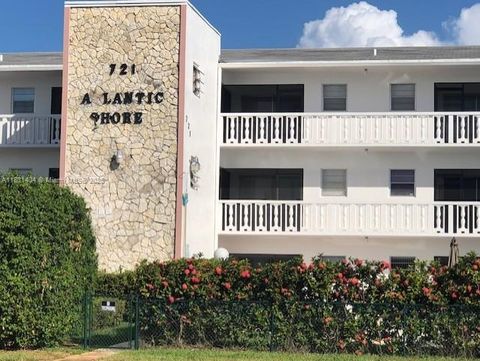
Active
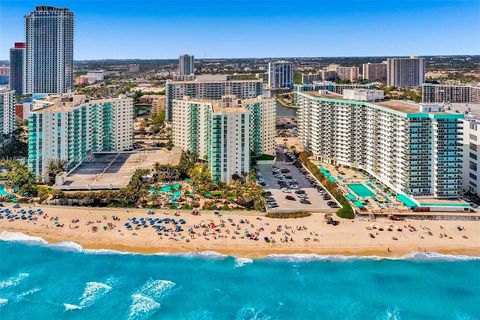
$145,000
1
bds
|
1
ba
|
564
sqft
|
built
1966
721 Atlantic Shores Blvd, Hallandale Beach, FL 33009
$-301
Cash flow
-10.8%
Cash-on-Cash Return
3.7%
Cap rate
1.1%
Rent to Value Ratio
8,673 out of 10,115 properties for sale in Broward County
Limited Results Shown
Create a free account, or log in to reveal all property listings and enjoy the complete experience.
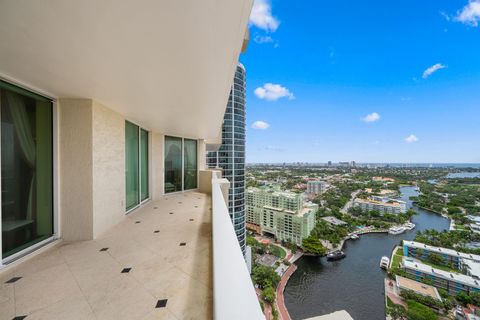
Active
$1,270,000
2
bds
|
2
ba
|
1,630
sqft
|
built
2005
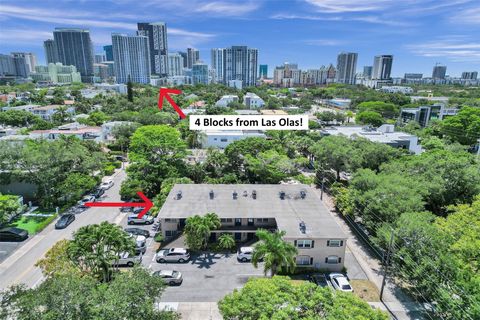
411 N New River Dr E, Fort Lauderdale, FL 33301
$-5,990
Cash flow
-24.6%
Cash-on-Cash Return
0.5%
Cap rate
0.5%
Rent to Value Ratio
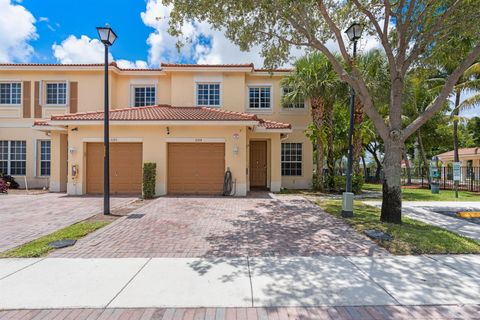
Active
$410,000
3
bds
|
3
ba
|
1,514
sqft
|
built
2013
3184 NW 32nd St, Oakland Park, FL 33309
$-951
Cash flow
-12.1%
Cash-on-Cash Return
3.4%
Cap rate
0.7%
Rent to Value Ratio
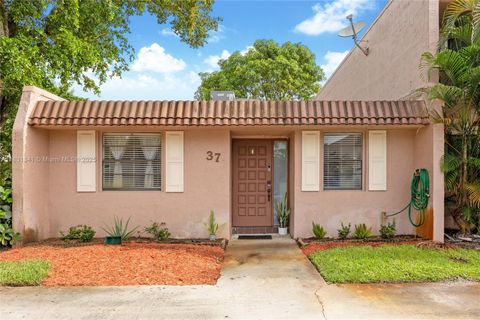
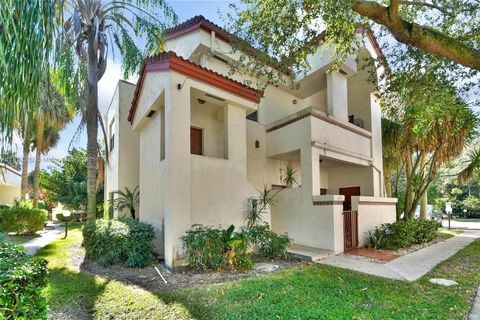
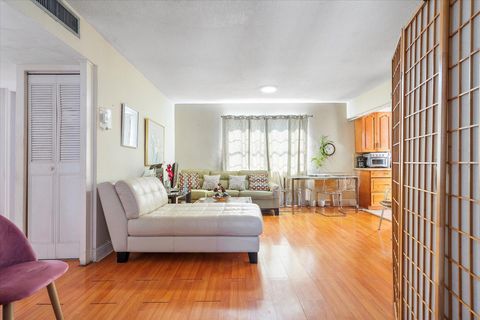
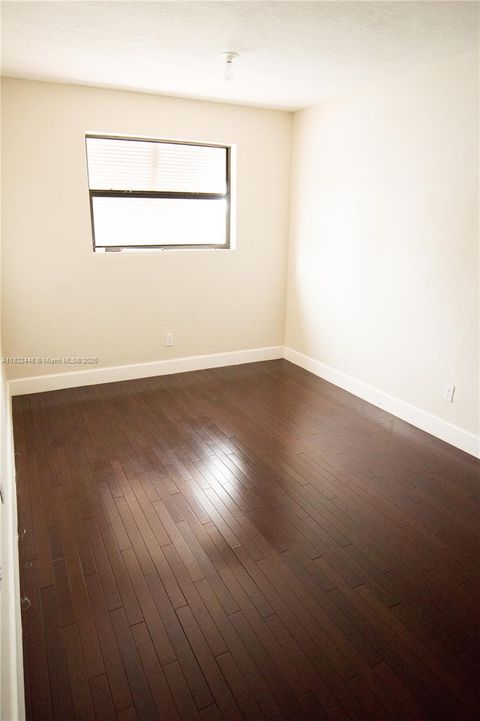
Active
$315,000
2
bds
|
2
ba
|
1,140
sqft
|
built
1979
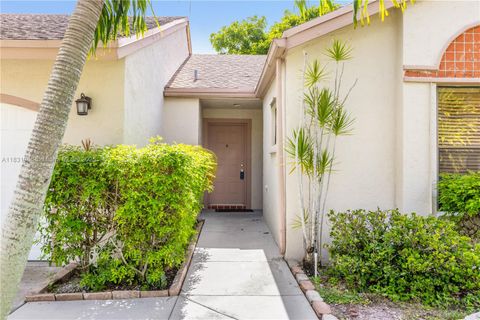
37 Seville Cir, Davie, FL 33324
$-882
Cash flow
-14.6%
Cash-on-Cash Return
2.8%
Cap rate
0.8%
Rent to Value Ratio
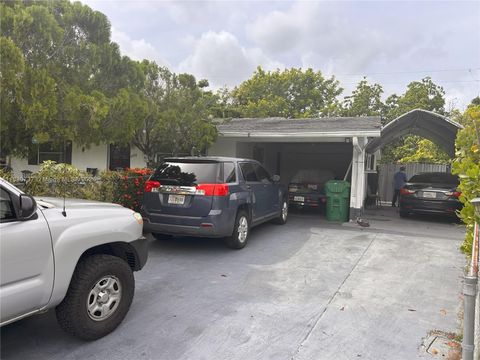
Active
$270,000
3
bds
|
2
ba
|
1,215
sqft
|
built
1985
1419 Avon Ln, North Lauderdale, FL 33068
$-541
Cash flow
-10.5%
Cash-on-Cash Return
3.7%
Cap rate
0.9%
Rent to Value Ratio
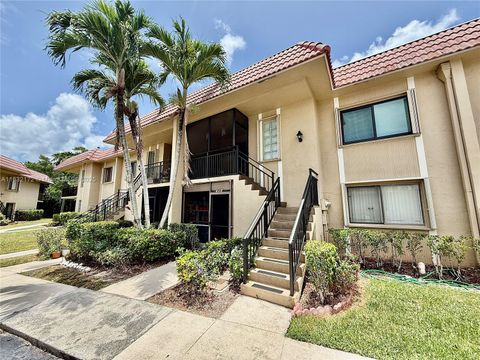
Active
$174,900
2
bds
|
2
ba
|
940
sqft
|
built
1973
714 NE 10th St, Hallandale Beach, FL 33009
$-857
Cash flow
-25.6%
Cash-on-Cash Return
0.3%
Cap rate
1.3%
Rent to Value Ratio
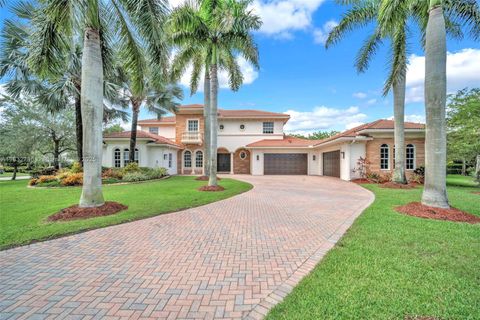
Active
$495,000
3
bds
|
3
ba
|
1,588
sqft
|
built
1985
1239 NW 122nd Ter, Pembroke Pines, FL 33026
$-1,136
Cash flow
-12.0%
Cash-on-Cash Return
3.4%
Cap rate
0.6%
Rent to Value Ratio
Active
$599,850
3
bds
|
2
ba
|
1,376
sqft
|
built
1988
3160 NW 108th Ter, Sunrise, FL 33351
$-1,646
Cash flow
-14.3%
Cash-on-Cash Return
2.9%
Cap rate
0.5%
Rent to Value Ratio
Active
$350,000
2
bds
|
1
ba
|
1,016
sqft
|
built
1967
4560 NW 25th Pl, Lauderhill, FL 33313
$-589
Cash flow
-8.8%
Cash-on-Cash Return
4.1%
Cap rate
0.7%
Rent to Value Ratio
Active
$320,000
2
bds
|
2
ba
|
1,231
sqft
|
built
1980
318 Lakeview Dr, Weston, FL 33326
$-655
Cash flow
-10.7%
Cash-on-Cash Return
3.7%
Cap rate
0.8%
Rent to Value Ratio
Active
$3,600,000
6
bds
|
8
ba
|
6,702
sqft
|
built
2006
3200 Lake Ridge Ln, Weston, FL 33332
$-14,906
Cash flow
-21.6%
Cash-on-Cash Return
1.2%
Cap rate
0.3%
Rent to Value Ratio
Active
$5,250,000
4
bds
|
5
ba
|
5,197
sqft
|
built
1991
56 Fiesta Way, Fort Lauderdale, FL 33301
$-23,004
Cash flow
-22.9%
Cash-on-Cash Return
0.9%
Cap rate
0.2%
Rent to Value Ratio
Active
$239,999
2
bds
|
2
ba
|
900
sqft
|
built
1984
3121 Riverside Dr, Coral Springs, FL 33065
$-723
Cash flow
-15.7%
Cash-on-Cash Return
2.5%
Cap rate
0.8%
Rent to Value Ratio
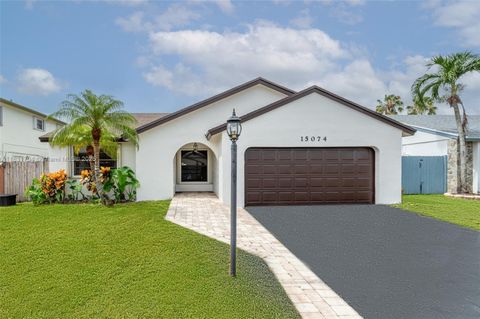
Active
$629,000
3
bds
|
2
ba
|
1,645
sqft
|
built
1988
15074 SW 13th Pl, Sunrise, FL 33326
$-1,703
Cash flow
-14.1%
Cash-on-Cash Return
2.9%
Cap rate
0.6%
Rent to Value Ratio
Active
$3,950,000
4
bds
|
5
ba
|
3,734
sqft
|
built
2018
1600 NE 6th St, Fort Lauderdale, FL 33304
$-13,432
Cash flow
-17.7%
Cash-on-Cash Return
2.1%
Cap rate
0.3%
Rent to Value Ratio
Active
$530,000
2
bds
|
2
ba
|
1,100
sqft
|
built
1980
2029 N Ocean Blvd, Fort Lauderdale, FL 33305
$-1,464
Cash flow
-14.4%
Cash-on-Cash Return
2.8%
Cap rate
0.6%
Rent to Value Ratio
Active
$555,000
4
bds
|
3
ba
|
1,954
sqft
|
built
2018
5013 Vulcan Way, Davie, FL 33314
$-1,227
Cash flow
-11.5%
Cash-on-Cash Return
3.5%
Cap rate
0.7%
Rent to Value Ratio
Active
$675,000
3
bds
|
2
ba
|
1,652
sqft
|
built
1999
18643 SW 15th St, Pembroke Pines, FL 33029
$-1,690
Cash flow
-13.1%
Cash-on-Cash Return
3.1%
Cap rate
0.6%
Rent to Value Ratio
Active
$689,000
2
bds
|
2
ba
|
1,200
sqft
|
built
1973
521 N Riverside Dr, Pompano Beach, FL 33062
$-1,376
Cash flow
-10.4%
Cash-on-Cash Return
3.7%
Cap rate
0.7%
Rent to Value Ratio
Active
$649,000
2
bds
|
2
ba
|
1,419
sqft
|
built
1944
1340 Jackson St, Hollywood, FL 33019
$-1,331
Cash flow
-10.7%
Cash-on-Cash Return
3.7%
Cap rate
0.5%
Rent to Value Ratio
Active
$645,000
2
bds
|
2
ba
|
1,236
sqft
|
built
1969
3801 S Ocean Dr, Hollywood, FL 33019
$-2,895
Cash flow
-23.4%
Cash-on-Cash Return
0.8%
Cap rate
0.6%
Rent to Value Ratio
Active
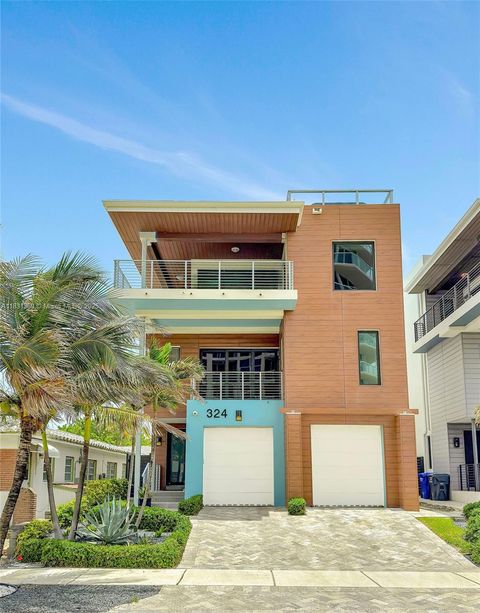
$2,850,000
4
bds
|
4
ba
|
2,736
sqft
|
built
2017
324 Balboa St, Hollywood, FL 33019
$-10,221
Cash flow
-18.7%
Cash-on-Cash Return
1.8%
Cap rate
0.4%
Rent to Value Ratio
Active
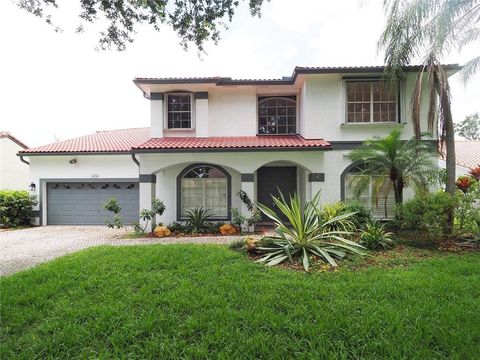
$899,000
5
bds
|
3
ba
|
3,008
sqft
|
built
1993
10749 Nashville Dr, Hollywood, FL 33026
$-1,031
Cash flow
-6.0%
Cash-on-Cash Return
4.8%
Cap rate
0.7%
Rent to Value Ratio
Active
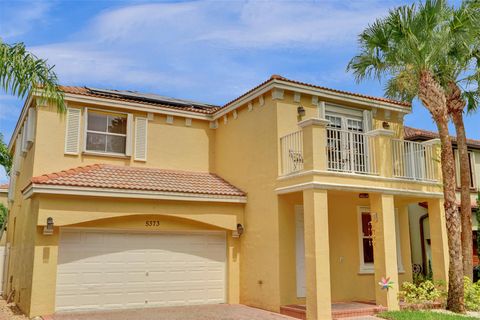
$675,000
4
bds
|
3
ba
|
2,180
sqft
|
built
2006
5373 SW 155th Way, Miramar, FL 33027
$-1,737
Cash flow
-13.4%
Cash-on-Cash Return
3.1%
Cap rate
0.6%
Rent to Value Ratio
Active
$180,000
1
bds
|
1
ba
|
800
sqft
|
built
1974
4017 N University Dr, Sunrise, FL 33351
$-651
Cash flow
-18.9%
Cash-on-Cash Return
1.8%
Cap rate
0.9%
Rent to Value Ratio
Active
$589,000
3
bds
|
2
ba
|
1,112
sqft
|
built
1959
2111 N 14th Ct, Hollywood, FL 33020
$-1,343
Cash flow
-11.9%
Cash-on-Cash Return
3.4%
Cap rate
0.6%
Rent to Value Ratio
Active
$610,000
4
bds
|
3
ba
|
1,761
sqft
|
built
1967
2900 NW 9th Ave, Wilton Manors, FL 33311
$-1,499
Cash flow
-12.8%
Cash-on-Cash Return
3.2%
Cap rate
0.6%
Rent to Value Ratio
Active
$1,350,000
2
bds
|
2
ba
|
2,116
sqft
|
built
1969
2100 S Ocean Ln, Fort Lauderdale, FL 33316
$-6,794
Cash flow
-26.3%
Cash-on-Cash Return
0.1%
Cap rate
0.5%
Rent to Value Ratio
Active
$250,000
1
bds
|
1
ba
|
800
sqft
|
built
1980
1231 SE 1st St, Fort Lauderdale, FL 33301
$-532
Cash flow
-11.1%
Cash-on-Cash Return
3.6%
Cap rate
0.9%
Rent to Value Ratio
Active
$499,900
2
bds
|
2
ba
|
1,160
sqft
|
built
1970
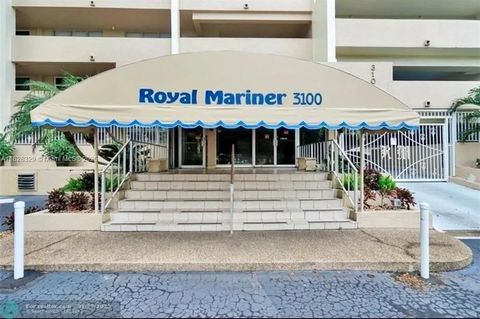
3100 NE 49th St, Fort Lauderdale, FL 33308
$-2,045
Cash flow
-21.3%
Cash-on-Cash Return
1.2%
Cap rate
0.6%
Rent to Value Ratio
Active
$750,000
3
bds
|
2
ba
|
2,056
sqft
|
built
2002
11700 NW 71st Pl, Parkland, FL 33076
$-1,900
Cash flow
-13.2%
Cash-on-Cash Return
3.1%
Cap rate
0.6%
Rent to Value Ratio
Active
$278,000
1
bds
|
1
ba
|
887
sqft
|
built
1967
301 Golden Isles Dr, Hallandale Beach, FL 33009
$-971
Cash flow
-18.2%
Cash-on-Cash Return
2.0%
Cap rate
0.7%
Rent to Value Ratio
Active
$299,000
3
bds
|
2
ba
|
1,200
sqft
|
built
1974
7175 Orange Dr, Davie, FL 33314
$-680
Cash flow
-11.9%
Cash-on-Cash Return
3.4%
Cap rate
0.9%
Rent to Value Ratio
Active
$945,000
5
bds
|
4
ba
|
1,670
sqft
|
built
1957
5838 Madison St, Hollywood, FL 33023
$-3,325
Cash flow
-18.4%
Cash-on-Cash Return
1.9%
Cap rate
0.4%
Rent to Value Ratio
Active
$899,000
5
bds
|
3
ba
|
1,852
sqft
|
built
1957
5620 Monroe St, Hollywood, FL 33023
$-2,392
Cash flow
-13.9%
Cash-on-Cash Return
3.0%
Cap rate
0.4%
Rent to Value Ratio
Active
$1,495,000
6
bds
|
4
ba
|
4,085
sqft
|
built
2004
5383 SW 186th Way, Miramar, FL 33029
$-4,948
Cash flow
-17.3%
Cash-on-Cash Return
2.2%
Cap rate
0.4%
Rent to Value Ratio
Active
$549,000
2
bds
|
1
ba
|
3,325
sqft
|
built
1949
801 SW 18th St, Fort Lauderdale, FL 33315
$-2,571
Cash flow
-24.4%
Cash-on-Cash Return
0.5%
Cap rate
0.4%
Rent to Value Ratio

Active
$1,880,000
5
bds
|
4
ba
|
3,228
sqft
|
built
2009
347 Oak St, Hollywood, FL 33019
$-5,241
Cash flow
-14.5%
Cash-on-Cash Return
2.8%
Cap rate
0.6%
Rent to Value Ratio
Active
$615,000
3
bds
|
2
ba
|
1,503
sqft
|
built
1970
829 NW 9th Ave, Dania Beach, FL 33004
$-1,449
Cash flow
-12.3%
Cash-on-Cash Return
3.3%
Cap rate
0.5%
Rent to Value Ratio