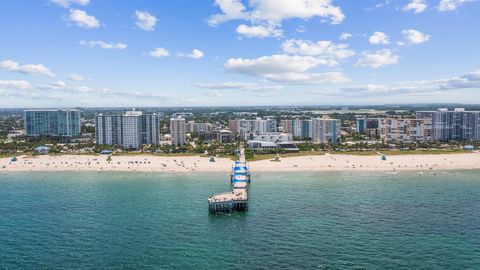
Broward County Investment Properties for Sale
Browse homes for sale and investment properties in Broward County. Refine your search by price, property type, or more.
Best cash flowing properties in Broward County
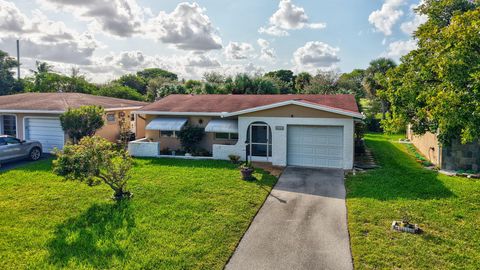
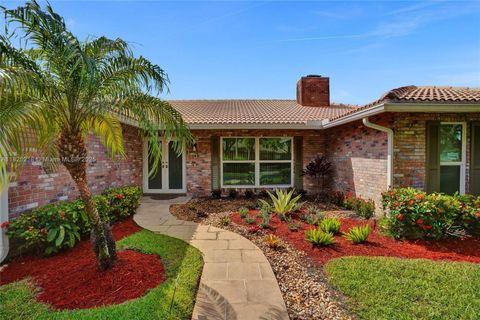
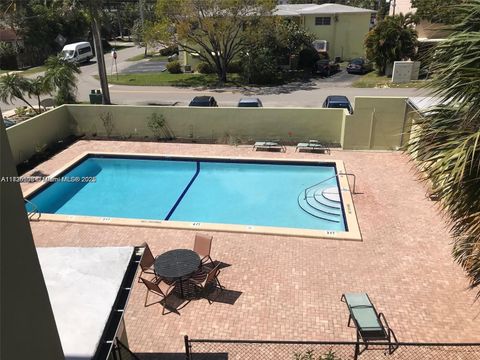
Active
$373,000
2
bds
|
2
ba
|
1,240
sqft
|
built
1974
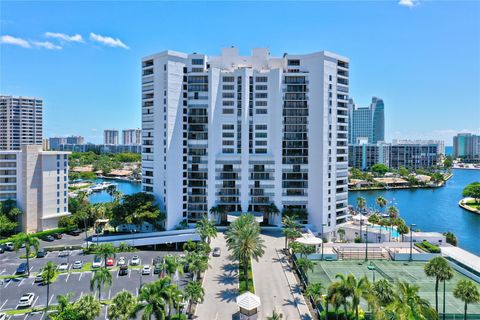
4741 NW 13th Ave, Deerfield Beach, FL 33064
$-197
Cash flow
-2.8%
Cash-on-Cash Return
5.5%
Cap rate
0.8%
Rent to Value Ratio
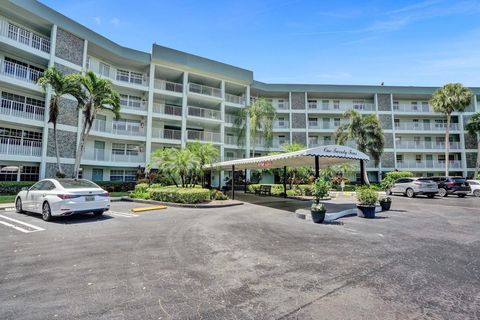
Active
$349,000
2
bds
|
2
ba
|
1,280
sqft
|
built
1980
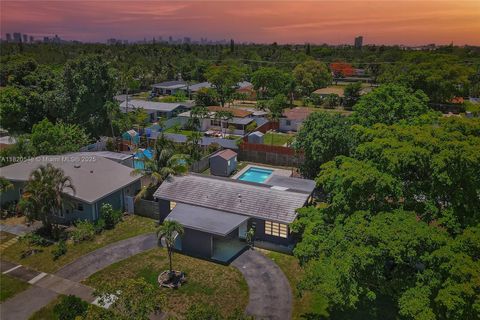
2500 Parkview Dr, Hallandale Beach, FL 33009
$-404
Cash flow
-6.0%
Cash-on-Cash Return
4.8%
Cap rate
0.8%
Rent to Value Ratio
7,582 out of 8,882 properties for sale in Broward County
Limited Results Shown
Create a free account, or log in to reveal all property listings and enjoy the complete experience.
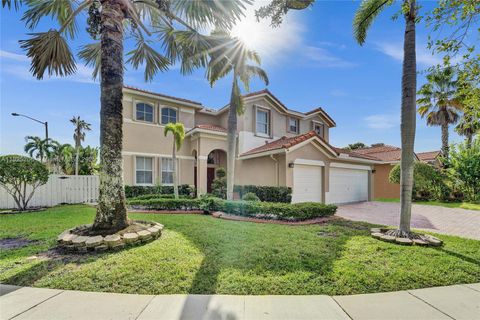
Active
$3,200,000
5
bds
|
3
ba
|
3,828
sqft
|
built
1979
413 Holiday Dr, Hallandale Beach, FL 33009
$-13,256
Cash flow
-21.6%
Cash-on-Cash Return
1.2%
Cap rate
0.3%
Rent to Value Ratio

Active
$690,000
3
bds
|
3
ba
|
1,623
sqft
|
built
1958
136 SE 2nd Ct, Dania Beach, FL 33004
$-1,899
Cash flow
-14.4%
Cash-on-Cash Return
2.8%
Cap rate
0.5%
Rent to Value Ratio
Active
$2,695,000
4
bds
|
5
ba
|
2,633
sqft
|
built
1956
2432 Bayview Dr, Fort Lauderdale, FL 33305
$-7,459
Cash flow
-14.4%
Cash-on-Cash Return
2.8%
Cap rate
0.4%
Rent to Value Ratio
Active
$749,000
2
bds
|
2
ba
|
1,355
sqft
|
built
1969
3901 S Ocean Dr, Hollywood, FL 33019
$-2,531
Cash flow
-17.6%
Cash-on-Cash Return
2.1%
Cap rate
0.7%
Rent to Value Ratio
Active
$495,000
2
bds
|
2
ba
|
1,716
sqft
|
built
1971
6311 NW 71st Ave, Tamarac, FL 33321
$-1,090
Cash flow
-11.5%
Cash-on-Cash Return
3.5%
Cap rate
0.6%
Rent to Value Ratio

Active
$3,595,000
5
bds
|
6
ba
|
4,478
sqft
|
built
1998
996 Sanibel Dr, Hollywood, FL 33019
$-16,451
Cash flow
-23.9%
Cash-on-Cash Return
0.7%
Cap rate
0.3%
Rent to Value Ratio
Active
$930,000
4
bds
|
4
ba
|
2,306
sqft
|
built
1962
2231 N 49th Ave, Hollywood, FL 33021
$-809
Cash flow
-4.5%
Cash-on-Cash Return
5.1%
Cap rate
0.7%
Rent to Value Ratio

Active
$925,000
4
bds
|
3
ba
|
2,500
sqft
|
built
1990
699 Spinnaker, Weston, FL 33326
$-2,746
Cash flow
-15.5%
Cash-on-Cash Return
2.6%
Cap rate
0.6%
Rent to Value Ratio
Active
$600,000
3
bds
|
2
ba
|
1,619
sqft
|
built
1969
8220 NW 24th Ct, Pembroke Pines, FL 33024
$-877
Cash flow
-7.6%
Cash-on-Cash Return
4.4%
Cap rate
0.6%
Rent to Value Ratio
Active
$769,000
4
bds
|
2
ba
|
2,312
sqft
|
built
1982
10967 NW 12th Dr, Coral Springs, FL 33071
$-1,388
Cash flow
-9.4%
Cash-on-Cash Return
4.0%
Cap rate
0.7%
Rent to Value Ratio
Active
$289,000
3
bds
|
2
ba
|
1,390
sqft
|
built
1980
806 Cypress Grove Ln, Pompano Beach, FL 33069
$-630
Cash flow
-11.4%
Cash-on-Cash Return
3.5%
Cap rate
1.1%
Rent to Value Ratio

Active
$2,050,000
3
bds
|
4
ba
|
3,003
sqft
|
built
2006
3535 S Ocean Dr, Hollywood, FL 33019
$-10,725
Cash flow
-27.3%
Cash-on-Cash Return
-0.1%
Cap rate
0.5%
Rent to Value Ratio
Active
$815,000
3
bds
|
2
ba
|
1,752
sqft
|
built
1957
1866 NE 33rd St, Oakland Park, FL 33306
$-1,975
Cash flow
-12.6%
Cash-on-Cash Return
3.2%
Cap rate
0.5%
Rent to Value Ratio
Active
$424,999
2
bds
|
2
ba
|
1,200
sqft
|
built
1974
6447 Bay Club Dr, Fort Lauderdale, FL 33308
$-1,332
Cash flow
-16.4%
Cash-on-Cash Return
2.4%
Cap rate
0.6%
Rent to Value Ratio
Active
$875,000
3
bds
|
2
ba
|
1,855
sqft
|
built
1965
550 NE 5th St, Pompano Beach, FL 33060
$-1,808
Cash flow
-10.8%
Cash-on-Cash Return
3.7%
Cap rate
0.5%
Rent to Value Ratio

Active
$749,700
3
bds
|
2
ba
|
1,825
sqft
|
built
1961
5260 NE 17th Ave, Fort Lauderdale, FL 33334
$-1,688
Cash flow
-11.7%
Cash-on-Cash Return
3.4%
Cap rate
0.5%
Rent to Value Ratio
Active
$1,095,000
3
bds
|
2
ba
|
2,300
sqft
|
built
1958
4020 NE 16th Ave, Oakland Park, FL 33334
$-729
Cash flow
-3.5%
Cash-on-Cash Return
5.3%
Cap rate
0.7%
Rent to Value Ratio
Active
$320,000
2
bds
|
2
ba
|
1,000
sqft
|
built
2009
2641 N Flamingo Rd, Sunrise, FL 33323
$-1,226
Cash flow
-20.0%
Cash-on-Cash Return
1.5%
Cap rate
0.8%
Rent to Value Ratio
Active
$3,500,000
3
bds
|
4
ba
|
2,014
sqft
|
built
1951
2756 NE 18th St, Fort Lauderdale, FL 33305
$-17,362
Cash flow
-25.9%
Cash-on-Cash Return
0.2%
Cap rate
0.2%
Rent to Value Ratio

Active
$599,000
4
bds
|
2
ba
|
1,954
sqft
|
built
1969
8301 NW 37th St, Coral Springs, FL 33065
$-695
Cash flow
-6.1%
Cash-on-Cash Return
4.8%
Cap rate
0.7%
Rent to Value Ratio
Active
$143,000
1
bds
|
2
ba
|
597
sqft
|
built
1967
1425 Arthur St, Hollywood, FL 33020
$-520
Cash flow
-19.0%
Cash-on-Cash Return
1.8%
Cap rate
1.2%
Rent to Value Ratio

Active
$464,900
2
bds
|
1
ba
|
1,136
sqft
|
built
1951
3913 SW 28th St, West Park, FL 33023
$-1,528
Cash flow
-17.1%
Cash-on-Cash Return
2.2%
Cap rate
0.5%
Rent to Value Ratio
Active
$500,000
1
bds
|
2
ba
|
950
sqft
|
built
1959
1501 SE 15th St, Fort Lauderdale, FL 33316
$-1,934
Cash flow
-20.2%
Cash-on-Cash Return
1.5%
Cap rate
0.6%
Rent to Value Ratio
Active
$475,000
3
bds
|
1
ba
|
1,245
sqft
|
built
1967
8230 NW 15th St, Pembroke Pines, FL 33024
$-512
Cash flow
-5.6%
Cash-on-Cash Return
4.9%
Cap rate
0.7%
Rent to Value Ratio

Active
$1,250,000
3
bds
|
2
ba
|
1,954
sqft
|
built
1959
417 N Highland Dr, Hollywood, FL 33021
$-3,598
Cash flow
-15.0%
Cash-on-Cash Return
2.7%
Cap rate
0.4%
Rent to Value Ratio
Active
$975,500
5
bds
|
4
ba
|
3,565
sqft
|
built
2000
1379 NW 166th Ave, Pembroke Pines, FL 33028
$-1,533
Cash flow
-8.2%
Cash-on-Cash Return
4.3%
Cap rate
0.7%
Rent to Value Ratio
Active
$829,900
3
bds
|
2
ba
|
2,026
sqft
|
built
1986
2000 Lakeshore Dr, Weston, FL 33326
$-1,934
Cash flow
-12.2%
Cash-on-Cash Return
3.4%
Cap rate
0.5%
Rent to Value Ratio
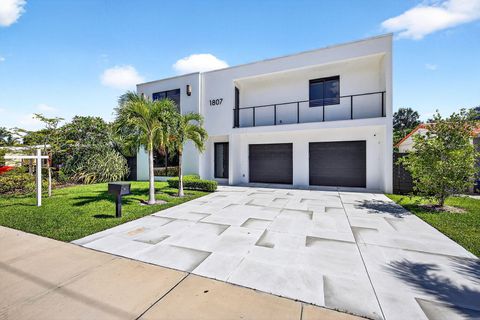
Active
$2,400,000
4
bds
|
5
ba
|
3,424
sqft
|
built
2022
1807 NE 18th St, Fort Lauderdale, FL 33305
$-8,273
Cash flow
-18.0%
Cash-on-Cash Return
2.0%
Cap rate
0.4%
Rent to Value Ratio

Active
$220,000
2
bds
|
2
ba
|
1,170
sqft
|
built
1974
3100 N Pine Island Rd, Sunrise, FL 33351
$-566
Cash flow
-13.4%
Cash-on-Cash Return
3.1%
Cap rate
0.9%
Rent to Value Ratio
Active
$475,000
3
bds
|
2
ba
|
1,480
sqft
|
built
1959
2849 SW 6th St, Fort Lauderdale, FL 33312
$-641
Cash flow
-7.0%
Cash-on-Cash Return
4.5%
Cap rate
0.6%
Rent to Value Ratio
Active
$1,300,000
4
bds
|
3
ba
|
2,094
sqft
|
built
1981
5021 SW 201st Ter, Southwest Ranches, FL 33332
$-3,881
Cash flow
-15.6%
Cash-on-Cash Return
2.6%
Cap rate
0.4%
Rent to Value Ratio

Active
$449,900
2
bds
|
2
ba
|
1,338
sqft
|
built
1980
525 N Ocean Blvd, Pompano Beach, FL 33062
$-1,911
Cash flow
-22.2%
Cash-on-Cash Return
1.1%
Cap rate
0.8%
Rent to Value Ratio
Active
$599,000
3
bds
|
3
ba
|
1,770
sqft
|
built
1984
300 Three Islands Blvd, Hallandale Beach, FL 33009
$-1,826
Cash flow
-15.9%
Cash-on-Cash Return
2.5%
Cap rate
0.8%
Rent to Value Ratio
Active
$728,000
3
bds
|
2
ba
|
1,458
sqft
|
built
1959
3338 Cleveland St, Hollywood, FL 33021
$-1,183
Cash flow
-8.5%
Cash-on-Cash Return
4.2%
Cap rate
0.7%
Rent to Value Ratio
Active
$337,000
3
bds
|
3
ba
|
1,245
sqft
|
built
1984
7720 NW 79th Ave, Tamarac, FL 33321
$-830
Cash flow
-12.8%
Cash-on-Cash Return
3.2%
Cap rate
0.7%
Rent to Value Ratio
Active
$1,325,000
4
bds
|
2
ba
|
2,026
sqft
|
built
1963
906 SE 10th St, Pompano Beach, FL 33060
$-3,889
Cash flow
-15.3%
Cash-on-Cash Return
2.6%
Cap rate
0.4%
Rent to Value Ratio

Active
$1,398,989
4
bds
|
3
ba
|
3,610
sqft
|
built
2006
9668 Ginger Ct, Parkland, FL 33076
$-4,040
Cash flow
-15.1%
Cash-on-Cash Return
2.7%
Cap rate
0.6%
Rent to Value Ratio
Active
$519,000
4
bds
|
3
ba
|
2,470
sqft
|
built
1977
103 Heatherbrook Way, Hollywood, FL 33021
$-2,036
Cash flow
-20.5%
Cash-on-Cash Return
1.4%
Cap rate
0.7%
Rent to Value Ratio