Broward County Investment Properties for Sale
Browse homes for sale and investment properties in Broward County. Refine your search by price, property type, or more.
Best cash flowing properties in Broward County
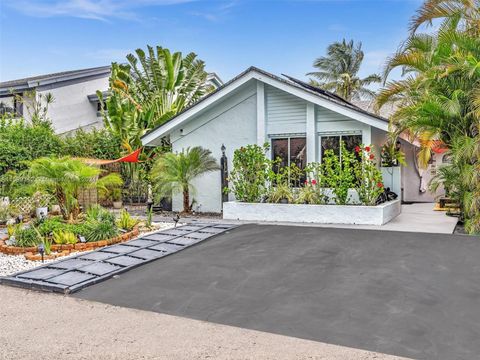
Active
$615,000
3
bds
|
2
ba
|
1,316
sqft
|
built
1982
3960 SW 84th Ter, Davie, FL 33328
$-153
Cash flow
-1.3%
Cash-on-Cash Return
5.8%
Cap rate
0.8%
Rent to Value Ratio
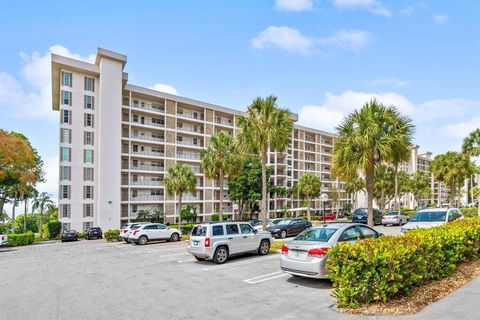
Active
$168,000
2
bds
|
2
ba
|
1,100
sqft
|
built
1969
3050 N Palm Aire Dr, Pompano Beach, FL 33069
$-280
Cash flow
-8.7%
Cash-on-Cash Return
4.2%
Cap rate
1.2%
Rent to Value Ratio
7,582 out of 8,882 properties for sale in Broward County
Limited Results Shown
Create a free account, or log in to reveal all property listings and enjoy the complete experience.

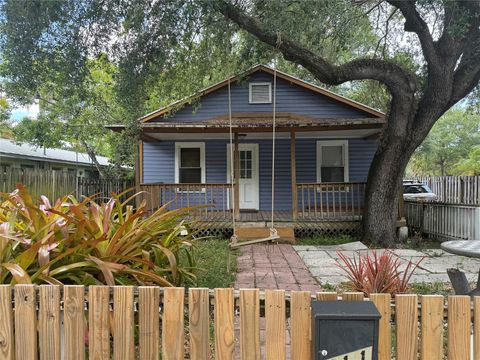
Active
$3,250,000
6
bds
|
6
ba
|
6,035
sqft
|
built
1964
14701 Sunset Ln, Southwest Ranches, FL 33330
$-11,954
Cash flow
-19.2%
Cash-on-Cash Return
1.7%
Cap rate
0.3%
Rent to Value Ratio

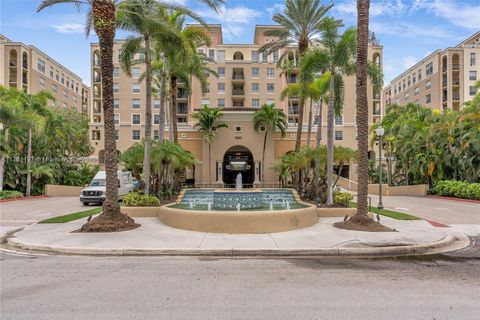
Active
$677,000
1
bds
|
2
ba
|
1,358
sqft
|
built
1975
1912 S Ocean Dr, Hallandale Beach, FL 33009
$-2,941
Cash flow
-22.7%
Cash-on-Cash Return
0.9%
Cap rate
0.5%
Rent to Value Ratio

Active
$1,600,000
bds
|
0
ba
|
1,996
sqft
|
built
1971
715 W Las Olas Blvd, Fort Lauderdale, FL 33312
$-6,662
Cash flow
-21.7%
Cash-on-Cash Return
1.2%
Cap rate
0.2%
Rent to Value Ratio
Active
$1,600,000
2
bds
|
1
ba
|
1,013
sqft
|
built
1924
711 W Las Olas Blvd, Fort Lauderdale, FL 33312
$-5,568
Cash flow
-18.2%
Cash-on-Cash Return
2.0%
Cap rate
0.3%
Rent to Value Ratio
Active
$279,999
1
bds
|
1
ba
|
816
sqft
|
built
2001
520 SE 5th Ave, Fort Lauderdale, FL 33301
$-930
Cash flow
-17.3%
Cash-on-Cash Return
2.2%
Cap rate
0.9%
Rent to Value Ratio
Active
$580,000
2
bds
|
2
ba
|
1,176
sqft
|
built
1969
3901 S Ocean Dr, Hollywood, FL 33019
$-2,338
Cash flow
-21.0%
Cash-on-Cash Return
1.3%
Cap rate
0.7%
Rent to Value Ratio

Active
$1,137,000
3
bds
|
4
ba
|
2,194
sqft
|
built
1969
2701 NE 52nd St, Lighthouse Point, FL 33064
$-1,682
Cash flow
-7.7%
Cash-on-Cash Return
4.4%
Cap rate
0.7%
Rent to Value Ratio
Active
$791,000
6
bds
|
4
ba
|
3,214
sqft
|
built
2004
4663 SW 132nd Ave, Miramar, FL 33027
$-1,645
Cash flow
-10.9%
Cash-on-Cash Return
3.7%
Cap rate
0.6%
Rent to Value Ratio

Active
$329,000
1
bds
|
2
ba
|
787
sqft
|
built
1966
1901 S Ocean Dr, Hollywood, FL 33019
$-1,542
Cash flow
-24.5%
Cash-on-Cash Return
0.5%
Cap rate
0.8%
Rent to Value Ratio

Active
$200,000
2
bds
|
2
ba
|
950
sqft
|
built
1974
4324 NW 9th Ave, Deerfield Beach, FL 33064
$-532
Cash flow
-13.9%
Cash-on-Cash Return
3.0%
Cap rate
0.9%
Rent to Value Ratio

Active
$665,000
2
bds
|
2
ba
|
1,610
sqft
|
built
2005
191 S Ocean Dr, Deerfield Beach, FL 33441
$-2,431
Cash flow
-19.1%
Cash-on-Cash Return
1.8%
Cap rate
0.7%
Rent to Value Ratio
Active
$650,000
2
bds
|
2
ba
|
1,080
sqft
|
built
2004
347 N New River Dr E, Fort Lauderdale, FL 33301
$-2,283
Cash flow
-18.3%
Cash-on-Cash Return
1.9%
Cap rate
0.7%
Rent to Value Ratio

Active
$370,000
2
bds
|
2
ba
|
1,275
sqft
|
built
1970
1965 S Ocean Dr, Hallandale Beach, FL 33009
$-1,261
Cash flow
-17.8%
Cash-on-Cash Return
2.1%
Cap rate
0.8%
Rent to Value Ratio
Active
$385,000
2
bds
|
3
ba
|
1,235
sqft
|
built
1980
16100 Golf Club Rd, Weston, FL 33326
$-1,205
Cash flow
-16.3%
Cash-on-Cash Return
2.4%
Cap rate
0.7%
Rent to Value Ratio
Active
$220,000
2
bds
|
2
ba
|
1,260
sqft
|
built
1973
404 NW 68th Ave, Plantation, FL 33317
$-504
Cash flow
-12.0%
Cash-on-Cash Return
3.4%
Cap rate
0.9%
Rent to Value Ratio
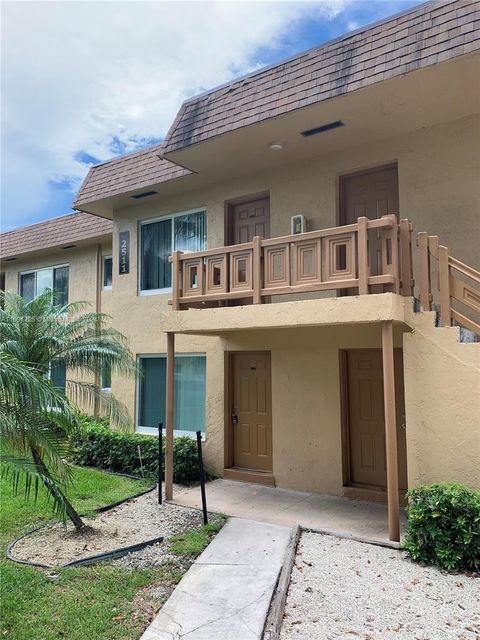
Active
$259,000
3
bds
|
2
ba
|
957
sqft
|
built
1972
2511 NW 39th Ter, Lauderdale Lakes, FL 33311
$-458
Cash flow
-9.2%
Cash-on-Cash Return
4.0%
Cap rate
0.8%
Rent to Value Ratio

Active
$925,000
bds
|
0
ba
|
2,665
sqft
|
built
1966
1425 NE 55th St, Fort Lauderdale, FL 33334
$-4,914
Cash flow
-27.7%
Cash-on-Cash Return
-0.2%
Cap rate
0.2%
Rent to Value Ratio

Active
$330,000
3
bds
|
2
ba
|
1,167
sqft
|
built
1974
1440 NW 20th St, Fort Lauderdale, FL 33311
$-394
Cash flow
-6.2%
Cash-on-Cash Return
4.7%
Cap rate
0.8%
Rent to Value Ratio

Active
$799,000
3
bds
|
2
ba
|
1,882
sqft
|
built
1967
1402 NW 8th St, Dania Beach, FL 33004
$-1,280
Cash flow
-8.4%
Cash-on-Cash Return
4.2%
Cap rate
0.6%
Rent to Value Ratio
Active
$549,000
2
bds
|
2
ba
|
1,200
sqft
|
built
1973
521 N Riverside Dr, Pompano Beach, FL 33062
$-1,714
Cash flow
-16.3%
Cash-on-Cash Return
2.4%
Cap rate
0.6%
Rent to Value Ratio

Active
$650,000
3
bds
|
2
ba
|
1,724
sqft
|
built
1967
7121 NW 11th Ct, Plantation, FL 33313
$-525
Cash flow
-4.2%
Cash-on-Cash Return
5.2%
Cap rate
0.7%
Rent to Value Ratio

Active
$2,590,000
3
bds
|
4
ba
|
2,492
sqft
|
built
1958
536 Hibiscus Dr, Hallandale Beach, FL 33009
$-11,407
Cash flow
-23.0%
Cash-on-Cash Return
0.9%
Cap rate
0.3%
Rent to Value Ratio

Active
$239,900
1
bds
|
2
ba
|
868
sqft
|
built
1972
427 Golden Isles Dr, Hallandale Beach, FL 33009
$-724
Cash flow
-15.7%
Cash-on-Cash Return
2.5%
Cap rate
1.0%
Rent to Value Ratio

Active
$420,000
2
bds
|
2
ba
|
1,200
sqft
|
built
1973
6249 Bay Club Dr, Fort Lauderdale, FL 33308
$-1,699
Cash flow
-21.1%
Cash-on-Cash Return
1.3%
Cap rate
0.5%
Rent to Value Ratio

Active
$1,599,000
3
bds
|
3
ba
|
1,658
sqft
|
built
1956
2308 Mariner Dr, Fort Lauderdale, FL 33316
$-4,415
Cash flow
-14.4%
Cash-on-Cash Return
2.8%
Cap rate
0.5%
Rent to Value Ratio
Active
$400,000
1
bds
|
1
ba
|
656
sqft
|
built
2017
777 N Ocean Dr, Hollywood, FL 33019
$-1,731
Cash flow
-22.6%
Cash-on-Cash Return
1.0%
Cap rate
0.7%
Rent to Value Ratio

Active
$8,999,999
6
bds
|
6
ba
|
6,044
sqft
|
built
1952
934 S Southlake Dr, Hollywood, FL 33019
$-43,685
Cash flow
-25.3%
Cash-on-Cash Return
0.3%
Cap rate
0.1%
Rent to Value Ratio
Active
$4,400,000
4
bds
|
4
ba
|
3,548
sqft
|
built
2013
3430 NE 23rd Ave, Lighthouse Point, FL 33064
$-17,843
Cash flow
-21.2%
Cash-on-Cash Return
1.3%
Cap rate
0.2%
Rent to Value Ratio
Active
$999,999
2
bds
|
3
ba
|
1,649
sqft
|
built
1975
3900 Galt Ocean Dr, Fort Lauderdale, FL 33308
$-1,541
Cash flow
-8.0%
Cash-on-Cash Return
4.3%
Cap rate
0.8%
Rent to Value Ratio
Active
$3,299,000
4
bds
|
4
ba
|
3,442
sqft
|
built
1950
924 S Rio Vista Blvd, Fort Lauderdale, FL 33316
$-11,972
Cash flow
-18.9%
Cash-on-Cash Return
1.8%
Cap rate
0.3%
Rent to Value Ratio

Active
$975,000
bds
|
0
ba
|
2,515
sqft
|
built
1962
2130 NE 56th St, Fort Lauderdale, FL 33308
$-3,293
Cash flow
-17.6%
Cash-on-Cash Return
2.1%
Cap rate
0.4%
Rent to Value Ratio
Active
$565,000
3
bds
|
2
ba
|
1,451
sqft
|
built
1956
2740 SW 46th Ct, Fort Lauderdale, FL 33312
$-629
Cash flow
-5.8%
Cash-on-Cash Return
4.8%
Cap rate
0.6%
Rent to Value Ratio
Active
$549,900
2
bds
|
3
ba
|
1,147
sqft
|
built
1984
330 SE 20th Ave, Deerfield Beach, FL 33441
$-2,607
Cash flow
-24.7%
Cash-on-Cash Return
0.5%
Cap rate
0.6%
Rent to Value Ratio
Active
$419,998
5
bds
|
2
ba
|
1,669
sqft
|
built
1956
2114 NW 5th St, Pompano Beach, FL 33069
$-572
Cash flow
-7.1%
Cash-on-Cash Return
4.5%
Cap rate
0.7%
Rent to Value Ratio
Active
$459,997
5
bds
|
2
ba
|
1,635
sqft
|
built
1997
725 NW 19th Ter, Fort Lauderdale, FL 33311
$-895
Cash flow
-10.2%
Cash-on-Cash Return
3.8%
Cap rate
0.6%
Rent to Value Ratio

Active
$449,996
5
bds
|
2
ba
|
1,994
sqft
|
built
1960
890 NW 35th Ave, Lauderhill, FL 33311
$-954
Cash flow
-11.1%
Cash-on-Cash Return
3.6%
Cap rate
0.7%
Rent to Value Ratio
Active
$7,500,000
4
bds
|
3
ba
|
2,514
sqft
|
built
1978
6800 SW 172nd Ave, Southwest Ranches, FL 33331
$-36,155
Cash flow
-25.2%
Cash-on-Cash Return
0.4%
Cap rate
0.1%
Rent to Value Ratio
Active
$328,000
3
bds
|
2
ba
|
1,120
sqft
|
built
1987
4624 Carambola Cir N, Coconut Creek, FL 33066
$-1,000
Cash flow
-15.9%
Cash-on-Cash Return
2.5%
Cap rate
0.8%
Rent to Value Ratio