Hillsborough County Investment Properties for Sale
Browse homes for sale and investment properties in Hillsborough County. Refine your search by price, property type, or more.
Best cash flowing properties in Hillsborough County

Active
$215,000
2
bds
|
1
ba
|
1,088
sqft
|
built
1951
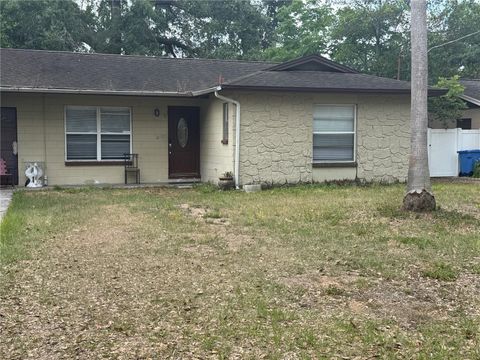
4207 E Henry Ave, Tampa, FL 33610
$60
Cash flow
1.5%
Cash-on-Cash Return
6.5%
Cap rate
0.8%
Rent to Value Ratio
Active
$159,900
2
bds
|
2
ba
|
896
sqft
|
built
1987
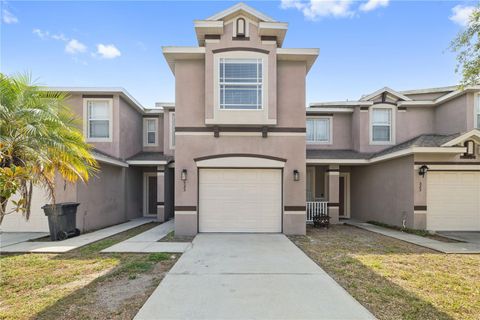
2302 Maki Rd, Plant City, FL 33563
$-66
Cash flow
-2.2%
Cash-on-Cash Return
5.7%
Cap rate
1.0%
Rent to Value Ratio
2,249 out of 2,601 properties for sale in Hillsborough County
Limited Results Shown
Create a free account, or log in to reveal all property listings and enjoy the complete experience.

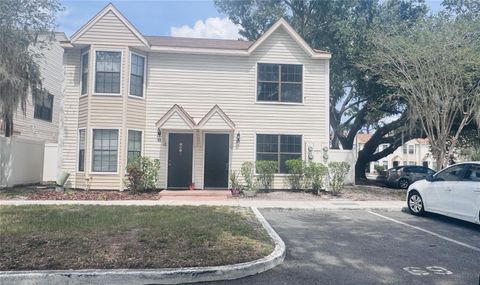
Active
$225,000
2
bds
|
3
ba
|
1,316
sqft
|
built
1987
7616 Colonial Ct, Tampa, FL 33615
$-343
Cash flow
-8.0%
Cash-on-Cash Return
4.3%
Cap rate
0.9%
Rent to Value Ratio
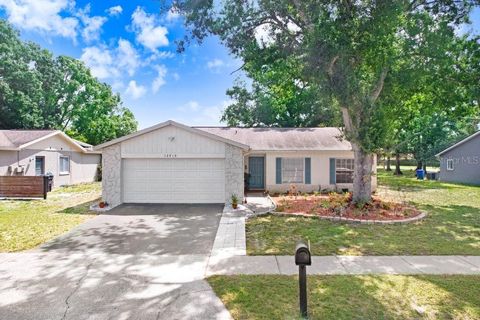
Active
$349,900
4
bds
|
2
ba
|
1,534
sqft
|
built
1985
12910 Leadwood Dr, Riverview, FL 33579
$-305
Cash flow
-4.5%
Cash-on-Cash Return
5.1%
Cap rate
0.7%
Rent to Value Ratio
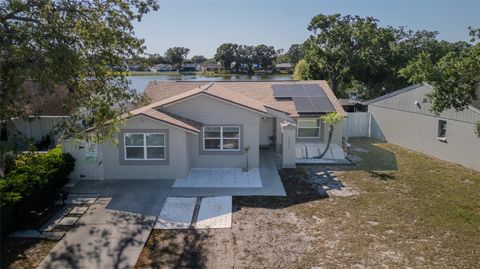
Active
$675,000
4
bds
|
2
ba
|
1,463
sqft
|
built
1982
12416 Queensland Ln, Tampa, FL 33625
$-1,809
Cash flow
-14.0%
Cash-on-Cash Return
2.9%
Cap rate
0.5%
Rent to Value Ratio
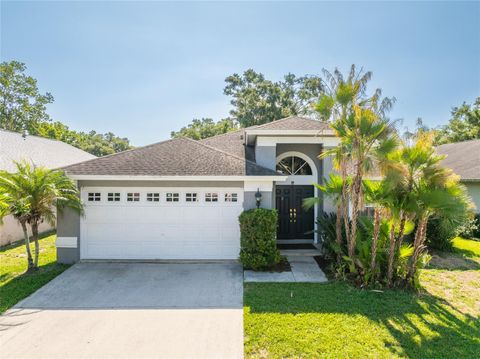
Active
$345,000
3
bds
|
2
ba
|
1,701
sqft
|
built
1992
2024 Glen Forge St, Brandon, FL 33511
$-364
Cash flow
-5.5%
Cash-on-Cash Return
4.9%
Cap rate
0.7%
Rent to Value Ratio
Active
$854,990
4
bds
|
2
ba
|
2,190
sqft
|
built
1988
907 Golf Island Dr, Apollo Beach, FL 33572
$-2,206
Cash flow
-13.5%
Cash-on-Cash Return
3.1%
Cap rate
0.5%
Rent to Value Ratio
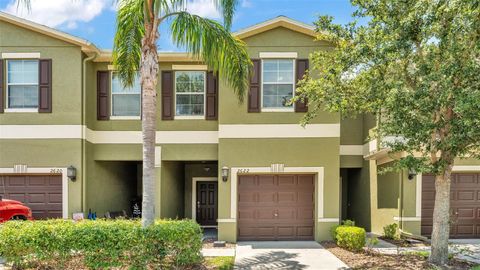
Active
$299,900
3
bds
|
3
ba
|
1,670
sqft
|
built
2013
2622 Lantern Hill Ave, Brandon, FL 33511
$-592
Cash flow
-10.3%
Cash-on-Cash Return
3.8%
Cap rate
0.7%
Rent to Value Ratio
Active
$768,990
4
bds
|
4
ba
|
2,833
sqft
|
built
2008
7309 S Shamrock Rd, Tampa, FL 33616
$-1,671
Cash flow
-11.3%
Cash-on-Cash Return
3.5%
Cap rate
0.5%
Rent to Value Ratio
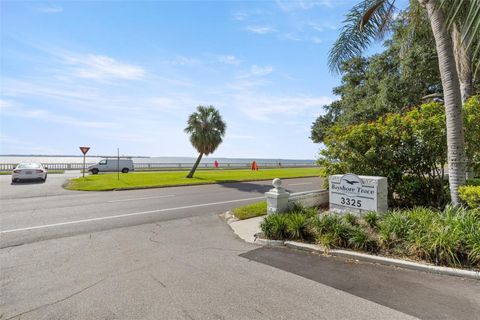
Active
$239,900
1
bds
|
2
ba
|
728
sqft
|
built
1978
3325 Bayshore Blvd, Tampa, FL 33629
$-220
Cash flow
-4.8%
Cash-on-Cash Return
5.0%
Cap rate
0.8%
Rent to Value Ratio
Active
$350,000
4
bds
|
2
ba
|
1,600
sqft
|
built
2005
11363 Cocoa Beach Dr, Riverview, FL 33569
$-872
Cash flow
-13.0%
Cash-on-Cash Return
3.2%
Cap rate
0.6%
Rent to Value Ratio
Active
$409,900
4
bds
|
2
ba
|
1,956
sqft
|
built
2001
1009 Summer Breeze Dr, Brandon, FL 33511
$-708
Cash flow
-9.0%
Cash-on-Cash Return
4.1%
Cap rate
0.6%
Rent to Value Ratio
Active
$829,000
4
bds
|
3
ba
|
2,968
sqft
|
built
2001
6468 Rubia Cir, Apollo Beach, FL 33572
$-1,367
Cash flow
-8.6%
Cash-on-Cash Return
4.2%
Cap rate
0.7%
Rent to Value Ratio
Active
$519,900
4
bds
|
2
ba
|
2,396
sqft
|
built
2015
1201 Lavender Jewel Ct, Plant City, FL 33563
$-801
Cash flow
-8.0%
Cash-on-Cash Return
4.3%
Cap rate
0.6%
Rent to Value Ratio
Active
$490,000
4
bds
|
4
ba
|
2,983
sqft
|
built
2004
10311 Frog Pond Dr, Riverview, FL 33569
$-978
Cash flow
-10.4%
Cash-on-Cash Return
3.8%
Cap rate
0.6%
Rent to Value Ratio
Active
$640,000
4
bds
|
4
ba
|
2,920
sqft
|
built
2016
10431 Alcon Blue Dr, Riverview, FL 33578
$-1,992
Cash flow
-16.2%
Cash-on-Cash Return
2.4%
Cap rate
0.5%
Rent to Value Ratio
Active
$419,000
4
bds
|
3
ba
|
2,377
sqft
|
built
2019
13311 Dorado Shores Ave, Riverview, FL 33579
$-817
Cash flow
-10.2%
Cash-on-Cash Return
3.8%
Cap rate
0.7%
Rent to Value Ratio
Active
$562,000
4
bds
|
2
ba
|
2,212
sqft
|
built
1996
613 Sportsman Park Dr, Seffner, FL 33584
$-1,149
Cash flow
-10.7%
Cash-on-Cash Return
3.7%
Cap rate
0.5%
Rent to Value Ratio
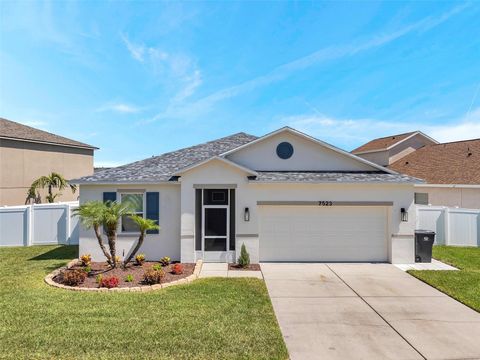
Active
$395,000
4
bds
|
2
ba
|
2,004
sqft
|
built
2013
7523 Tangle Brook Blvd, Gibsonton, FL 33534
$-786
Cash flow
-10.4%
Cash-on-Cash Return
3.8%
Cap rate
0.6%
Rent to Value Ratio
Active
$445,000
4
bds
|
3
ba
|
2,328
sqft
|
built
2012
16016 Persimmon Grove Dr, Lithia, FL 33547
$-789
Cash flow
-9.3%
Cash-on-Cash Return
4.0%
Cap rate
0.7%
Rent to Value Ratio
Active
$834,000
3
bds
|
2
ba
|
2,167
sqft
|
built
1978
6119 Galleon Way, Tampa, FL 33615
$-2,744
Cash flow
-17.2%
Cash-on-Cash Return
2.2%
Cap rate
0.4%
Rent to Value Ratio
Active
$450,000
4
bds
|
3
ba
|
2,115
sqft
|
built
2020
6118 Voyagers Pl, Apollo Beach, FL 33572
$-815
Cash flow
-9.4%
Cash-on-Cash Return
4.0%
Cap rate
0.7%
Rent to Value Ratio
Active
$465,000
4
bds
|
3
ba
|
2,052
sqft
|
built
1976
3419 Pearson Rd, Valrico, FL 33596
$-840
Cash flow
-9.4%
Cash-on-Cash Return
4.0%
Cap rate
0.6%
Rent to Value Ratio
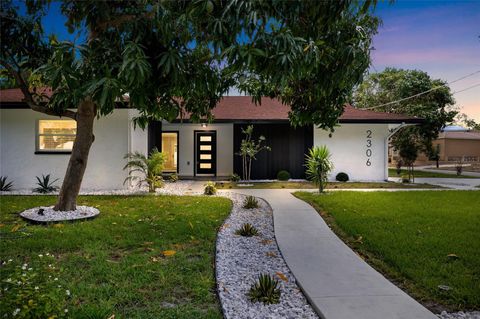
Active
$1,265,000
4
bds
|
3
ba
|
2,501
sqft
|
built
1974
2306 S San Jose Cir, Tampa, FL 33629
$-2,826
Cash flow
-11.7%
Cash-on-Cash Return
3.5%
Cap rate
0.6%
Rent to Value Ratio
Active
$300,000
3
bds
|
2
ba
|
1,463
sqft
|
built
1924
508 N Walker St, Plant City, FL 33563
$-193
Cash flow
-3.4%
Cash-on-Cash Return
5.4%
Cap rate
0.8%
Rent to Value Ratio
Active
$300,000
2
bds
|
2
ba
|
864
sqft
|
built
1948
1216 E Lambright St, Tampa, FL 33604
$-627
Cash flow
-10.9%
Cash-on-Cash Return
3.6%
Cap rate
0.6%
Rent to Value Ratio
Active
$439,900
4
bds
|
3
ba
|
2,310
sqft
|
built
2023
3504 Crooked River Dr, Plant City, FL 33565
$-303
Cash flow
-3.6%
Cash-on-Cash Return
5.3%
Cap rate
0.7%
Rent to Value Ratio
Active
$445,000
4
bds
|
2
ba
|
1,924
sqft
|
built
1986
107 Halton Cir, Seffner, FL 33584
$-614
Cash flow
-7.2%
Cash-on-Cash Return
4.5%
Cap rate
0.6%
Rent to Value Ratio
Active
$679,000
2
bds
|
3
ba
|
1,532
sqft
|
built
1988
3412 W San Juan St, Tampa, FL 33629
$-1,488
Cash flow
-11.4%
Cash-on-Cash Return
3.5%
Cap rate
0.5%
Rent to Value Ratio
Active
$1,175,000
4
bds
|
3
ba
|
3,627
sqft
|
built
2015
14715 Fishhawk Preserve Dr, Lithia, FL 33547
$-3,628
Cash flow
-16.1%
Cash-on-Cash Return
2.4%
Cap rate
0.5%
Rent to Value Ratio
Active
$490,000
4
bds
|
3
ba
|
2,724
sqft
|
built
2020
11522 Sunburst Marble Rd, Riverview, FL 33579
$-798
Cash flow
-8.5%
Cash-on-Cash Return
4.2%
Cap rate
0.7%
Rent to Value Ratio
Active
$515,000
2
bds
|
2
ba
|
1,200
sqft
|
built
1998
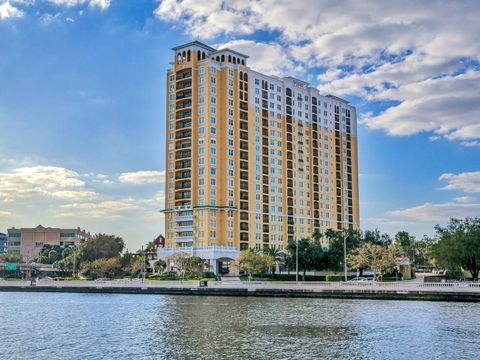
501 Knights Run Ave, Tampa, FL 33602
$-2,026
Cash flow
-20.5%
Cash-on-Cash Return
1.4%
Cap rate
0.6%
Rent to Value Ratio
Active
$349,000
2
bds
|
2
ba
|
976
sqft
|
built
1940
3615 W Cherry St, Tampa, FL 33607
$-551
Cash flow
-8.2%
Cash-on-Cash Return
4.3%
Cap rate
0.6%
Rent to Value Ratio
Active
$570,000
3
bds
|
2
ba
|
1,252
sqft
|
built
1975
814 Seabreeze Dr, Ruskin, FL 33570
$-1,389
Cash flow
-12.7%
Cash-on-Cash Return
3.2%
Cap rate
0.4%
Rent to Value Ratio
Active
$365,000
4
bds
|
2
ba
|
1,379
sqft
|
built
1974
201 Lentz Rd, Brandon, FL 33510
$-804
Cash flow
-11.5%
Cash-on-Cash Return
3.5%
Cap rate
0.5%
Rent to Value Ratio
Active
$205,000
2
bds
|
3
ba
|
1,366
sqft
|
built
2007
527 Glenn Cross Dr, Ruskin, FL 33570
$-596
Cash flow
-15.2%
Cash-on-Cash Return
2.7%
Cap rate
0.9%
Rent to Value Ratio

Active
$270,000
2
bds
|
2
ba
|
1,189
sqft
|
built
1972
10009 N 10th St, Tampa, FL 33612
$-577
Cash flow
-11.1%
Cash-on-Cash Return
3.6%
Cap rate
0.5%
Rent to Value Ratio
Active
$460,000
4
bds
|
3
ba
|
3,034
sqft
|
built
2016
11802 Twilight Darner Pl, Riverview, FL 33569
$-745
Cash flow
-8.4%
Cash-on-Cash Return
4.2%
Cap rate
0.7%
Rent to Value Ratio
Active
$1,100,000
3
bds
|
2
ba
|
1,420
sqft
|
built
1998
345 Bayshore Blvd, Tampa, FL 33606
$-2,777
Cash flow
-13.2%
Cash-on-Cash Return
3.1%
Cap rate
0.5%
Rent to Value Ratio
Active
$470,000
3
bds
|
2
ba
|
1,614
sqft
|
built
1991
11014 Peking Pl, Tampa, FL 33624
$-1,016
Cash flow
-11.3%
Cash-on-Cash Return
3.6%
Cap rate
0.6%
Rent to Value Ratio