Lee County Investment Properties for Sale
Browse homes for sale and investment properties in Lee County. Refine your search by price, property type, or more.
Best cash flowing properties in Lee County
Active
$649,500
4
bds
|
2
ba
|
1,932
sqft
|
built
1969
3117 SE 18th Ave, Cape Coral, FL 33904
$275
Cash flow
2.2%
Cash-on-Cash Return
6.7%
Cap rate
1.0%
Rent to Value Ratio
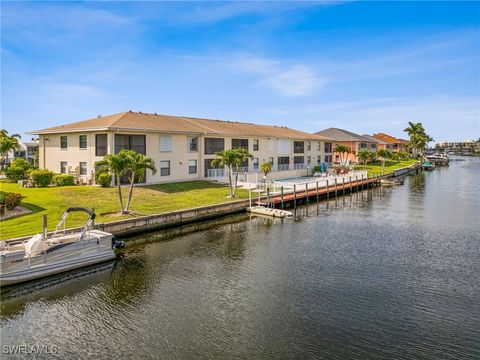
Active
$219,000
2
bds
|
2
ba
|
1,026
sqft
|
built
1982
4538 SE 5th Pl, Cape Coral, FL 33904
$117
Cash flow
2.8%
Cash-on-Cash Return
6.8%
Cap rate
0.9%
Rent to Value Ratio
7,371 out of 8,827 properties for sale in Lee County
Limited Results Shown
Create a free account, or log in to reveal all property listings and enjoy the complete experience.
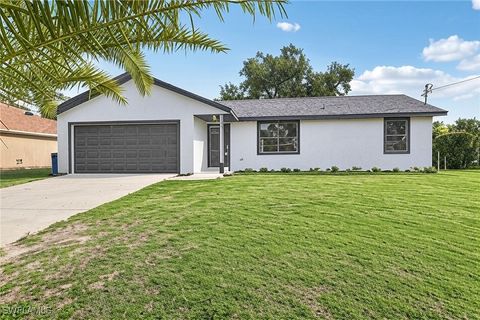
Active
$269,900
3
bds
|
2
ba
|
1,056
sqft
|
built
1991
4906 5th St W, Lehigh Acres, FL 33971
$-364
Cash flow
-7.0%
Cash-on-Cash Return
4.5%
Cap rate
0.7%
Rent to Value Ratio
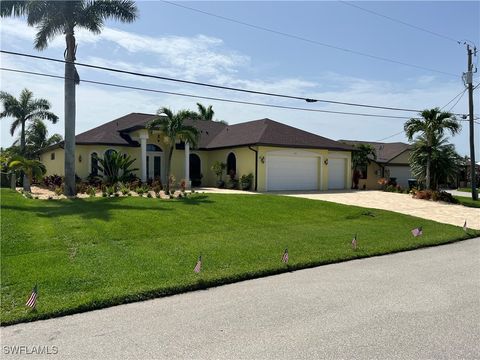
Active
$843,000
3
bds
|
3
ba
|
2,060
sqft
|
built
2009
4311 SW 20th Ave, Cape Coral, FL 33914
$-1,317
Cash flow
-8.2%
Cash-on-Cash Return
4.3%
Cap rate
0.6%
Rent to Value Ratio

Active
$510,000
5
bds
|
4
ba
|
3,266
sqft
|
built
2013
11164 Sparkleberry Dr, Fort Myers, FL 33913
$-680
Cash flow
-7.0%
Cash-on-Cash Return
4.5%
Cap rate
0.7%
Rent to Value Ratio

Active
$975,000
3
bds
|
3
ba
|
2,650
sqft
|
built
2023
20467 Napa Loop, Estero, FL 33928
$-3,295
Cash flow
-17.6%
Cash-on-Cash Return
2.1%
Cap rate
0.4%
Rent to Value Ratio
Active
$2,995,000
4
bds
|
6
ba
|
3,581
sqft
|
built
2023
160 SW 52nd Ter, Cape Coral, FL 33914
$-11,874
Cash flow
-20.7%
Cash-on-Cash Return
1.4%
Cap rate
0.3%
Rent to Value Ratio
Active
$6,950,000
4
bds
|
5
ba
|
3,921
sqft
|
built
2015
8088 Estero Blvd, Fort Myers Beach, FL 33931
$-31,667
Cash flow
-23.8%
Cash-on-Cash Return
0.7%
Cap rate
0.1%
Rent to Value Ratio
Active
$1,197,500
4
bds
|
3
ba
|
2,489
sqft
|
built
2003
28686 San Galgano Way, Bonita Springs, FL 34135
$-3,504
Cash flow
-15.3%
Cash-on-Cash Return
2.6%
Cap rate
0.5%
Rent to Value Ratio
Active
$595,000
3
bds
|
2
ba
|
2,037
sqft
|
built
2004
214 NE 23rd Ave, Cape Coral, FL 33909
$-1,709
Cash flow
-15.0%
Cash-on-Cash Return
2.7%
Cap rate
0.5%
Rent to Value Ratio
Active
$1,750,000
4
bds
|
3
ba
|
2,966
sqft
|
built
2022
18380 Wildblue Blvd, Fort Myers, FL 33913
$-6,589
Cash flow
-19.6%
Cash-on-Cash Return
1.6%
Cap rate
0.4%
Rent to Value Ratio
Active
$199,500
3
bds
|
3
ba
|
1,344
sqft
|
built
1971
8281 Sevigny Dr, North Fort Myers, FL 33917
$108
Cash flow
2.8%
Cash-on-Cash Return
6.8%
Cap rate
0.9%
Rent to Value Ratio
Active
$375,000
2
bds
|
2
ba
|
1,389
sqft
|
built
1993
3970 Windward Passage Cir, Bonita Springs, FL 34134
$-481
Cash flow
-6.7%
Cash-on-Cash Return
4.6%
Cap rate
0.7%
Rent to Value Ratio

Active
$299,900
2
bds
|
2
ba
|
1,504
sqft
|
built
2007
9631 Spanish Moss Way, Bonita Springs, FL 34135
$-558
Cash flow
-9.7%
Cash-on-Cash Return
3.9%
Cap rate
0.8%
Rent to Value Ratio

Active
$1,050,000
4
bds
|
6
ba
|
4,322
sqft
|
built
2010
19292 La Serena Dr, Estero, FL 33967
$-2,464
Cash flow
-12.2%
Cash-on-Cash Return
3.3%
Cap rate
0.6%
Rent to Value Ratio
Active
$549,999
2
bds
|
2
ba
|
1,268
sqft
|
built
1965
1432 Wellington Ct, Cape Coral, FL 33904
$-1,289
Cash flow
-12.2%
Cash-on-Cash Return
3.3%
Cap rate
0.6%
Rent to Value Ratio

Active
$1,150,000
4
bds
|
4
ba
|
3,481
sqft
|
built
2014
6057 Calusa Ridge Trl, Bokeelia, FL 33922
$-1,849
Cash flow
-8.4%
Cash-on-Cash Return
4.2%
Cap rate
0.6%
Rent to Value Ratio

Active
$799,000
3
bds
|
3
ba
|
2,361
sqft
|
built
2022
28086 Captiva Shell Loop, Bonita Springs, FL 34135
$-1,416
Cash flow
-9.2%
Cash-on-Cash Return
4.0%
Cap rate
0.7%
Rent to Value Ratio
Active
$399,900
2
bds
|
2
ba
|
1,665
sqft
|
built
2004
20051 Seagrove St, Estero, FL 33928
$-999
Cash flow
-13.0%
Cash-on-Cash Return
3.1%
Cap rate
0.7%
Rent to Value Ratio

Active
$335,000
2
bds
|
3
ba
|
1,635
sqft
|
built
1975
4406 Foremast Ct, Fort Myers, FL 33919
$-401
Cash flow
-6.2%
Cash-on-Cash Return
4.7%
Cap rate
0.7%
Rent to Value Ratio

Active
$625,000
4
bds
|
2
ba
|
2,450
sqft
|
built
2004
7810 Twin Eagle Ln, Fort Myers, FL 33912
$-1,132
Cash flow
-9.4%
Cash-on-Cash Return
4.0%
Cap rate
0.6%
Rent to Value Ratio

Active
$300,000
4
bds
|
2
ba
|
1,388
sqft
|
built
1958
4101 Rainbow Dr, Fort Myers, FL 33916
$-217
Cash flow
-3.8%
Cash-on-Cash Return
5.3%
Cap rate
0.7%
Rent to Value Ratio

Active
$319,999
3
bds
|
2
ba
|
1,946
sqft
|
built
2004
2022 NW 9th Ter, Cape Coral, FL 33993
$-307
Cash flow
-5.0%
Cash-on-Cash Return
5.0%
Cap rate
0.7%
Rent to Value Ratio
Active
$285,000
3
bds
|
2
ba
|
1,672
sqft
|
built
2020
20039 Sweetbay Dr, North Fort Myers, FL 33917
$-354
Cash flow
-6.5%
Cash-on-Cash Return
4.7%
Cap rate
0.9%
Rent to Value Ratio
Active
$435,000
4
bds
|
3
ba
|
2,238
sqft
|
built
2008
1109 NE 19th Ter, Cape Coral, FL 33909
$-645
Cash flow
-7.7%
Cash-on-Cash Return
4.4%
Cap rate
0.8%
Rent to Value Ratio
Active
$339,000
3
bds
|
2
ba
|
1,407
sqft
|
built
1992
21715 Bridgegate Ct, Estero, FL 33928
$-770
Cash flow
-11.9%
Cash-on-Cash Return
3.4%
Cap rate
0.7%
Rent to Value Ratio
Active
$184,990
3
bds
|
2
ba
|
1,002
sqft
|
built
2019
18313 Gibraltar Ln, Lehigh Acres, FL 33936
$-282
Cash flow
-8.0%
Cash-on-Cash Return
4.3%
Cap rate
0.9%
Rent to Value Ratio

Active
$599,000
3
bds
|
2
ba
|
1,554
sqft
|
built
1984
2197 River Rd, Fort Myers, FL 33905
$-1,309
Cash flow
-11.4%
Cash-on-Cash Return
3.5%
Cap rate
0.5%
Rent to Value Ratio
Active
$435,000
3
bds
|
2
ba
|
2,283
sqft
|
built
1979
1313 SE 37th Ter, Cape Coral, FL 33904
$-85
Cash flow
-1.0%
Cash-on-Cash Return
5.9%
Cap rate
0.8%
Rent to Value Ratio
Active
$349,000
3
bds
|
3
ba
|
2,033
sqft
|
built
2016
4096 Wilmont Pl, Fort Myers, FL 33916
$-652
Cash flow
-9.7%
Cash-on-Cash Return
3.9%
Cap rate
0.7%
Rent to Value Ratio
Active
$750,000
3
bds
|
3
ba
|
2,208
sqft
|
built
1987
5012 SW 8th Pl, Cape Coral, FL 33914
$-1,258
Cash flow
-8.8%
Cash-on-Cash Return
4.1%
Cap rate
0.6%
Rent to Value Ratio

Active
$299,900
3
bds
|
3
ba
|
1,942
sqft
|
built
2022
14193 Pine Lodge Ln, Fort Myers, FL 33913
$-718
Cash flow
-12.5%
Cash-on-Cash Return
3.3%
Cap rate
0.7%
Rent to Value Ratio

Active
$217,900
2
bds
|
2
ba
|
878
sqft
|
built
1987
13391 Broadhurst Loop, Fort Myers, FL 33919
$-704
Cash flow
-16.9%
Cash-on-Cash Return
2.3%
Cap rate
0.7%
Rent to Value Ratio

Active
$450,000
4
bds
|
2
ba
|
2,132
sqft
|
built
2000
14561 Glen Cove Dr, Fort Myers, FL 33919
$-1,392
Cash flow
-16.1%
Cash-on-Cash Return
2.4%
Cap rate
0.6%
Rent to Value Ratio
Active
$390,000
3
bds
|
2
ba
|
1,638
sqft
|
built
2006
306 NE 29th Ter, Cape Coral, FL 33909
$-492
Cash flow
-6.6%
Cash-on-Cash Return
4.6%
Cap rate
0.7%
Rent to Value Ratio
Active
$380,000
4
bds
|
2
ba
|
1,843
sqft
|
built
1994
23 NW 22nd Ave, Cape Coral, FL 33993
$-264
Cash flow
-3.6%
Cash-on-Cash Return
5.3%
Cap rate
0.8%
Rent to Value Ratio

Active
$579,900
4
bds
|
3
ba
|
2,270
sqft
|
built
2002
12839 Fox Hollow Cir, Fort Myers, FL 33912
$-1,423
Cash flow
-12.8%
Cash-on-Cash Return
3.2%
Cap rate
0.6%
Rent to Value Ratio

Active
$435,000
2
bds
|
3
ba
|
2,023
sqft
|
built
2020
11899 Lakewood Preserve Pl, Fort Myers, FL 33913
$-1,024
Cash flow
-12.3%
Cash-on-Cash Return
3.3%
Cap rate
0.7%
Rent to Value Ratio

Active
$1,200,000
5
bds
|
4
ba
|
3,928
sqft
|
built
2000
1357 Osceola Dr, Fort Myers, FL 33901
$-2,208
Cash flow
-9.6%
Cash-on-Cash Return
3.9%
Cap rate
0.6%
Rent to Value Ratio
Active
$569,918
3
bds
|
3
ba
|
2,086
sqft
|
built
1998
3332 SE 22nd Pl, Cape Coral, FL 33904
$-1,379
Cash flow
-12.6%
Cash-on-Cash Return
3.2%
Cap rate
0.5%
Rent to Value Ratio