Miami Dade County Investment Properties for Sale
Browse homes for sale and investment properties in Miami Dade County. Refine your search by price, property type, or more.
Best cash flowing properties in Miami Dade County
Active
$110,000
0
bds
|
1
ba
|
612
sqft
|
built
1972
12500 NE 15th Ave, North Miami, FL 33161
$-13
Cash flow
-0.6%
Cash-on-Cash Return
6.0%
Cap rate
1.6%
Rent to Value Ratio
Active
$330,000
3
bds
|
3
ba
|
1,384
sqft
|
built
2005
12080 SW 268th St, Homestead, FL 33032
$-436
Cash flow
-6.9%
Cash-on-Cash Return
4.6%
Cap rate
0.8%
Rent to Value Ratio
10,000 out of 12,409 properties for sale in Miami Dade County
Limited Results Shown
Create a free account, or log in to reveal all property listings and enjoy the complete experience.
Active
$11,795,000
3
bds
|
5
ba
|
2,569
sqft
|
built
2002
100 S Pointe Dr, Miami Beach, FL 33139
$-62,053
Cash flow
-27.4%
Cash-on-Cash Return
-0.2%
Cap rate
0.1%
Rent to Value Ratio
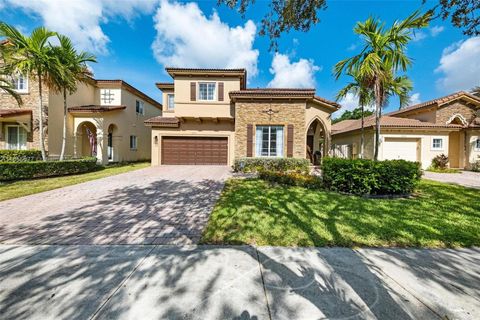
Active
$544,900
5
bds
|
3
ba
|
2,693
sqft
|
built
2006
201 NE 36th Ter, Homestead, FL 33033
$-1,071
Cash flow
-10.3%
Cash-on-Cash Return
3.8%
Cap rate
0.6%
Rent to Value Ratio
Active
$589,900
4
bds
|
2
ba
|
1,611
sqft
|
built
1986
13217 SW 257th Ter, Homestead, FL 33032
$-1,246
Cash flow
-11.0%
Cash-on-Cash Return
3.6%
Cap rate
0.5%
Rent to Value Ratio
Active
$8,600,000
5
bds
|
5
ba
|
4,166
sqft
|
built
2012
545 Sabal Palm Dr, Key Biscayne, FL 33149
$-41,207
Cash flow
-25.0%
Cash-on-Cash Return
0.4%
Cap rate
0.1%
Rent to Value Ratio
Active
$650,000
4
bds
|
2
ba
|
1,666
sqft
|
built
1976
12001 SW 191st Ter, Miami, FL 33177
$-1,603
Cash flow
-12.9%
Cash-on-Cash Return
3.2%
Cap rate
0.5%
Rent to Value Ratio
Active
$998,000
2
bds
|
2
ba
|
1,097
sqft
|
built
2004
6515 Collins Ave, Miami Beach, FL 33141
$-5,175
Cash flow
-27.1%
Cash-on-Cash Return
-0.1%
Cap rate
0.5%
Rent to Value Ratio
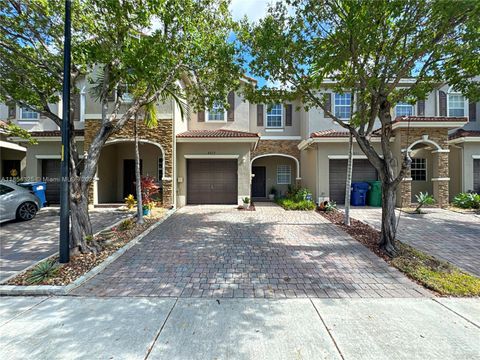
Active
$436,000
3
bds
|
3
ba
|
1,686
sqft
|
built
2020
12775 SW 247th St, Homestead, FL 33032
$-658
Cash flow
-7.9%
Cash-on-Cash Return
4.3%
Cap rate
0.7%
Rent to Value Ratio
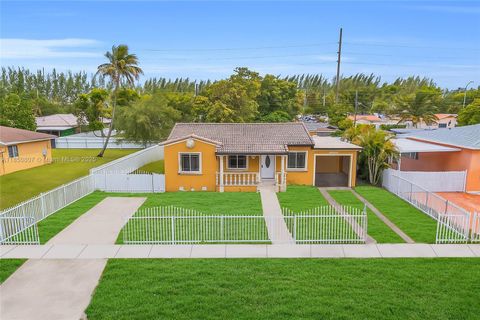
Active
$650,000
4
bds
|
2
ba
|
1,570
sqft
|
built
1954
250 E 34th St, Hialeah, FL 33013
$-963
Cash flow
-7.7%
Cash-on-Cash Return
4.4%
Cap rate
0.6%
Rent to Value Ratio
Active
$710,000
4
bds
|
3
ba
|
2,429
sqft
|
built
2005
22536 SW 94th Pl, Cutler Bay, FL 33190
$-2,204
Cash flow
-16.2%
Cash-on-Cash Return
2.4%
Cap rate
0.5%
Rent to Value Ratio
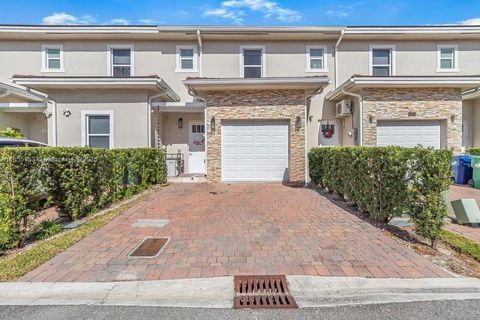
Active
$449,000
3
bds
|
3
ba
|
1,463
sqft
|
built
2011
8877 SW 223rd Ln, Cutler Bay, FL 33190
$-1,360
Cash flow
-15.8%
Cash-on-Cash Return
2.5%
Cap rate
0.6%
Rent to Value Ratio
Active
$310,000
bds
|
1
ba
|
543
sqft
|
built
1968
1000 West Ave, Miami Beach, FL 33139
$-1,210
Cash flow
-20.4%
Cash-on-Cash Return
1.5%
Cap rate
0.6%
Rent to Value Ratio
Active
$1,100,000
4
bds
|
0
ba
|
1,214
sqft
|
built
1928
652 NW 31st St, Miami, FL 33127
$-3,208
Cash flow
-15.2%
Cash-on-Cash Return
2.6%
Cap rate
0.4%
Rent to Value Ratio
Active
$688,000
2
bds
|
0
ba
|
1,656
sqft
|
built
1941
1554 NW 58th St, Miami, FL 33142
$-2,473
Cash flow
-18.8%
Cash-on-Cash Return
1.8%
Cap rate
0.3%
Rent to Value Ratio
Active
$630,000
1
bds
|
2
ba
|
948
sqft
|
built
2008
888 Biscayne Blvd, Miami, FL 33132
$-2,315
Cash flow
-19.2%
Cash-on-Cash Return
1.7%
Cap rate
0.6%
Rent to Value Ratio
Active
$450,000
2
bds
|
2
ba
|
990
sqft
|
built
1972
750 NE 64th St, Miami, FL 33138
$-706
Cash flow
-8.2%
Cash-on-Cash Return
4.3%
Cap rate
0.7%
Rent to Value Ratio
Active
$699,990
4
bds
|
3
ba
|
2,490
sqft
|
built
1961
17881 SW 112th Pl, Miami, FL 33157
$-1,315
Cash flow
-9.8%
Cash-on-Cash Return
3.9%
Cap rate
0.5%
Rent to Value Ratio
Active
$459,000
2
bds
|
2
ba
|
870
sqft
|
built
1924
802 Euclid Ave, Miami Beach, FL 33139
$-1,544
Cash flow
-17.6%
Cash-on-Cash Return
2.1%
Cap rate
0.6%
Rent to Value Ratio
Active
$1,300,000
3
bds
|
3
ba
|
1,694
sqft
|
built
1991
3530 Mystic Pointe Dr, Aventura, FL 33180
$-4,433
Cash flow
-17.8%
Cash-on-Cash Return
2.1%
Cap rate
0.4%
Rent to Value Ratio
Active
$580,000
2
bds
|
1
ba
|
1,183
sqft
|
built
1960
7230 NW 5th St, Miami, FL 33126
$-1,711
Cash flow
-15.4%
Cash-on-Cash Return
2.6%
Cap rate
0.6%
Rent to Value Ratio
Active
$469,900
4
bds
|
4
ba
|
1,878
sqft
|
built
1957
10235 SW 177th St, Miami, FL 33157
$-758
Cash flow
-8.4%
Cash-on-Cash Return
4.2%
Cap rate
0.7%
Rent to Value Ratio
Active
$479,900
1
bds
|
1
ba
|
738
sqft
|
built
2008
500 Brickell Ave, Miami, FL 33131
$-1,520
Cash flow
-16.5%
Cash-on-Cash Return
2.3%
Cap rate
0.7%
Rent to Value Ratio
Active
$395,000
2
bds
|
3
ba
|
1,123
sqft
|
built
2010
8800 NW 107th Ct, Doral, FL 33178
$-1,308
Cash flow
-17.3%
Cash-on-Cash Return
2.2%
Cap rate
0.6%
Rent to Value Ratio
Active
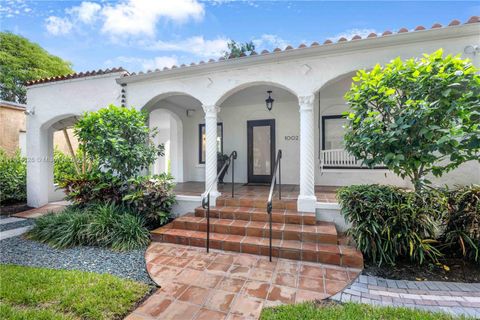
$1,395,000
3
bds
|
2
ba
|
1,461
sqft
|
built
1926
1002 Madrid St, Coral Gables, FL 33134
$-4,021
Cash flow
-15.0%
Cash-on-Cash Return
2.7%
Cap rate
0.4%
Rent to Value Ratio
Active
$690,000
3
bds
|
2
ba
|
1,892
sqft
|
built
1978
9315 SW 170th Ln, Palmetto Bay, FL 33157
$-1,899
Cash flow
-14.4%
Cash-on-Cash Return
2.8%
Cap rate
0.5%
Rent to Value Ratio
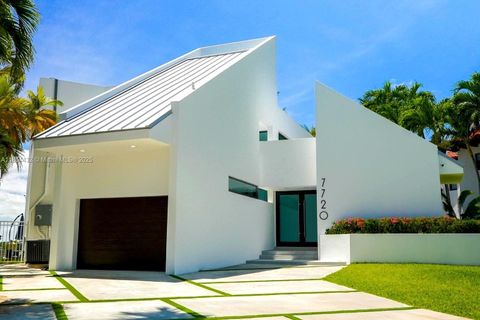
Active
$9,799,000
5
bds
|
4
ba
|
3,758
sqft
|
built
1981
7720 Miami View Dr, North Bay Village, FL 33141
$-49,593
Cash flow
-26.4%
Cash-on-Cash Return
0.1%
Cap rate
0.1%
Rent to Value Ratio
Active
$1,500,000
2
bds
|
3
ba
|
1,494
sqft
|
built
2008
200 Biscayne Boulevard Way, Miami, FL 33131
$-5,922
Cash flow
-20.6%
Cash-on-Cash Return
1.4%
Cap rate
0.5%
Rent to Value Ratio
Active
$1,149,000
4
bds
|
4
ba
|
2,650
sqft
|
built
2013
10023 NW 89th Ter, Doral, FL 33178
$-4,124
Cash flow
-18.7%
Cash-on-Cash Return
1.8%
Cap rate
0.4%
Rent to Value Ratio
Active
$949,900
2
bds
|
0
ba
|
2,659
sqft
|
built
1934
453 NE 154th St, Miami, FL 33162
$-3,786
Cash flow
-20.8%
Cash-on-Cash Return
1.4%
Cap rate
0.2%
Rent to Value Ratio
Active
$399,000
1
bds
|
2
ba
|
978
sqft
|
built
2008
253 NE 2nd St, Miami, FL 33132
$-1,543
Cash flow
-20.2%
Cash-on-Cash Return
1.5%
Cap rate
0.8%
Rent to Value Ratio
Active
$899,000
4
bds
|
2
ba
|
1,907
sqft
|
built
1965
10480 SW 93rd Ter, Miami, FL 33176
$-1,791
Cash flow
-10.4%
Cash-on-Cash Return
3.8%
Cap rate
0.5%
Rent to Value Ratio
Active
$675,000
4
bds
|
2
ba
|
1,915
sqft
|
built
1988
14868 SW 56th Ter, Miami, FL 33193
$-1,669
Cash flow
-12.9%
Cash-on-Cash Return
3.2%
Cap rate
0.5%
Rent to Value Ratio
Active
$12,900,000
6
bds
|
8
ba
|
6,521
sqft
|
built
2014
1300 Brickell Bay Dr, Miami, FL 33131
$-75,843
Cash flow
-30.7%
Cash-on-Cash Return
-0.9%
Cap rate
0.1%
Rent to Value Ratio
Active
$859,000
3
bds
|
2
ba
|
1,476
sqft
|
built
1967
12273 SW 27th St, Miami, FL 33175
$-2,170
Cash flow
-13.2%
Cash-on-Cash Return
3.1%
Cap rate
0.4%
Rent to Value Ratio
Active
$699,000
4
bds
|
3
ba
|
2,048
sqft
|
built
2022
13200 SW 269th Ter, Homestead, FL 33032
$-2,118
Cash flow
-15.8%
Cash-on-Cash Return
2.5%
Cap rate
0.5%
Rent to Value Ratio
Active
$769,000
4
bds
|
3
ba
|
2,084
sqft
|
built
1956
490 W 53rd St, Hialeah, FL 33012
$-2,360
Cash flow
-16.0%
Cash-on-Cash Return
2.5%
Cap rate
0.5%
Rent to Value Ratio
Active
$569,000
2
bds
|
2
ba
|
970
sqft
|
built
2008
4100 Salzedo St, Coral Gables, FL 33146
$-2,510
Cash flow
-23.0%
Cash-on-Cash Return
0.9%
Cap rate
0.6%
Rent to Value Ratio
Active
$1,199,977
3
bds
|
2
ba
|
1,403
sqft
|
built
1950
855 NE 111th St, Biscayne Park, FL 33161
$-3,392
Cash flow
-14.7%
Cash-on-Cash Return
2.8%
Cap rate
0.4%
Rent to Value Ratio
Active
$800,000
4
bds
|
3
ba
|
2,136
sqft
|
built
2004
9506 SW 220th Ln, Cutler Bay, FL 33190
$-2,308
Cash flow
-15.1%
Cash-on-Cash Return
2.7%
Cap rate
0.4%
Rent to Value Ratio