Miami Dade County Investment Properties for Sale
Browse homes for sale and investment properties in Miami Dade County. Refine your search by price, property type, or more.
Best cash flowing properties in Miami Dade County

Active
$365,000
3
bds
|
2
ba
|
930
sqft
|
built
1955
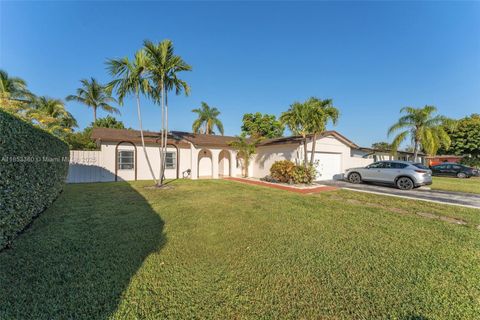
30221 SW 173rd Ave, Homestead, FL 33030
$-247
Cash flow
-3.5%
Cash-on-Cash Return
5.3%
Cap rate
0.7%
Rent to Value Ratio

Active
$374,999
3
bds
|
1
ba
|
1,057
sqft
|
built
1971
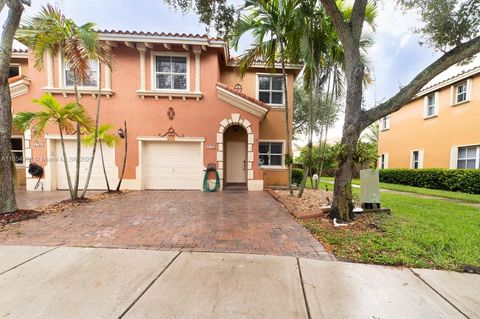
2135 NW 154th St, Miami Gardens, FL 33054
$-266
Cash flow
-3.7%
Cash-on-Cash Return
5.3%
Cap rate
0.8%
Rent to Value Ratio
10,000 out of 14,307 properties for sale in Miami Dade County
Limited Results Shown
Create a free account, or log in to reveal all property listings and enjoy the complete experience.
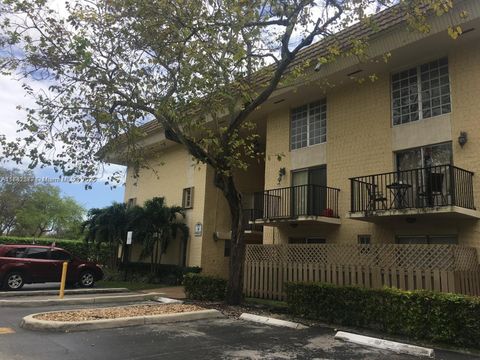
Active
$580,000
3
bds
|
2
ba
|
1,514
sqft
|
built
1954
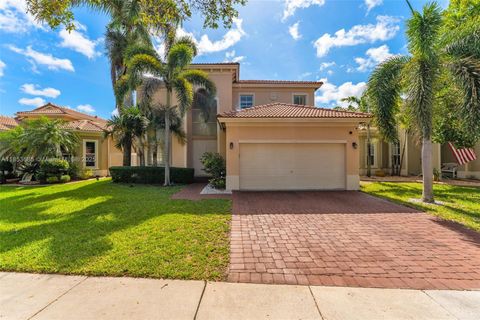
5890 Palm Ave, Hialeah, FL 33012
$-1,180
Cash flow
-10.6%
Cash-on-Cash Return
3.7%
Cap rate
0.6%
Rent to Value Ratio

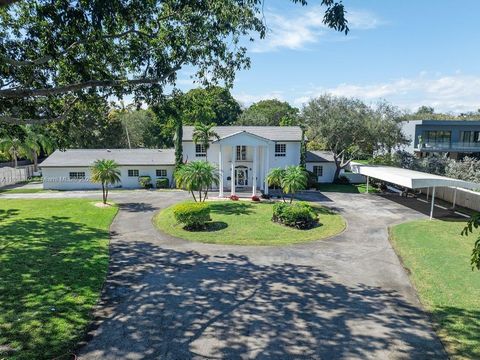
Active
$1,150,000
3
bds
|
3
ba
|
2,370
sqft
|
built
1981
399 Poinciana Dr, Sunny Isles Beach, FL 33160
$-3,165
Cash flow
-14.4%
Cash-on-Cash Return
2.8%
Cap rate
0.7%
Rent to Value Ratio
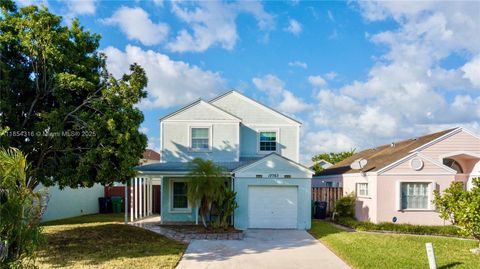
Active
$427,500
3
bds
|
3
ba
|
1,393
sqft
|
built
2022
13310 SW 286th St, Homestead, FL 33033
$-1,311
Cash flow
-16.0%
Cash-on-Cash Return
2.5%
Cap rate
0.6%
Rent to Value Ratio
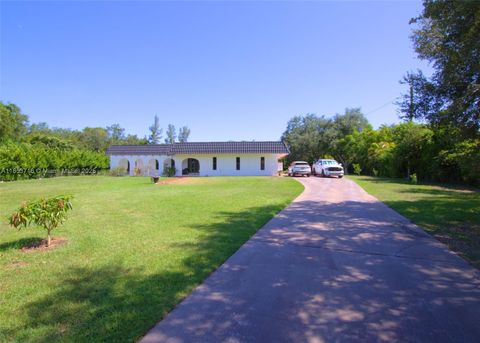
Active
$500,000
3
bds
|
3
ba
|
1,638
sqft
|
built
1937
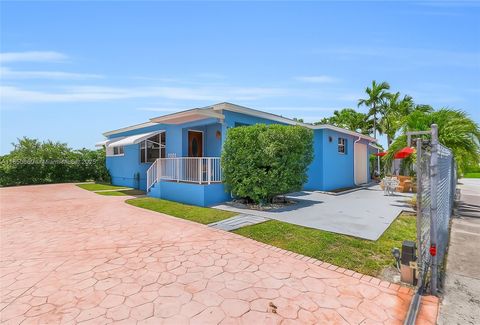
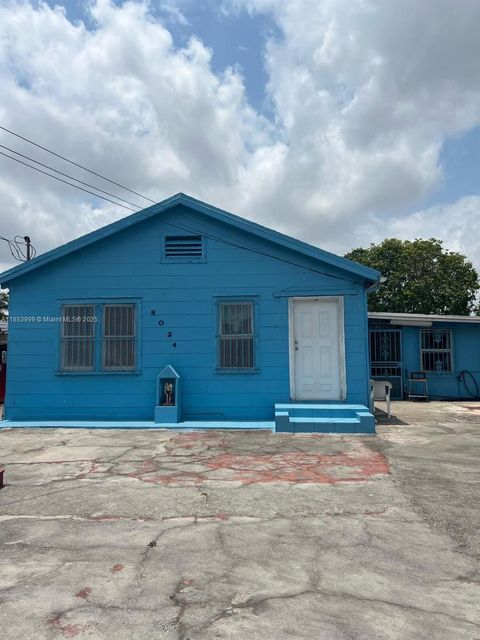
8024 NW 36th Ct, Miami, FL 33147
$-727
Cash flow
-7.6%
Cash-on-Cash Return
4.4%
Cap rate
0.6%
Rent to Value Ratio
Active
$495,000
2
bds
|
2
ba
|
1,268
sqft
|
built
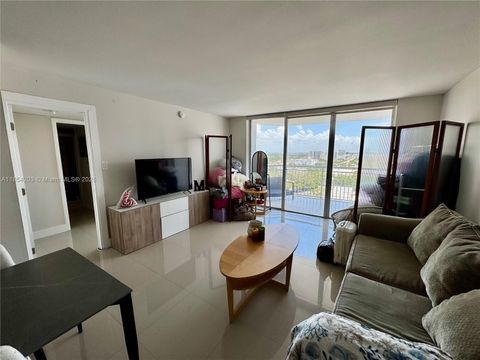
1982
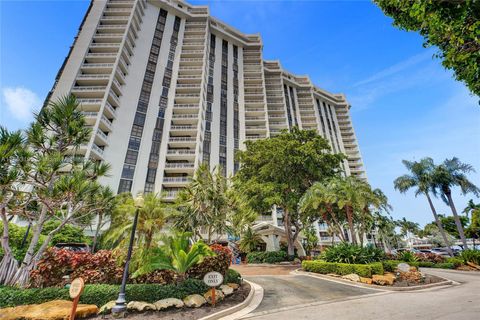
4000 Towerside Ter, Miami, FL 33138
$-1,425
Cash flow
-15.0%
Cash-on-Cash Return
2.7%
Cap rate
0.9%
Rent to Value Ratio

Active
$869,000
2
bds
|
2
ba
|
1,444
sqft
|
built
1966
2035 NE 123rd St, North Miami, FL 33181
$-1,932
Cash flow
-11.6%
Cash-on-Cash Return
3.5%
Cap rate
0.5%
Rent to Value Ratio

Active
$350,000
1
bds
|
2
ba
|
786
sqft
|
built
1970
1750 James Ave, Miami Beach, FL 33139
$-844
Cash flow
-12.6%
Cash-on-Cash Return
3.3%
Cap rate
0.7%
Rent to Value Ratio
Active
$649,900
3
bds
|
2
ba
|
2,226
sqft
|
built
1996
2725 Fairways Dr, Homestead, FL 33035
$-1,698
Cash flow
-13.6%
Cash-on-Cash Return
3.0%
Cap rate
0.6%
Rent to Value Ratio
Active
$424,900
3
bds
|
3
ba
|
1,442
sqft
|
built
2022
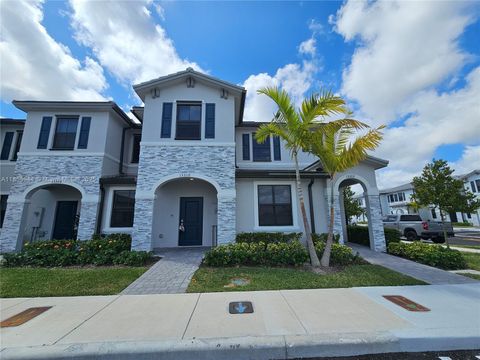
11957 SW 245th Ter, Homestead, FL 33032
$-1,049
Cash flow
-12.9%
Cash-on-Cash Return
3.2%
Cap rate
0.7%
Rent to Value Ratio

Active
$649,900
4
bds
|
3
ba
|
1,580
sqft
|
built
1947
110 Flagami Blvd, Miami, FL 33144
$-1,048
Cash flow
-8.4%
Cash-on-Cash Return
4.2%
Cap rate
0.5%
Rent to Value Ratio

Active
$580,000
2
bds
|
2
ba
|
1,774
sqft
|
built
1980
7380 SW 114th Pl, Miami, FL 33173
$-1,273
Cash flow
-11.5%
Cash-on-Cash Return
3.5%
Cap rate
0.6%
Rent to Value Ratio
Active
$450,000
3
bds
|
2
ba
|
1,525
sqft
|
built
1983
460 NE 211th Ter, Miami, FL 33179
$-950
Cash flow
-11.0%
Cash-on-Cash Return
3.6%
Cap rate
0.6%
Rent to Value Ratio
Active
$228,000
1
bds
|
1
ba
|
825
sqft
|
built
1975
1300 NE Miami Gardens Dr, Miami, FL 33179
$-549
Cash flow
-12.6%
Cash-on-Cash Return
3.3%
Cap rate
0.7%
Rent to Value Ratio
Active
$199,000
1
bds
|
2
ba
|
801
sqft
|
built
1969
8600 SW 109th Ave, Miami, FL 33173
$-511
Cash flow
-13.4%
Cash-on-Cash Return
3.1%
Cap rate
0.9%
Rent to Value Ratio
Active
$3,500,000
7
bds
|
7
ba
|
5,102
sqft
|
built
1961
13000 Old Cutler Rd, Pinecrest, FL 33156
$-14,600
Cash flow
-21.8%
Cash-on-Cash Return
1.1%
Cap rate
0.3%
Rent to Value Ratio
Active
$545,000
3
bds
|
2
ba
|
1,634
sqft
|
built
1988
12763 SW 146th Ln, Miami, FL 33186
$-859
Cash flow
-8.2%
Cash-on-Cash Return
4.3%
Cap rate
0.6%
Rent to Value Ratio
Active
$925,000
3
bds
|
2
ba
|
2,115
sqft
|
built
1975
15200 SW 268th St, Homestead, FL 33032
$-2,517
Cash flow
-14.2%
Cash-on-Cash Return
2.9%
Cap rate
0.4%
Rent to Value Ratio
Active
$268,500
2
bds
|
2
ba
|
994
sqft
|
built
1972
3301 N Country Club Dr, Miami, FL 33180
$-867
Cash flow
-16.8%
Cash-on-Cash Return
2.3%
Cap rate
0.9%
Rent to Value Ratio
Active
$299,900
2
bds
|
2
ba
|
1,112
sqft
|
built
1968
17144 SW 112th Ct, Miami, FL 33157
$-643
Cash flow
-11.2%
Cash-on-Cash Return
3.6%
Cap rate
0.9%
Rent to Value Ratio

Active
$240,000
1
bds
|
1
ba
|
450
sqft
|
built
1940
810 7th St, Miami Beach, FL 33139
$-709
Cash flow
-15.4%
Cash-on-Cash Return
2.6%
Cap rate
0.8%
Rent to Value Ratio
Active
$1,998,000
6
bds
|
4
ba
|
3,046
sqft
|
built
2005
26363 SW 152nd Ave, Homestead, FL 33032
$-7,966
Cash flow
-20.8%
Cash-on-Cash Return
1.4%
Cap rate
0.3%
Rent to Value Ratio
Active
$160,000
1
bds
|
1
ba
|
658
sqft
|
built
1971
16465 NE 22nd Ave, North Miami Beach, FL 33160
$-340
Cash flow
-11.1%
Cash-on-Cash Return
3.6%
Cap rate
1.1%
Rent to Value Ratio
Active
$1,250,000
3
bds
|
3
ba
|
1,581
sqft
|
built
1950
173 NW 107th St, Miami Shores, FL 33168
$-5,503
Cash flow
-23.0%
Cash-on-Cash Return
0.9%
Cap rate
0.2%
Rent to Value Ratio
Active
$194,900
1
bds
|
1
ba
|
717
sqft
|
built
1971
18011 Biscayne Blvd, Aventura, FL 33160
$-802
Cash flow
-21.5%
Cash-on-Cash Return
1.2%
Cap rate
1.0%
Rent to Value Ratio
Active
$699,999
4
bds
|
2
ba
|
1,612
sqft
|
built
1974
7230 SW 131st Ave, Miami, FL 33183
$-1,887
Cash flow
-14.1%
Cash-on-Cash Return
2.9%
Cap rate
0.5%
Rent to Value Ratio

Active
$950,000
2
bds
|
2
ba
|
1,322
sqft
|
built
2007
50 Biscayne Blvd, Miami, FL 33132
$-2,795
Cash flow
-15.4%
Cash-on-Cash Return
2.6%
Cap rate
0.7%
Rent to Value Ratio

Active
$799,000
3
bds
|
3
ba
|
1,730
sqft
|
built
2005
3340 NE 190th St, Aventura, FL 33180
$-1,330
Cash flow
-8.7%
Cash-on-Cash Return
4.1%
Cap rate
0.9%
Rent to Value Ratio

Active
$429,999
2
bds
|
2
ba
|
1,120
sqft
|
built
1985
11269 SW 155th Ln, Miami, FL 33157
$-391
Cash flow
-4.7%
Cash-on-Cash Return
5.1%
Cap rate
0.7%
Rent to Value Ratio
Active
$550,000
3
bds
|
2
ba
|
1,710
sqft
|
built
2004
3100 SW 153rd Path, Miami, FL 33185
$-1,129
Cash flow
-10.7%
Cash-on-Cash Return
3.7%
Cap rate
0.6%
Rent to Value Ratio
Active
$590,000
4
bds
|
3
ba
|
2,094
sqft
|
built
2005
1755 NE 37th Ave, Homestead, FL 33033
$-1,629
Cash flow
-14.4%
Cash-on-Cash Return
2.8%
Cap rate
0.6%
Rent to Value Ratio
Active
$550,000
3
bds
|
2
ba
|
1,663
sqft
|
built
1958
19211 NW 37th Ct, Miami Gardens, FL 33055
$-710
Cash flow
-6.7%
Cash-on-Cash Return
4.6%
Cap rate
0.6%
Rent to Value Ratio
Active
$599,000
2
bds
|
2
ba
|
1,061
sqft
|
built
1987
7601 E Treasure Dr, North Bay Village, FL 33141
$-2,007
Cash flow
-17.5%
Cash-on-Cash Return
2.1%
Cap rate
0.6%
Rent to Value Ratio

Active
$540,000
4
bds
|
2
ba
|
1,429
sqft
|
built
1956
10250 Caribbean Blvd, Cutler Bay, FL 33189
$-793
Cash flow
-7.7%
Cash-on-Cash Return
4.4%
Cap rate
0.6%
Rent to Value Ratio

Active
$1,440,000
4
bds
|
3
ba
|
2,490
sqft
|
built
1989
15021 SW 75th Ct, Palmetto Bay, FL 33158
$-3,713
Cash flow
-13.5%
Cash-on-Cash Return
3.1%
Cap rate
0.4%
Rent to Value Ratio

Active
$299,900
2
bds
|
1
ba
|
800
sqft
|
built
1925
1027 Pennsylvania Ave, Miami Beach, FL 33139
$-771
Cash flow
-13.4%
Cash-on-Cash Return
3.1%
Cap rate
0.9%
Rent to Value Ratio
Active
$510,000
1
bds
|
2
ba
|
761
sqft
|
built
2005
601 NE 36th St, Miami, FL 33137
$-1,488
Cash flow
-15.2%
Cash-on-Cash Return
2.6%
Cap rate
0.6%
Rent to Value Ratio
Active
$2,796,000
4
bds
|
2
ba
|
2,630
sqft
|
built
1939
528 Sevilla Ave, Coral Gables, FL 33134
$-11,418
Cash flow
-21.3%
Cash-on-Cash Return
1.2%
Cap rate
0.3%
Rent to Value Ratio

Active
$400,000
3
bds
|
3
ba
|
1,466
sqft
|
built
2022
1150 SW 6th Ave, Florida City, FL 33034
$-1,024
Cash flow
-13.4%
Cash-on-Cash Return
3.1%
Cap rate
0.7%
Rent to Value Ratio