Miami Dade County Investment Properties for Sale
Browse homes for sale and investment properties in Miami Dade County. Refine your search by price, property type, or more.
Best cash flowing properties in Miami Dade County

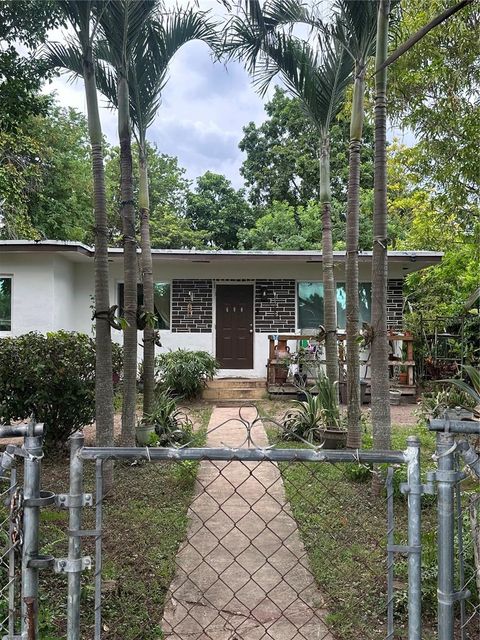
Active
$174,900
1
bds
|
1
ba
|
603
sqft
|
built
1963
2330 NW 11th St, Miami, FL 33125
$-218
Cash flow
-6.5%
Cash-on-Cash Return
4.7%
Cap rate
0.9%
Rent to Value Ratio
Active
$300,000
2
bds
|
1
ba
|
732
sqft
|
built
1968
690 NW 1st St, Florida City, FL 33034
$-268
Cash flow
-4.7%
Cash-on-Cash Return
5.1%
Cap rate
0.8%
Rent to Value Ratio
10,000 out of 11,974 properties for sale in Miami Dade County
Limited Results Shown
Create a free account, or log in to reveal all property listings and enjoy the complete experience.
Active
$1,950,000
4
bds
|
3
ba
|
3,120
sqft
|
built
1997
11335 NW 66th St, Doral, FL 33178
$-7,284
Cash flow
-19.5%
Cash-on-Cash Return
1.7%
Cap rate
0.3%
Rent to Value Ratio
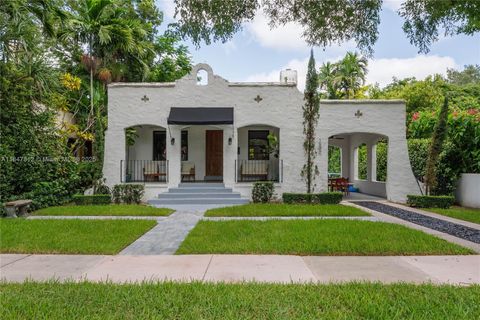
Active
$1,395,000
2
bds
|
2
ba
|
1,603
sqft
|
built
1925
1500 Madrid St, Coral Gables, FL 33134
$-3,461
Cash flow
-12.9%
Cash-on-Cash Return
3.2%
Cap rate
0.5%
Rent to Value Ratio
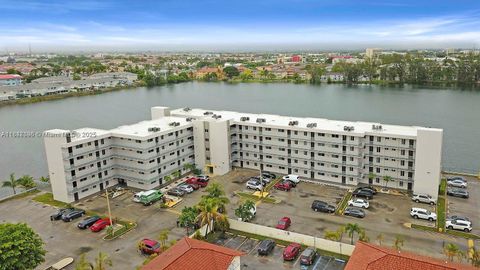
Active
$295,000
2
bds
|
2
ba
|
1,000
sqft
|
built
1990
9917 W Okeechobee Rd, Hialeah, FL 33016
$-616
Cash flow
-10.9%
Cash-on-Cash Return
3.6%
Cap rate
0.8%
Rent to Value Ratio
Active
$139,990
bds
|
1
ba
|
360
sqft
|
built
1966
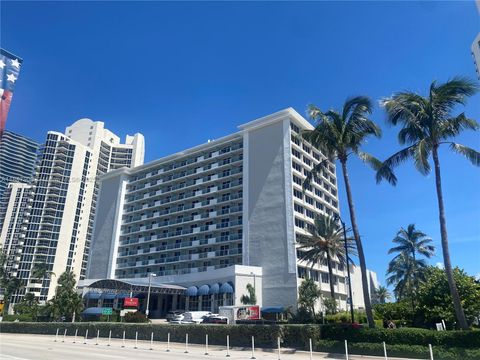
19201 Collins Ave, Sunny Isles Beach, FL 33160
$-491
Cash flow
-18.3%
Cash-on-Cash Return
1.9%
Cap rate
1.8%
Rent to Value Ratio
Active
$759,000
3
bds
|
2
ba
|
1,964
sqft
|
built
1972
9131 SW 178th Ter, Palmetto Bay, FL 33157
$-1,543
Cash flow
-10.6%
Cash-on-Cash Return
3.7%
Cap rate
0.5%
Rent to Value Ratio
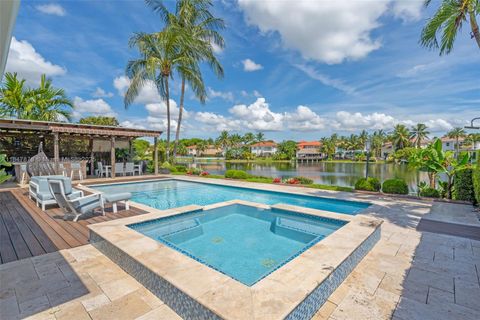
Active
$349,000
2
bds
|
2
ba
|
883
sqft
|
built
1982
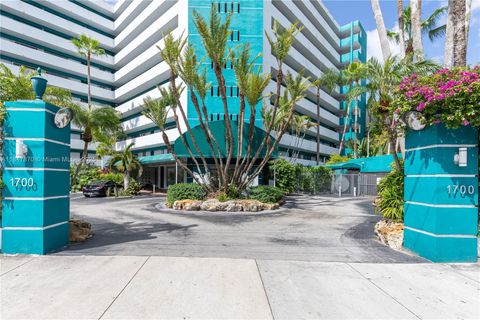
1700 NW North River Dr, Miami, FL 33125
$-1,106
Cash flow
-16.5%
Cash-on-Cash Return
2.3%
Cap rate
0.7%
Rent to Value Ratio
Active
$1,300,000
2
bds
|
3
ba
|
1,043
sqft
|
built
2022
398 NE 5th St, Miami, FL 33132
$-2,193
Cash flow
-8.8%
Cash-on-Cash Return
4.1%
Cap rate
0.6%
Rent to Value Ratio
Active
$485,000
1
bds
|
1
ba
|
818
sqft
|
built
2005
1200 Brickell Bay Dr, Miami, FL 33131
$-1,731
Cash flow
-18.6%
Cash-on-Cash Return
1.9%
Cap rate
0.6%
Rent to Value Ratio
Active
$500,000
2
bds
|
2
ba
|
1,331
sqft
|
built
1975
100 Bayview Dr, Sunny Isles Beach, FL 33160
$-2,179
Cash flow
-22.7%
Cash-on-Cash Return
0.9%
Cap rate
0.6%
Rent to Value Ratio
Active
$570,000
3
bds
|
2
ba
|
1,950
sqft
|
built
2002
10700 NW 66th St, Doral, FL 33178
$-1,965
Cash flow
-18.0%
Cash-on-Cash Return
2.0%
Cap rate
0.6%
Rent to Value Ratio

Active
$749,000
4
bds
|
2
ba
|
1,800
sqft
|
built
1957
10120 Nicaragua Dr, Cutler Bay, FL 33189
$-1,521
Cash flow
-10.6%
Cash-on-Cash Return
3.7%
Cap rate
0.6%
Rent to Value Ratio
Active
$999,000
2
bds
|
2
ba
|
1,248
sqft
|
built
1974
9273 Collins Ave, Surfside, FL 33154
$-4,209
Cash flow
-22.0%
Cash-on-Cash Return
1.1%
Cap rate
0.5%
Rent to Value Ratio
Active
$595,000
4
bds
|
3
ba
|
2,972
sqft
|
built
2016
11587 SW 246th Ter, Homestead, FL 33032
$-1,275
Cash flow
-11.2%
Cash-on-Cash Return
3.6%
Cap rate
0.7%
Rent to Value Ratio
Active
$329,900
3
bds
|
2
ba
|
1,150
sqft
|
built
1984
9285 SW 125th Ave, Miami, FL 33186
$-807
Cash flow
-12.8%
Cash-on-Cash Return
3.2%
Cap rate
0.8%
Rent to Value Ratio
Active
$879,000
4
bds
|
4
ba
|
2,622
sqft
|
built
2014
8776 W 33rd Ave, Hialeah, FL 33018
$-2,475
Cash flow
-14.7%
Cash-on-Cash Return
2.8%
Cap rate
0.5%
Rent to Value Ratio
Active
$750,000
5
bds
|
3
ba
|
1,860
sqft
|
built
1965
6975 W 10th Ct, Hialeah, FL 33014
$-1,926
Cash flow
-13.4%
Cash-on-Cash Return
3.1%
Cap rate
0.5%
Rent to Value Ratio
Active
$1,476,000
5
bds
|
3
ba
|
2,837
sqft
|
built
1959
19810 NE 22nd Ave, Miami, FL 33180
$-2,286
Cash flow
-8.1%
Cash-on-Cash Return
4.3%
Cap rate
0.7%
Rent to Value Ratio
Active
$845,900
4
bds
|
2
ba
|
1,608
sqft
|
built
1961
3500 SW 121st Ave, Miami, FL 33175
$-2,422
Cash flow
-14.9%
Cash-on-Cash Return
2.7%
Cap rate
0.5%
Rent to Value Ratio
Active
$540,000
3
bds
|
2
ba
|
1,546
sqft
|
built
1969
1239 Mariposa Ave, Coral Gables, FL 33146
$-1,497
Cash flow
-14.5%
Cash-on-Cash Return
2.8%
Cap rate
0.8%
Rent to Value Ratio
Active
$349,000
1
bds
|
1
ba
|
791
sqft
|
built
2008
1750 N Bayshore Dr, Miami, FL 33132
$-2,107
Cash flow
-31.5%
Cash-on-Cash Return
-1.1%
Cap rate
0.7%
Rent to Value Ratio
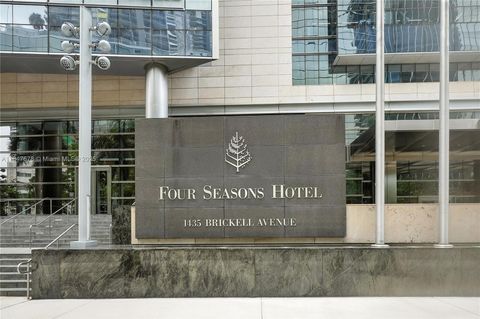
Active
$1,750,000
2
bds
|
3
ba
|
1,747
sqft
|
built
2003
1435 Brickell Ave, Miami, FL 33131
$-7,886
Cash flow
-23.5%
Cash-on-Cash Return
0.7%
Cap rate
0.5%
Rent to Value Ratio
Active
$285,500
2
bds
|
2
ba
|
1,123
sqft
|
built
1988
8660 SW 212th St, Cutler Bay, FL 33189
$-507
Cash flow
-9.3%
Cash-on-Cash Return
4.0%
Cap rate
0.8%
Rent to Value Ratio
Active
$775,000
2
bds
|
2
ba
|
1,274
sqft
|
built
1955
1621 SW 23rd Ave, Miami, FL 33145
$-1,384
Cash flow
-9.3%
Cash-on-Cash Return
4.0%
Cap rate
0.5%
Rent to Value Ratio
Active
$315,000
3
bds
|
2
ba
|
1,442
sqft
|
built
1969
8500 SW 109th Ave, Miami, FL 33173
$-942
Cash flow
-15.6%
Cash-on-Cash Return
2.6%
Cap rate
0.9%
Rent to Value Ratio
Active
$24,900,000
6
bds
|
7
ba
|
5,715
sqft
|
built
2024
4241 Palm Ln, Miami, FL 33137
$-134,073
Cash flow
-28.1%
Cash-on-Cash Return
-0.3%
Cap rate
0.0%
Rent to Value Ratio
Active
$694,000
2
bds
|
2
ba
|
1,086
sqft
|
built
2009
7928 East Dr, North Bay Village, FL 33141
$-2,672
Cash flow
-20.1%
Cash-on-Cash Return
1.5%
Cap rate
0.6%
Rent to Value Ratio
Active
$220,000
1
bds
|
1
ba
|
672
sqft
|
built
1972
7160 Fairway Dr, Miami Lakes, FL 33014
$-353
Cash flow
-8.4%
Cash-on-Cash Return
4.2%
Cap rate
0.9%
Rent to Value Ratio
Active
$1,849,000
2
bds
|
3
ba
|
2,084
sqft
|
built
2010
15811 Collins Ave, North Miami Beach, FL 33160
$-8,370
Cash flow
-23.6%
Cash-on-Cash Return
0.7%
Cap rate
0.4%
Rent to Value Ratio
Active
$293,900
3
bds
|
2
ba
|
1,151
sqft
|
built
2016
134 SE 28th Ter, Homestead, FL 33033
$-897
Cash flow
-15.9%
Cash-on-Cash Return
2.5%
Cap rate
0.8%
Rent to Value Ratio

Active
$539,000
3
bds
|
2
ba
|
1,134
sqft
|
built
1979
13821 SW 42nd Ter, Miami, FL 33175
$-895
Cash flow
-8.7%
Cash-on-Cash Return
4.2%
Cap rate
0.6%
Rent to Value Ratio

Active
$635,000
3
bds
|
2
ba
|
1,709
sqft
|
built
1979
16402 SW 111th Ave, Miami, FL 33157
$-1,188
Cash flow
-9.8%
Cash-on-Cash Return
3.9%
Cap rate
0.6%
Rent to Value Ratio
Active
$630,000
4
bds
|
2
ba
|
1,523
sqft
|
built
1963
560 NE 161st St, Miami, FL 33162
$-1,152
Cash flow
-9.5%
Cash-on-Cash Return
4.0%
Cap rate
0.6%
Rent to Value Ratio
Active
$829,000
2
bds
|
2
ba
|
1,603
sqft
|
built
1975
100 Bayview Dr, Sunny Isles Beach, FL 33160
$-2,340
Cash flow
-14.7%
Cash-on-Cash Return
2.8%
Cap rate
0.7%
Rent to Value Ratio

Active
$265,000
1
bds
|
1
ba
|
590
sqft
|
built
1925
1200 Euclid Ave, Miami Beach, FL 33139
$-908
Cash flow
-17.9%
Cash-on-Cash Return
2.0%
Cap rate
0.8%
Rent to Value Ratio

Active
$1,500,000
4
bds
|
4
ba
|
2,013
sqft
|
built
1950
18200 SW 296th St, Homestead, FL 33030
$-4,816
Cash flow
-16.8%
Cash-on-Cash Return
2.3%
Cap rate
0.4%
Rent to Value Ratio
Active
$690,000
1
bds
|
2
ba
|
1,018
sqft
|
built
2019
851 NE 1st Ave, Miami, FL 33132
$-3,811
Cash flow
-28.8%
Cash-on-Cash Return
-0.5%
Cap rate
0.6%
Rent to Value Ratio
Active
$205,000
1
bds
|
1
ba
|
608
sqft
|
built
1974
8950 NE 8th Ave, Miami, FL 33138
$-630
Cash flow
-16.0%
Cash-on-Cash Return
2.5%
Cap rate
0.8%
Rent to Value Ratio

Active
$335,000
2
bds
|
2
ba
|
1,300
sqft
|
built
1971
2780 NE 183rd St, Aventura, FL 33160
$-1,575
Cash flow
-24.5%
Cash-on-Cash Return
0.5%
Cap rate
0.8%
Rent to Value Ratio