Miami Dade County Investment Properties for Sale
Browse homes for sale and investment properties in Miami Dade County. Refine your search by price, property type, or more.
Best cash flowing properties in Miami Dade County
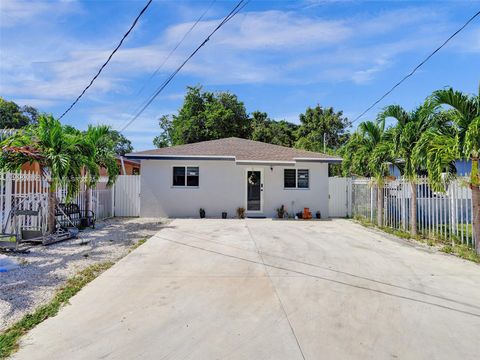
Active
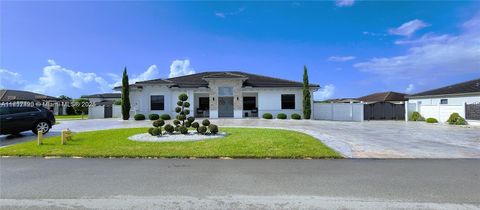
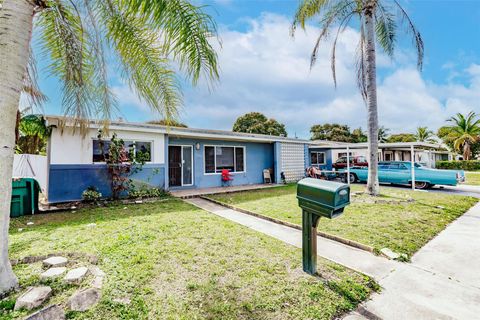
$530,000
3
bds
|
2
ba
|
1,804
sqft
|
built
1957
1131 NW 182nd St, Miami Gardens, FL 33169
$-418
Cash flow
-4.1%
Cash-on-Cash Return
5.2%
Cap rate
0.8%
Rent to Value Ratio
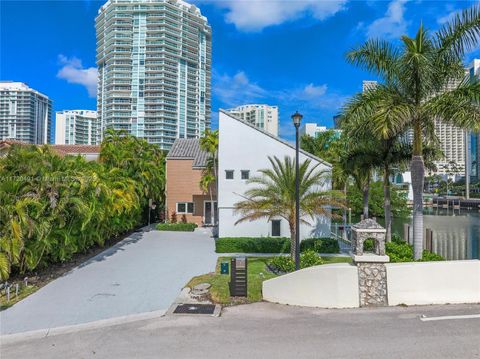
Active
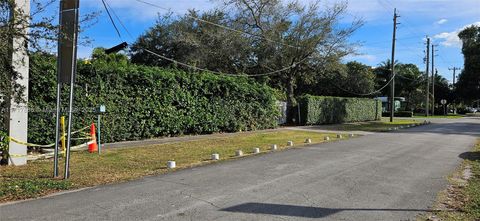
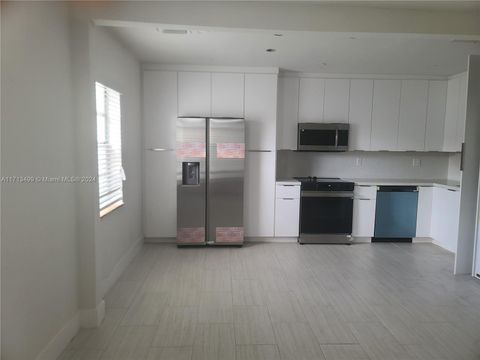
$509,999
3
bds
|
1
ba
|
1,006
sqft
|
built
1957
2100 NE Miami Gardens Dr, North Miami Beach, FL 33179
$-557
Cash flow
-5.7%
Cash-on-Cash Return
4.8%
Cap rate
0.6%
Rent to Value Ratio
3,463 out of 3,705 properties for sale in Miami Dade County
Limited Results Shown
Create a free account, or log in to reveal all property listings and enjoy the complete experience.
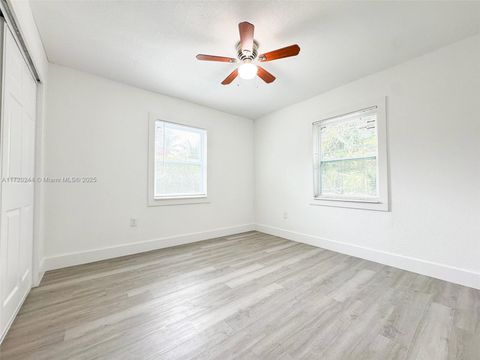
Active
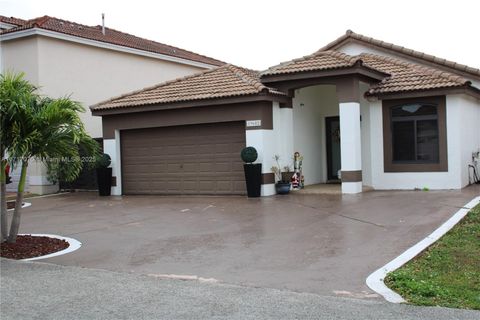
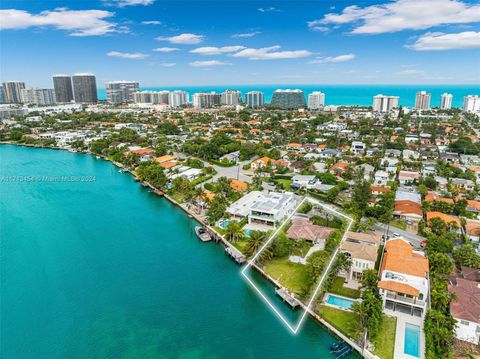
$725,000
4
bds
|
3
ba
|
1,791
sqft
|
built
1970
3740 W 5th Ct, Hialeah, FL 33012
$-1,399
Cash flow
-10.1%
Cash-on-Cash Return
3.8%
Cap rate
0.5%
Rent to Value Ratio

Active
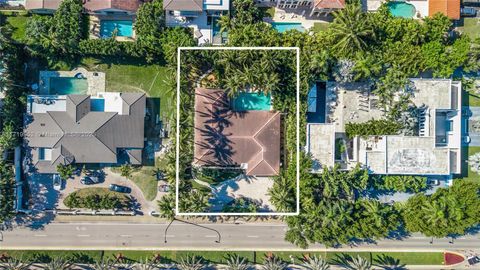
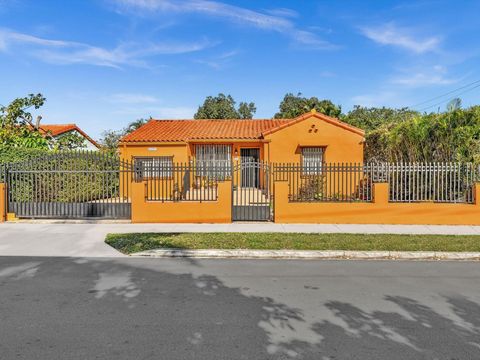
$6,900,000
6
bds
|
6
ba
|
6,353
sqft
|
built
1999
11200 SW 60th Ave, Pinecrest, FL 33156
$-36,627
Cash flow
-27.7%
Cash-on-Cash Return
-0.2%
Cap rate
0.1%
Rent to Value Ratio
Active
$1,785,000
5
bds
|
7
ba
|
4,287
sqft
|
built
2016
8271 NW 34th Dr, Doral, FL 33122
$-3,865
Cash flow
-11.3%
Cash-on-Cash Return
3.5%
Cap rate
0.6%
Rent to Value Ratio
Active
$1,899,000
4
bds
|
3
ba
|
2,783
sqft
|
built
1997
13550 SW 82nd Ave, Pinecrest, FL 33156
$-4,442
Cash flow
-12.2%
Cash-on-Cash Return
3.3%
Cap rate
0.5%
Rent to Value Ratio

Active
$1,499,000
2
bds
|
2
ba
|
1,600
sqft
|
built
1950
9149 Dickens Ave, Surfside, FL 33154
$-3,540
Cash flow
-12.3%
Cash-on-Cash Return
3.3%
Cap rate
0.4%
Rent to Value Ratio
Active
$6,950,000
6
bds
|
6
ba
|
6,435
sqft
|
built
1989
322 Costa Brava Ct, Coral Gables, FL 33143
$-37,202
Cash flow
-27.9%
Cash-on-Cash Return
-0.3%
Cap rate
0.1%
Rent to Value Ratio
Active
$1,600,000
3
bds
|
3
ba
|
2,142
sqft
|
built
1957
7620 SW 136th St, Miami, FL 33156
$-3,965
Cash flow
-12.9%
Cash-on-Cash Return
3.2%
Cap rate
0.5%
Rent to Value Ratio
Active
$4,497,000
5
bds
|
5
ba
|
3,432
sqft
|
built
1926
1033 Hardee Rd, Coral Gables, FL 33146
$-19,924
Cash flow
-23.1%
Cash-on-Cash Return
0.8%
Cap rate
0.2%
Rent to Value Ratio
Active
$545,000
4
bds
|
2
ba
|
1,500
sqft
|
built
2021
1125 NW 58th St, Miami, FL 33127
$-1,103
Cash flow
-10.6%
Cash-on-Cash Return
3.7%
Cap rate
0.7%
Rent to Value Ratio
Active
$3,850,000
4
bds
|
4
ba
|
3,147
sqft
|
built
1972
570 Ocean Blvd, Golden Beach, FL 33160
$-15,119
Cash flow
-20.5%
Cash-on-Cash Return
1.4%
Cap rate
0.2%
Rent to Value Ratio
Active
$4,950,000
4
bds
|
3
ba
|
2,991
sqft
|
built
1984
201 Atlantic Ave, Sunny Isles Beach, FL 33160
$-24,250
Cash flow
-25.6%
Cash-on-Cash Return
0.3%
Cap rate
0.2%
Rent to Value Ratio
Active
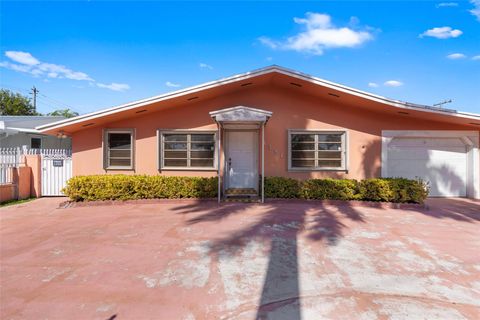
$567,900
4
bds
|
3
ba
|
1,544
sqft
|
built
1949
1240 NW 122nd St, North Miami, FL 33167
$-1,099
Cash flow
-10.1%
Cash-on-Cash Return
3.8%
Cap rate
0.6%
Rent to Value Ratio
Active
$749,000
4
bds
|
3
ba
|
1,967
sqft
|
built
1984
20333 SW 122nd Pl, Miami, FL 33177
$-1,687
Cash flow
-11.8%
Cash-on-Cash Return
3.4%
Cap rate
0.6%
Rent to Value Ratio
Active
$4,695,000
5
bds
|
5
ba
|
5,039
sqft
|
built
1982
6424 SW 109th St, Pinecrest, FL 33156
$-19,835
Cash flow
-22.0%
Cash-on-Cash Return
1.1%
Cap rate
0.2%
Rent to Value Ratio
Active
$531,000
4
bds
|
2
ba
|
1,498
sqft
|
built
1973
15321 SW 308th St, Homestead, FL 33033
$-1,239
Cash flow
-12.2%
Cash-on-Cash Return
3.3%
Cap rate
0.5%
Rent to Value Ratio
Active
$636,000
4
bds
|
2
ba
|
1,580
sqft
|
built
1956
1180 NE 200th Ter, Miami, FL 33179
$-849
Cash flow
-7.0%
Cash-on-Cash Return
4.5%
Cap rate
0.7%
Rent to Value Ratio
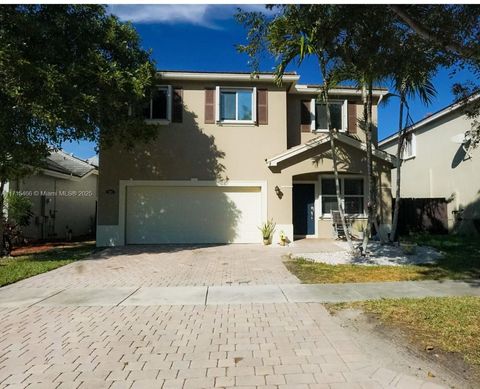
Active
$924,900
4
bds
|
4
ba
|
2,804
sqft
|
built
2018
21350 SW 132nd Ct, Miami, FL 33177
$-1,940
Cash flow
-10.9%
Cash-on-Cash Return
3.6%
Cap rate
0.6%
Rent to Value Ratio
Active
$995,000
3
bds
|
2
ba
|
1,568
sqft
|
built
1936
11809 NE 1st Ave, Miami, FL 33161
$-3,823
Cash flow
-20.0%
Cash-on-Cash Return
1.5%
Cap rate
0.3%
Rent to Value Ratio
Active
$620,000
4
bds
|
2
ba
|
1,654
sqft
|
built
1991
19602 NW 83rd Ct, Hialeah, FL 33015
$-1,513
Cash flow
-12.7%
Cash-on-Cash Return
3.2%
Cap rate
0.6%
Rent to Value Ratio
Active
$755,000
3
bds
|
2
ba
|
2,386
sqft
|
built
1940
4381 SW 5th Ter, Coral Gables, FL 33134
$-1,609
Cash flow
-11.1%
Cash-on-Cash Return
3.6%
Cap rate
0.5%
Rent to Value Ratio

Active
$799,000
4
bds
|
3
ba
|
2,153
sqft
|
built
1986
14461 SW 152nd Ct, Miami, FL 33196
$-1,609
Cash flow
-10.5%
Cash-on-Cash Return
3.7%
Cap rate
0.6%
Rent to Value Ratio
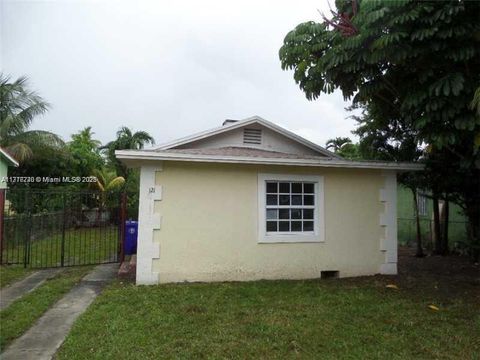
Active
$528,000
2
bds
|
1
ba
|
824
sqft
|
built
1924
121 NW 68th St, Miami, FL 33150
$-1,014
Cash flow
-10.0%
Cash-on-Cash Return
3.8%
Cap rate
0.5%
Rent to Value Ratio
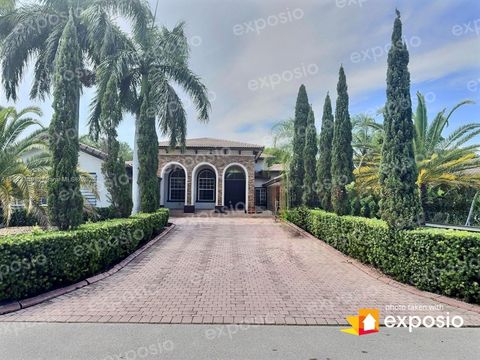
Active
$709,000
5
bds
|
3
ba
|
2,835
sqft
|
built
2012
3455 NE 1st St, Homestead, FL 33033
$-1,432
Cash flow
-10.5%
Cash-on-Cash Return
3.7%
Cap rate
0.6%
Rent to Value Ratio
Active
$799,900
5
bds
|
2
ba
|
0
sqft
|
built
1959
8341 SW 12th Ter, Miami, FL 33144
$-1,066
Cash flow
-7.0%
Cash-on-Cash Return
4.5%
Cap rate
0.6%
Rent to Value Ratio
Active
$1,220,000
5
bds
|
4
ba
|
3,385
sqft
|
built
2006
12981 SW 197th St, Miami, FL 33177
$-3,092
Cash flow
-13.2%
Cash-on-Cash Return
3.1%
Cap rate
0.5%
Rent to Value Ratio
Active
$550,000
4
bds
|
3
ba
|
1,964
sqft
|
built
1960
1250 NW 196th Ter, Miami Gardens, FL 33169
$-1,001
Cash flow
-9.5%
Cash-on-Cash Return
4.0%
Cap rate
0.6%
Rent to Value Ratio
Active
$1,079,000
7
bds
|
3
ba
|
2,188
sqft
|
built
1948
1041 NW 32nd Pl, Miami, FL 33125
$-3,891
Cash flow
-18.8%
Cash-on-Cash Return
1.8%
Cap rate
0.3%
Rent to Value Ratio
Active
$12,750,000
4
bds
|
4
ba
|
2,811
sqft
|
built
1953
9250 Bay Dr, Surfside, FL 33154
$-70,707
Cash flow
-28.9%
Cash-on-Cash Return
-0.5%
Cap rate
0.1%
Rent to Value Ratio
Active
$749,000
3
bds
|
2
ba
|
1,092
sqft
|
built
1938
2347 SW 18th St, Miami, FL 33145
$-1,440
Cash flow
-10.0%
Cash-on-Cash Return
3.8%
Cap rate
0.5%
Rent to Value Ratio
Active
$22,475,000
8
bds
|
10
ba
|
9,094
sqft
|
built
2011
288 S Coconut Ln, Miami Beach, FL 33139
$-135,379
Cash flow
-31.4%
Cash-on-Cash Return
-1.1%
Cap rate
0.0%
Rent to Value Ratio
Active
$850,000
2
bds
|
3
ba
|
2,344
sqft
|
built
1948
501 E 8th St, Hialeah, FL 33010
$-2,360
Cash flow
-14.5%
Cash-on-Cash Return
2.8%
Cap rate
0.5%
Rent to Value Ratio
Active
$952,000
4
bds
|
3
ba
|
1,689
sqft
|
built
1971
725 E 53rd St, Hialeah, FL 33013
$-1,389
Cash flow
-7.6%
Cash-on-Cash Return
4.4%
Cap rate
0.6%
Rent to Value Ratio
Active
$550,000
3
bds
|
2
ba
|
1,177
sqft
|
built
1974
14350 SW 109th Ave, Miami, FL 33176
$-957
Cash flow
-9.1%
Cash-on-Cash Return
4.1%
Cap rate
0.5%
Rent to Value Ratio
Active
$895,000
3
bds
|
2
ba
|
1,470
sqft
|
built
1964
4241 Red Rd, Miami, FL 33155
$-1,808
Cash flow
-10.5%
Cash-on-Cash Return
3.7%
Cap rate
0.5%
Rent to Value Ratio
Active
$469,000
3
bds
|
3
ba
|
3,366
sqft
|
built
2007
27025 SW 142nd Ave, Homestead, FL 33032
$-1,163
Cash flow
-12.9%
Cash-on-Cash Return
3.2%
Cap rate
0.7%
Rent to Value Ratio
Active
$3,250,000
4
bds
|
3
ba
|
0
sqft
|
built
1972
3351 NE 164th St, North Miami Beach, FL 33160
$-12,355
Cash flow
-19.8%
Cash-on-Cash Return
1.6%
Cap rate
0.3%
Rent to Value Ratio
Active
$729,900
2
bds
|
2
ba
|
891
sqft
|
built
1945
341 Ludlam Dr, Miami Springs, FL 33166
$-1,825
Cash flow
-13.0%
Cash-on-Cash Return
3.1%
Cap rate
0.5%
Rent to Value Ratio
Active
$495,000
4
bds
|
2
ba
|
1,308
sqft
|
built
1978
22125 SW 113th Pl, Goulds, FL 33170
$-975
Cash flow
-10.3%
Cash-on-Cash Return
3.8%
Cap rate
0.6%
Rent to Value Ratio