Miami Dade County Investment Properties for Sale
Browse homes for sale and investment properties in Miami Dade County. Refine your search by price, property type, or more.
Best cash flowing properties in Miami Dade County
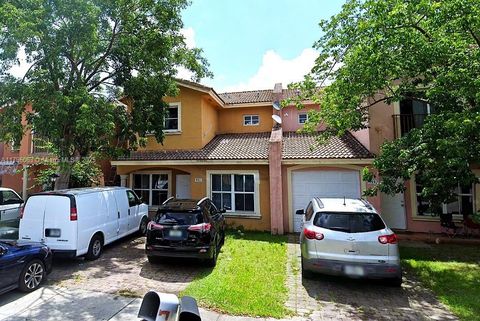
Active
$325,000
4
bds
|
3
ba
|
1,799
sqft
|
built
2007
981 SW 6th Ct, Florida City, FL 33034
$-145
Cash flow
-2.3%
Cash-on-Cash Return
5.6%
Cap rate
0.8%
Rent to Value Ratio

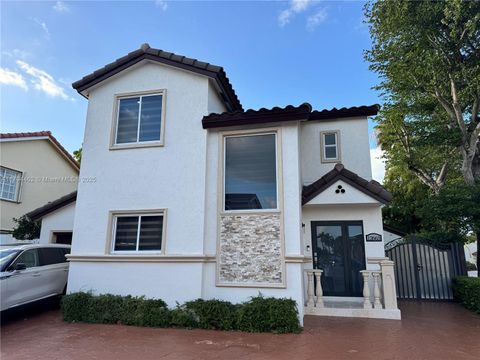
Active
$679,000
3
bds
|
3
ba
|
1,714
sqft
|
built
1990
3500 Mystic Pointe Dr, Aventura, FL 33180
$-179
Cash flow
-1.4%
Cash-on-Cash Return
5.8%
Cap rate
0.8%
Rent to Value Ratio
10,000 out of 11,974 properties for sale in Miami Dade County
Limited Results Shown
Create a free account, or log in to reveal all property listings and enjoy the complete experience.

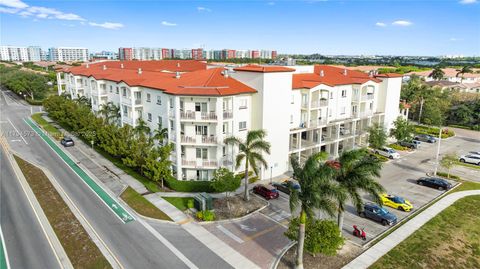
Active
$6,999,000
4
bds
|
5
ba
|
5,296
sqft
|
built
1935
3026 Flamingo Dr, Miami Beach, FL 33140
$-35,675
Cash flow
-26.6%
Cash-on-Cash Return
0.0%
Cap rate
0.1%
Rent to Value Ratio

Active
$3,375,000
3
bds
|
3
ba
|
2,214
sqft
|
built
2006
17875 Collins Ave, Sunny Isles Beach, FL 33160
$-17,985
Cash flow
-27.8%
Cash-on-Cash Return
-0.2%
Cap rate
0.3%
Rent to Value Ratio
Active
$579,000
3
bds
|
3
ba
|
1,690
sqft
|
built
1991
12663 NW 8th Way, Miami, FL 33182
$-880
Cash flow
-7.9%
Cash-on-Cash Return
4.3%
Cap rate
0.6%
Rent to Value Ratio

Active
$2,900,000
3
bds
|
3
ba
|
1,825
sqft
|
built
2008
465 Brickell Ave, Miami, FL 33131
$-12,161
Cash flow
-21.9%
Cash-on-Cash Return
1.1%
Cap rate
0.3%
Rent to Value Ratio

Active
$398,000
2
bds
|
2
ba
|
1,092
sqft
|
built
1957
9260 Bay Harbor Ter, Bay Harbor Islands, FL 33154
$-1,400
Cash flow
-18.4%
Cash-on-Cash Return
1.9%
Cap rate
0.7%
Rent to Value Ratio

Active
$749,000
1
bds
|
2
ba
|
667
sqft
|
built
2004
6515 Collins Ave, Miami Beach, FL 33141
$-2,324
Cash flow
-16.2%
Cash-on-Cash Return
2.4%
Cap rate
0.7%
Rent to Value Ratio

Active
$1,475,000
2
bds
|
3
ba
|
1,750
sqft
|
built
2017
17111 Biscayne Blvd, Aventura, FL 33160
$-5,878
Cash flow
-20.8%
Cash-on-Cash Return
1.4%
Cap rate
0.5%
Rent to Value Ratio

Active
$540,000
1
bds
|
2
ba
|
727
sqft
|
built
2016
1080 Brickell Ave, Miami, FL 33131
$-2,043
Cash flow
-19.7%
Cash-on-Cash Return
1.6%
Cap rate
0.7%
Rent to Value Ratio

Active
$755,000
2
bds
|
2
ba
|
1,299
sqft
|
built
1970
9511 Collins Ave, Surfside, FL 33154
$-2,713
Cash flow
-18.7%
Cash-on-Cash Return
1.8%
Cap rate
0.7%
Rent to Value Ratio

Active
$440,000
1
bds
|
2
ba
|
710
sqft
|
built
1981
1150 Collins Ave, Miami Beach, FL 33139
$-814
Cash flow
-9.7%
Cash-on-Cash Return
3.9%
Cap rate
0.6%
Rent to Value Ratio

Active
$685,000
3
bds
|
2
ba
|
1,783
sqft
|
built
1995
9511 SW 155th Ave, Miami, FL 33196
$-1,404
Cash flow
-10.7%
Cash-on-Cash Return
3.7%
Cap rate
0.5%
Rent to Value Ratio

Active
$425,000
1
bds
|
2
ba
|
750
sqft
|
built
1971
1228 West Ave, Miami Beach, FL 33139
$-1,071
Cash flow
-13.1%
Cash-on-Cash Return
3.1%
Cap rate
0.8%
Rent to Value Ratio

Active
$158,000
1
bds
|
2
ba
|
861
sqft
|
built
1968
11111 Biscayne Blvd, Miami, FL 33181
$-920
Cash flow
-30.4%
Cash-on-Cash Return
-0.8%
Cap rate
1.3%
Rent to Value Ratio

Active
$693,000
4
bds
|
2
ba
|
1,857
sqft
|
built
1998
6630 SW 159th Pl, Miami, FL 33193
$-1,447
Cash flow
-10.9%
Cash-on-Cash Return
3.6%
Cap rate
0.5%
Rent to Value Ratio

Active
$280,000
2
bds
|
2
ba
|
1,140
sqft
|
built
1968
1301 NE Miami Gardens Dr, Miami, FL 33179
$-647
Cash flow
-12.1%
Cash-on-Cash Return
3.4%
Cap rate
0.8%
Rent to Value Ratio

Active
$208,000
1
bds
|
1
ba
|
480
sqft
|
built
1925
842 Meridian Ave, Miami Beach, FL 33139
$-710
Cash flow
-17.8%
Cash-on-Cash Return
2.0%
Cap rate
0.9%
Rent to Value Ratio

Active
$1,700,000
2
bds
|
3
ba
|
1,137
sqft
|
built
2017
1451 Brickell Ave, Miami, FL 33131
$-7,343
Cash flow
-22.5%
Cash-on-Cash Return
1.0%
Cap rate
0.5%
Rent to Value Ratio

Active
$319,900
1
bds
|
1
ba
|
651
sqft
|
built
2007
133 NE 2nd Ave, Miami, FL 33132
$-901
Cash flow
-14.7%
Cash-on-Cash Return
2.8%
Cap rate
0.8%
Rent to Value Ratio

Active
$849,000
1
bds
|
2
ba
|
1,025
sqft
|
built
1970
1600 S Bayshore Ln, Miami, FL 33133
$-2,650
Cash flow
-16.3%
Cash-on-Cash Return
2.4%
Cap rate
0.7%
Rent to Value Ratio

Active
$331,000
1
bds
|
2
ba
|
850
sqft
|
built
1967
1075 93rd St, Bay Harbor Islands, FL 33154
$-1,111
Cash flow
-17.5%
Cash-on-Cash Return
2.1%
Cap rate
0.8%
Rent to Value Ratio

Active
$1,600,000
2
bds
|
2
ba
|
1,180
sqft
|
built
1926
2301 Collins Ave, Miami Beach, FL 33139
$-7,251
Cash flow
-23.6%
Cash-on-Cash Return
0.7%
Cap rate
0.4%
Rent to Value Ratio

Active
$559,000
3
bds
|
2
ba
|
1,544
sqft
|
built
2004
12912 NE 7th Ave, North Miami, FL 33161
$-858
Cash flow
-8.0%
Cash-on-Cash Return
4.3%
Cap rate
0.6%
Rent to Value Ratio

Active
$890,000
4
bds
|
2
ba
|
2,634
sqft
|
built
1989
8701 SW 191st St, Cutler Bay, FL 33157
$-2,822
Cash flow
-16.5%
Cash-on-Cash Return
2.3%
Cap rate
0.5%
Rent to Value Ratio

Active
$869,000
2
bds
|
2
ba
|
1,262
sqft
|
built
2001
1330 West Ave, Miami Beach, FL 33139
$-1,081
Cash flow
-6.5%
Cash-on-Cash Return
4.7%
Cap rate
0.7%
Rent to Value Ratio

Active
$1,540,000
4
bds
|
4
ba
|
2,484
sqft
|
built
1980
1846 NE 211th Ln, North Miami Beach, FL 33179
$-2,654
Cash flow
-9.0%
Cash-on-Cash Return
4.1%
Cap rate
0.6%
Rent to Value Ratio

Active
$335,000
2
bds
|
2
ba
|
1,067
sqft
|
built
1981
6880 Abbott Ave, Miami Beach, FL 33141
$-954
Cash flow
-14.9%
Cash-on-Cash Return
2.7%
Cap rate
0.7%
Rent to Value Ratio

Active
$355,000
2
bds
|
2
ba
|
1,220
sqft
|
built
1974
2801 NE 183rd St, Aventura, FL 33160
$-1,183
Cash flow
-17.4%
Cash-on-Cash Return
2.1%
Cap rate
0.8%
Rent to Value Ratio

Active
$340,000
3
bds
|
3
ba
|
1,523
sqft
|
built
2007
3064 SE 1st Dr, Homestead, FL 33033
$-572
Cash flow
-8.8%
Cash-on-Cash Return
4.1%
Cap rate
0.8%
Rent to Value Ratio

Active
$2,399,000
4
bds
|
3
ba
|
2,422
sqft
|
built
2025
6747 SW 77th Ter, South Miami, FL 33143
$-8,807
Cash flow
-19.2%
Cash-on-Cash Return
1.7%
Cap rate
0.3%
Rent to Value Ratio

Active
$3,250,000
3
bds
|
4
ba
|
1,956
sqft
|
built
2009
17121 Collins Ave, Sunny Isles Beach, FL 33160
$-15,590
Cash flow
-25.0%
Cash-on-Cash Return
0.4%
Cap rate
0.3%
Rent to Value Ratio
Active
$415,500
2
bds
|
2
ba
|
1,183
sqft
|
built
2022
10950 NW 82nd St, Doral, FL 33178
$-1,749
Cash flow
-22.0%
Cash-on-Cash Return
1.1%
Cap rate
0.6%
Rent to Value Ratio

Active
$415,000
3
bds
|
2
ba
|
1,340
sqft
|
built
2011
10012 NW 7th St, Miami, FL 33172
$-1,371
Cash flow
-17.2%
Cash-on-Cash Return
2.2%
Cap rate
0.7%
Rent to Value Ratio

Active
$195,000
1
bds
|
2
ba
|
1,066
sqft
|
built
1974
2851 NE 183rd St, Aventura, FL 33160
$-486
Cash flow
-13.0%
Cash-on-Cash Return
3.2%
Cap rate
1.2%
Rent to Value Ratio

Active
$695,000
2
bds
|
2
ba
|
1,169
sqft
|
built
2005
325 S Biscayne Blvd, Miami, FL 33131
$-3,395
Cash flow
-25.5%
Cash-on-Cash Return
0.3%
Cap rate
0.5%
Rent to Value Ratio

Active
$223,000
0
bds
|
1
ba
|
436
sqft
|
built
1939
820 Euclid Ave, Miami Beach, FL 33139
$-875
Cash flow
-20.5%
Cash-on-Cash Return
1.4%
Cap rate
0.7%
Rent to Value Ratio

Active
$855,000
2
bds
|
2
ba
|
1,303
sqft
|
built
2002
801 Brickell Key Blvd, Miami, FL 33131
$-2,508
Cash flow
-15.3%
Cash-on-Cash Return
2.6%
Cap rate
0.7%
Rent to Value Ratio

Active
$645,000
3
bds
|
3
ba
|
1,840
sqft
|
built
1990
1000 E Island Blvd, Aventura, FL 33160
$-4,003
Cash flow
-32.4%
Cash-on-Cash Return
-1.3%
Cap rate
0.8%
Rent to Value Ratio

Active
$635,000
6
bds
|
4
ba
|
2,980
sqft
|
built
2018
4190 NE 20th St, Homestead, FL 33033
$-1,294
Cash flow
-10.6%
Cash-on-Cash Return
3.7%
Cap rate
0.6%
Rent to Value Ratio