Miami Dade County Investment Properties for Sale
Browse homes for sale and investment properties in Miami Dade County. Refine your search by price, property type, or more.
Best cash flowing properties in Miami Dade County
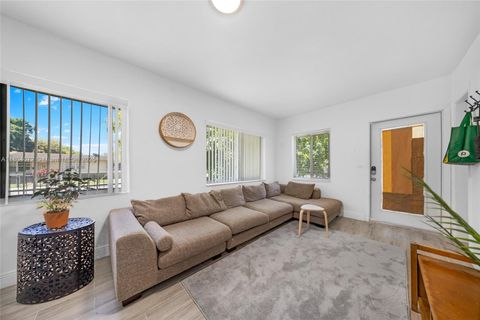
Active
$109,000
1
bds
|
1
ba
|
465
sqft
|
built
1930
1021 NW 3rd St, Miami, FL 33128
$167
Cash flow
8.0%
Cash-on-Cash Return
8.0%
Cap rate
1.5%
Rent to Value Ratio
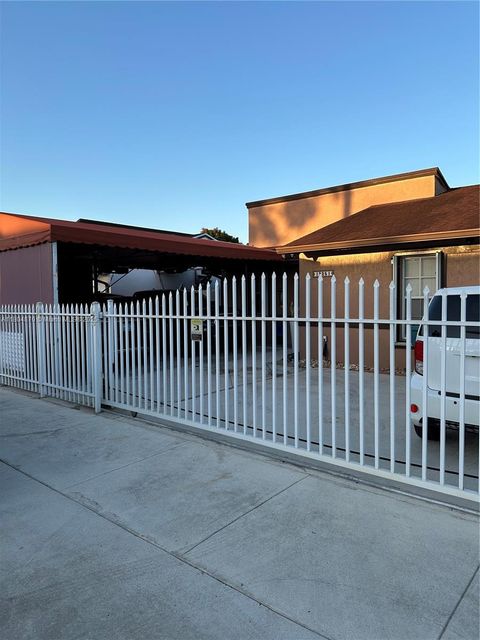
Active
$250,000
2
bds
|
2
ba
|
1,096
sqft
|
built
1974
1750 W 46th St, Hialeah, FL 33012
$-72
Cash flow
-1.5%
Cash-on-Cash Return
5.8%
Cap rate
0.9%
Rent to Value Ratio
10,000 out of 13,770 properties for sale in Miami Dade County
Limited Results Shown
Create a free account, or log in to reveal all property listings and enjoy the complete experience.
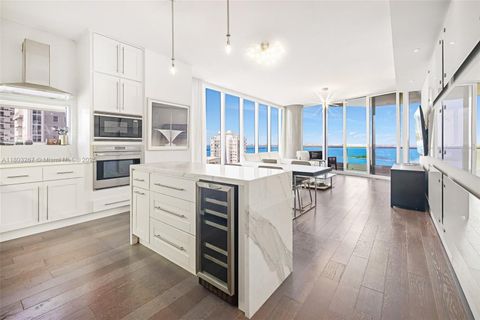
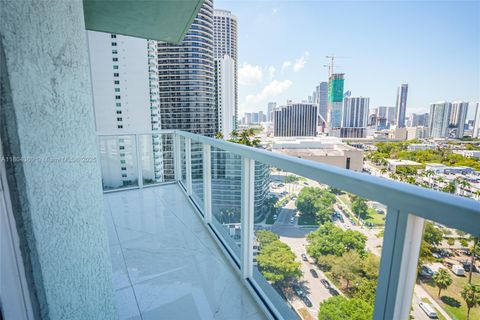
Active
$549,000
1
bds
|
2
ba
|
804
sqft
|
built
1969
150 SE 25th Rd, Miami, FL 33129
$-2,116
Cash flow
-20.1%
Cash-on-Cash Return
1.5%
Cap rate
0.5%
Rent to Value Ratio
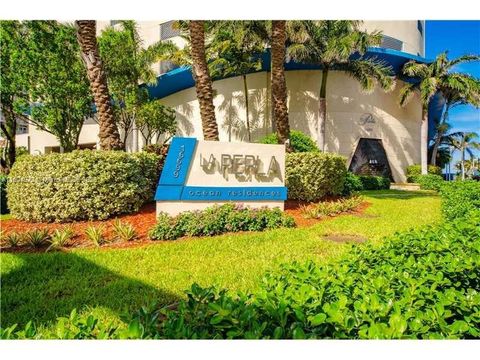
Active
$620,000
1
bds
|
2
ba
|
966
sqft
|
built
2005
2001 Meridian Ave, Miami Beach, FL 33139
$-1,737
Cash flow
-14.6%
Cash-on-Cash Return
2.8%
Cap rate
0.8%
Rent to Value Ratio
Active
$1,699,000
2
bds
|
3
ba
|
1,680
sqft
|
built
1999
18671 Collins Ave, Sunny Isles Beach, FL 33160
$-6,622
Cash flow
-20.3%
Cash-on-Cash Return
1.5%
Cap rate
0.4%
Rent to Value Ratio
Active
$444,000
3
bds
|
3
ba
|
1,801
sqft
|
built
2007
14951 Royal Oaks Ln, North Miami, FL 33181
$-1,645
Cash flow
-19.3%
Cash-on-Cash Return
1.7%
Cap rate
0.9%
Rent to Value Ratio
Active
$1,250,000
4
bds
|
2
ba
|
2,011
sqft
|
built
1997
11351 NW 64th Ter, Doral, FL 33178
$-4,780
Cash flow
-20.0%
Cash-on-Cash Return
1.6%
Cap rate
0.4%
Rent to Value Ratio
Active
$578,000
4
bds
|
3
ba
|
1,638
sqft
|
built
1949
9221 NW 15th Ave, Miami, FL 33147
$-128
Cash flow
-1.2%
Cash-on-Cash Return
5.9%
Cap rate
0.8%
Rent to Value Ratio
Active
$614,900
3
bds
|
2
ba
|
1,377
sqft
|
built
1988
6950 NW 168th St, Hialeah, FL 33015
$-714
Cash flow
-6.1%
Cash-on-Cash Return
4.8%
Cap rate
0.7%
Rent to Value Ratio
Active
$239,400
1
bds
|
2
ba
|
735
sqft
|
built
1973
5731 NW 37th St, Virginia Gardens, FL 33166
$-618
Cash flow
-13.5%
Cash-on-Cash Return
3.0%
Cap rate
0.8%
Rent to Value Ratio
Active
$875,000
3
bds
|
3
ba
|
1,660
sqft
|
built
1973
3553 NE 171st St, North Miami Beach, FL 33160
$-2,866
Cash flow
-17.1%
Cash-on-Cash Return
2.2%
Cap rate
0.6%
Rent to Value Ratio
Active
$4,200,000
4
bds
|
6
ba
|
3,796
sqft
|
built
2023
700 NE 26th Ter, Miami, FL 33137
$-19,305
Cash flow
-24.0%
Cash-on-Cash Return
0.6%
Cap rate
0.2%
Rent to Value Ratio
Active
$307,000
1
bds
|
1
ba
|
603
sqft
|
built
1951
111 E Flagler St, Miami, FL 33131
$-836
Cash flow
-14.2%
Cash-on-Cash Return
2.9%
Cap rate
0.7%
Rent to Value Ratio
Active
$590,000
1
bds
|
2
ba
|
662
sqft
|
built
2018
501 NE 31st St, Miami, FL 33137
$-2,360
Cash flow
-20.9%
Cash-on-Cash Return
1.3%
Cap rate
0.5%
Rent to Value Ratio
Active
$5,800,000
4
bds
|
4
ba
|
3,192
sqft
|
built
1986
2213 Fisher Island Dr, Miami Beach, FL 33109
$-30,363
Cash flow
-27.3%
Cash-on-Cash Return
-0.1%
Cap rate
0.1%
Rent to Value Ratio
Active
$564,900
3
bds
|
3
ba
|
1,511
sqft
|
built
2008
8691 NW 112th Ct, Doral, FL 33178
$-1,501
Cash flow
-13.9%
Cash-on-Cash Return
3.0%
Cap rate
0.6%
Rent to Value Ratio
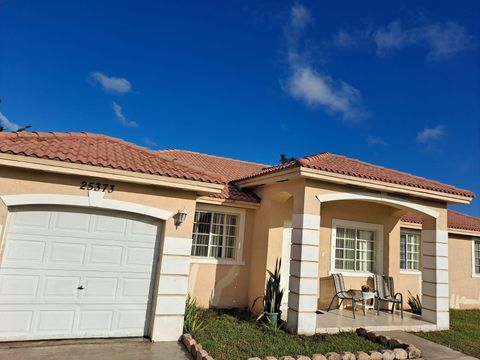
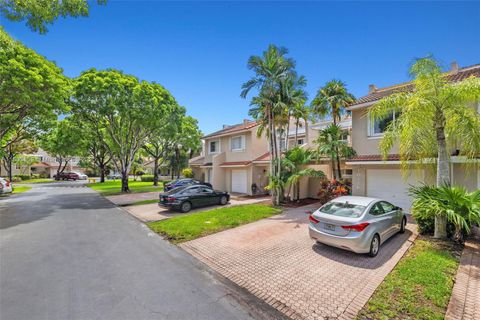
Active
$579,000
3
bds
|
2
ba
|
1,650
sqft
|
built
2004
25373 SW 122nd Pl, Homestead, FL 33032
$-1,285
Cash flow
-11.6%
Cash-on-Cash Return
3.5%
Cap rate
0.6%
Rent to Value Ratio
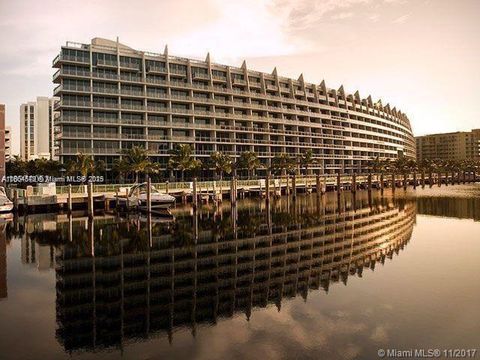
Active
$650,000
1
bds
|
2
ba
|
1,214
sqft
|
built
2008
2950 NE 188th St, Aventura, FL 33180
$-2,890
Cash flow
-23.2%
Cash-on-Cash Return
0.8%
Cap rate
0.6%
Rent to Value Ratio
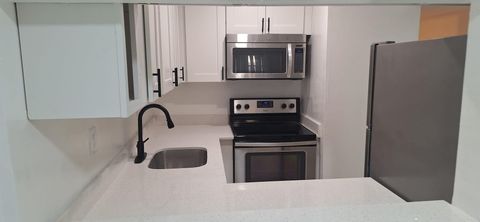
Active
$245,000
2
bds
|
1
ba
|
732
sqft
|
built
1973
1305 W 46th St, Hialeah, FL 33012
$-343
Cash flow
-7.3%
Cash-on-Cash Return
4.5%
Cap rate
0.8%
Rent to Value Ratio
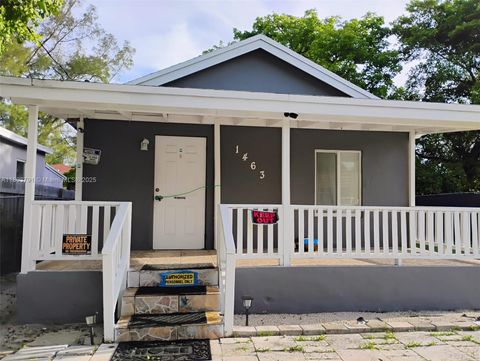
Active
$494,000
3
bds
|
1
ba
|
869
sqft
|
built
1945
1463 NW 70th St, Miami, FL 33147
$-956
Cash flow
-10.1%
Cash-on-Cash Return
3.8%
Cap rate
0.5%
Rent to Value Ratio
Active
$710,000
2
bds
|
3
ba
|
1,824
sqft
|
built
2006
3330 NE 190th St, Aventura, FL 33180
$-3,301
Cash flow
-24.3%
Cash-on-Cash Return
0.6%
Cap rate
0.6%
Rent to Value Ratio
Active
$690,000
2
bds
|
2
ba
|
1,153
sqft
|
built
2007
665 NE 25th St, Miami, FL 33137
$-3,041
Cash flow
-23.0%
Cash-on-Cash Return
0.9%
Cap rate
0.6%
Rent to Value Ratio
Active
$479,000
2
bds
|
2
ba
|
1,600
sqft
|
built
1981
2039 NE 172nd St, North Miami Beach, FL 33162
$-1,339
Cash flow
-14.6%
Cash-on-Cash Return
2.8%
Cap rate
0.5%
Rent to Value Ratio
Active
$888,000
3
bds
|
0
ba
|
1,296
sqft
|
built
1954
7415 SW 23rd St, Miami, FL 33155
$-3,729
Cash flow
-21.9%
Cash-on-Cash Return
1.1%
Cap rate
0.3%
Rent to Value Ratio
Active
$800,000
4
bds
|
3
ba
|
2,587
sqft
|
built
2015
15282 SW 173rd Ln, Miami, FL 33187
$-2,357
Cash flow
-15.4%
Cash-on-Cash Return
2.6%
Cap rate
0.5%
Rent to Value Ratio
Active
$530,000
3
bds
|
2
ba
|
1,358
sqft
|
built
2005
20501 NW 18th Ave, Miami Gardens, FL 33056
$-1,227
Cash flow
-12.1%
Cash-on-Cash Return
3.4%
Cap rate
0.6%
Rent to Value Ratio
Active
$395,000
3
bds
|
3
ba
|
1,328
sqft
|
built
2023
23517 SW 127th Pl, Homestead, FL 33032
$-845
Cash flow
-11.2%
Cash-on-Cash Return
3.6%
Cap rate
0.7%
Rent to Value Ratio
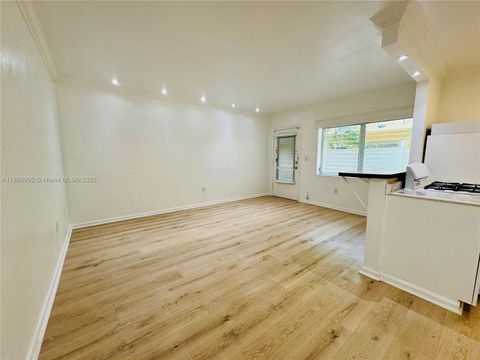
Active
$490,000
2
bds
|
1
ba
|
1,477
sqft
|
built
1947
625 NE 130th St, North Miami, FL 33161
$-498
Cash flow
-5.3%
Cash-on-Cash Return
4.9%
Cap rate
0.6%
Rent to Value Ratio
Active
$1,555,000
2
bds
|
3
ba
|
1,588
sqft
|
built
2010
2020 N Bayshore Dr, Miami, FL 33137
$-6,887
Cash flow
-23.1%
Cash-on-Cash Return
0.8%
Cap rate
0.5%
Rent to Value Ratio
Active
$620,000
3
bds
|
3
ba
|
1,898
sqft
|
built
1994
10226 NW 52nd Ln, Doral, FL 33178
$-1,400
Cash flow
-11.8%
Cash-on-Cash Return
3.4%
Cap rate
0.6%
Rent to Value Ratio
Active
$369,000
1
bds
|
1
ba
|
620
sqft
|
built
1960
65 Washington Ave, Miami Beach, FL 33139
$-1,548
Cash flow
-21.9%
Cash-on-Cash Return
1.1%
Cap rate
0.5%
Rent to Value Ratio
Active
$450,000
2
bds
|
2
ba
|
960
sqft
|
built
1983
1775 Washington Ave, Miami Beach, FL 33139
$-2,009
Cash flow
-23.3%
Cash-on-Cash Return
0.8%
Cap rate
0.7%
Rent to Value Ratio
Active
$615,000
2
bds
|
0
ba
|
1,290
sqft
|
built
1948
1515 NW 49th St, Miami, FL 33142
$-1,959
Cash flow
-16.6%
Cash-on-Cash Return
2.3%
Cap rate
0.4%
Rent to Value Ratio

Active
$990,900
3
bds
|
2
ba
|
1,610
sqft
|
built
1956
20130 NE 25th Ct, Miami, FL 33180
$-2,219
Cash flow
-11.7%
Cash-on-Cash Return
3.5%
Cap rate
0.5%
Rent to Value Ratio
Active
$554,500
3
bds
|
2
ba
|
1,306
sqft
|
built
1985
19251 SW 118th Ct, Miami, FL 33177
$-963
Cash flow
-9.1%
Cash-on-Cash Return
4.1%
Cap rate
0.5%
Rent to Value Ratio
Active
$700,000
2
bds
|
3
ba
|
1,162
sqft
|
built
2008
1900 N Bayshore Dr, Miami, FL 33132
$-2,403
Cash flow
-17.9%
Cash-on-Cash Return
2.0%
Cap rate
0.6%
Rent to Value Ratio
Active
$1,450,000
3
bds
|
3
ba
|
1,623
sqft
|
built
2006
16699 Collins Ave, Sunny Isles Beach, FL 33160
$-8,249
Cash flow
-29.7%
Cash-on-Cash Return
-0.7%
Cap rate
0.4%
Rent to Value Ratio
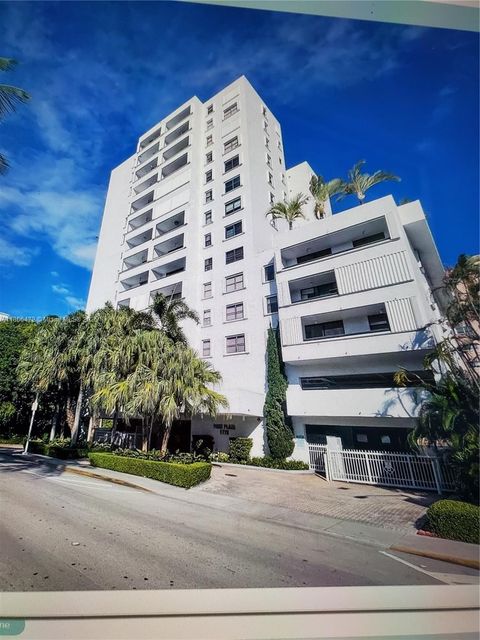
Active
$895,000
1
bds
|
2
ba
|
836
sqft
|
built
2019
1000 Brickell Plz, Miami, FL 33131
$-3,699
Cash flow
-21.6%
Cash-on-Cash Return
1.2%
Cap rate
0.5%
Rent to Value Ratio
Active
$1,095,000
2
bds
|
2
ba
|
0
sqft
|
built
1982
2555 Collins Ave, Miami Beach, FL 33140
$-4,484
Cash flow
-21.4%
Cash-on-Cash Return
1.2%
Cap rate
0.5%
Rent to Value Ratio
Active
$819,000
4
bds
|
2
ba
|
1,954
sqft
|
built
1959
10330 SW 51st St, Miami, FL 33165
$-866
Cash flow
-5.5%
Cash-on-Cash Return
4.9%
Cap rate
0.8%
Rent to Value Ratio