Miami Dade County Investment Properties for Sale
Browse homes for sale and investment properties in Miami Dade County. Refine your search by price, property type, or more.
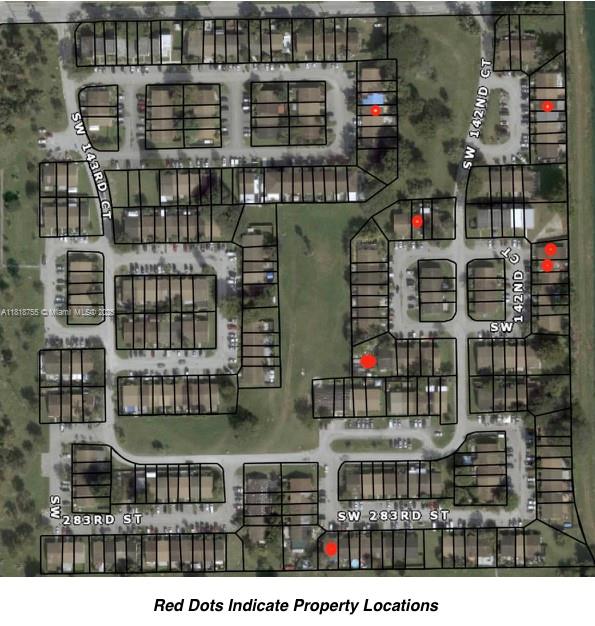
Best cash flowing properties in Miami Dade County
Active
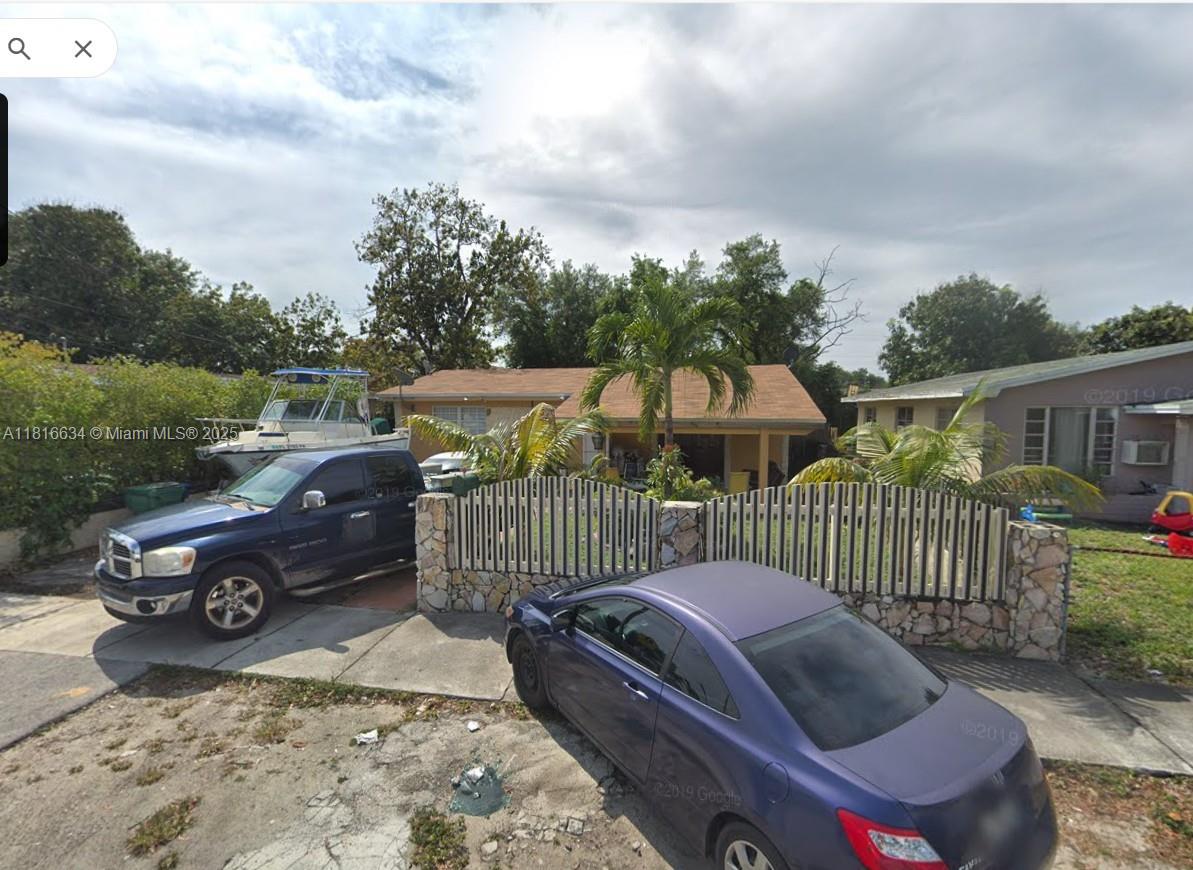
$195,000
1
bds
|
2
ba
|
920
sqft
|
built
1978
28091 SW 143rd Ct, Homestead, FL 33033
$39
Cash flow
1.0%
Cash-on-Cash Return
6.5%
Cap rate
1.0%
Rent to Value Ratio
Active
$400,000
3
bds
|
2
ba
|
1,320
sqft
|
built
1961
1940 NW 153rd St, Miami Gardens, FL 33054
$29
Cash flow
0.4%
Cash-on-Cash Return
6.4%
Cap rate
0.9%
Rent to Value Ratio
10,000 out of 16,729 properties for sale in Miami Dade County
Limited Results Shown
Create a free account, or log in to reveal all property listings and enjoy the complete experience.
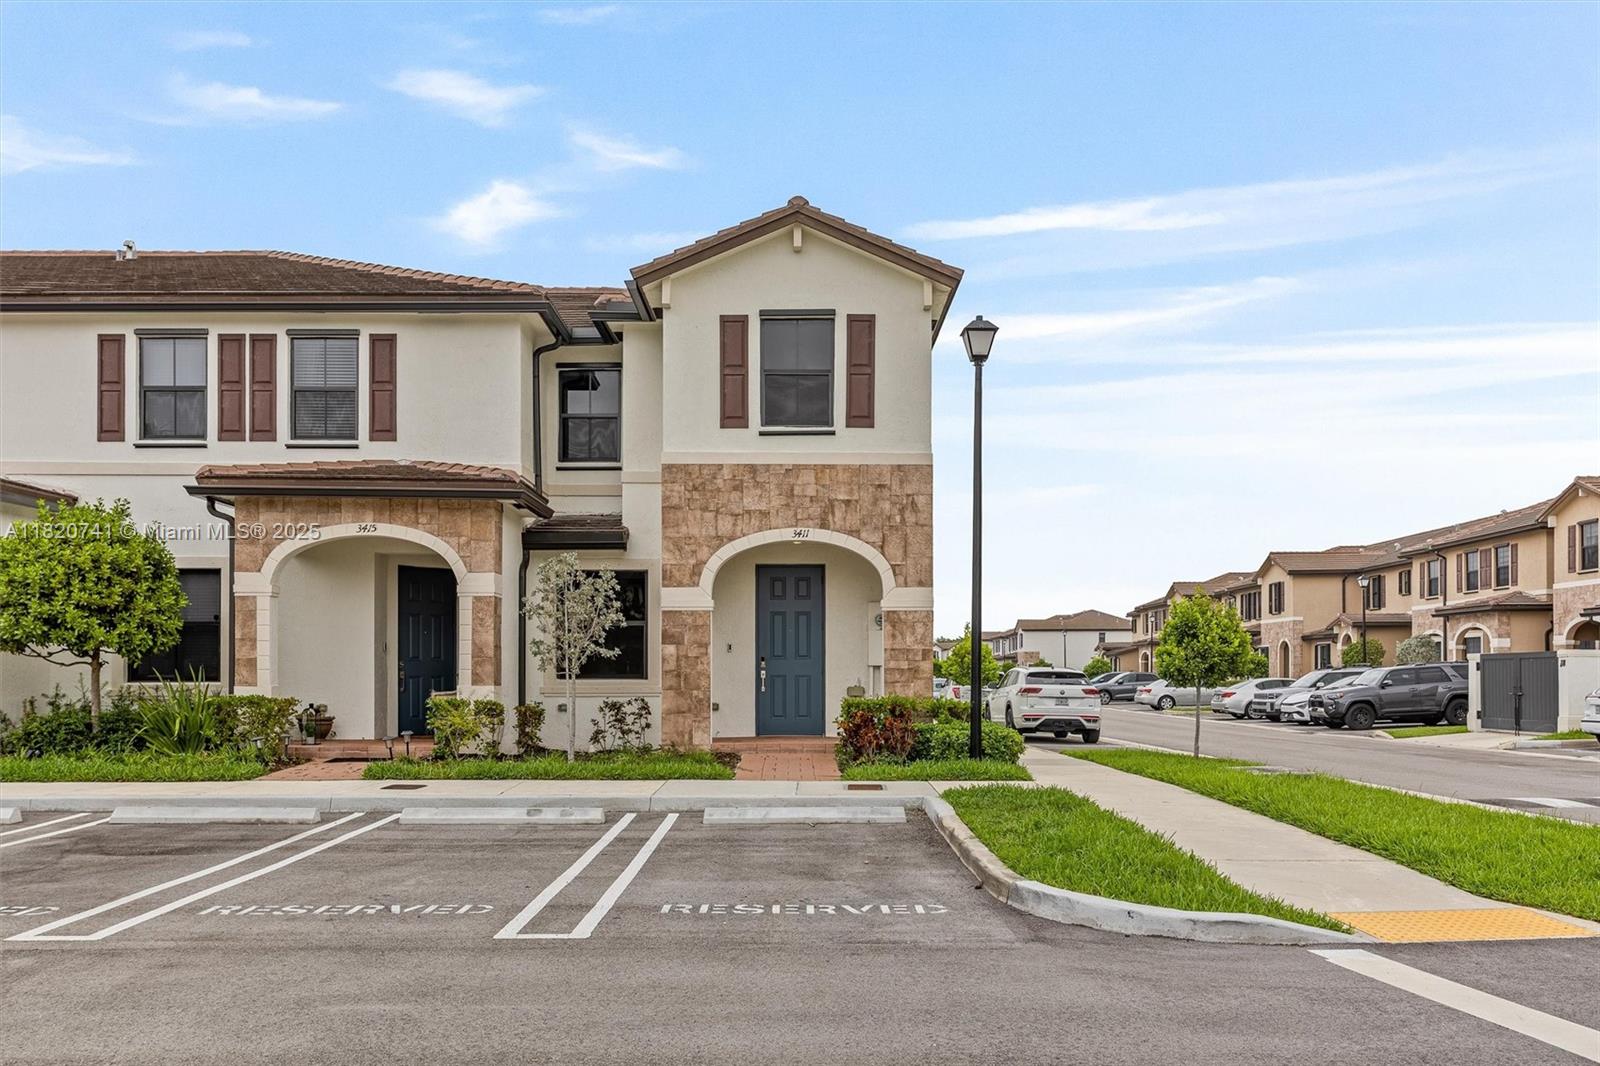
Active
$529,500
3
bds
|
3
ba
|
1,412
sqft
|
built
2021
3411 W 112th Ter, Hialeah, FL 33018
$-1,572
Cash flow
-15.5%
Cash-on-Cash Return
2.7%
Cap rate
0.6%
Rent to Value Ratio
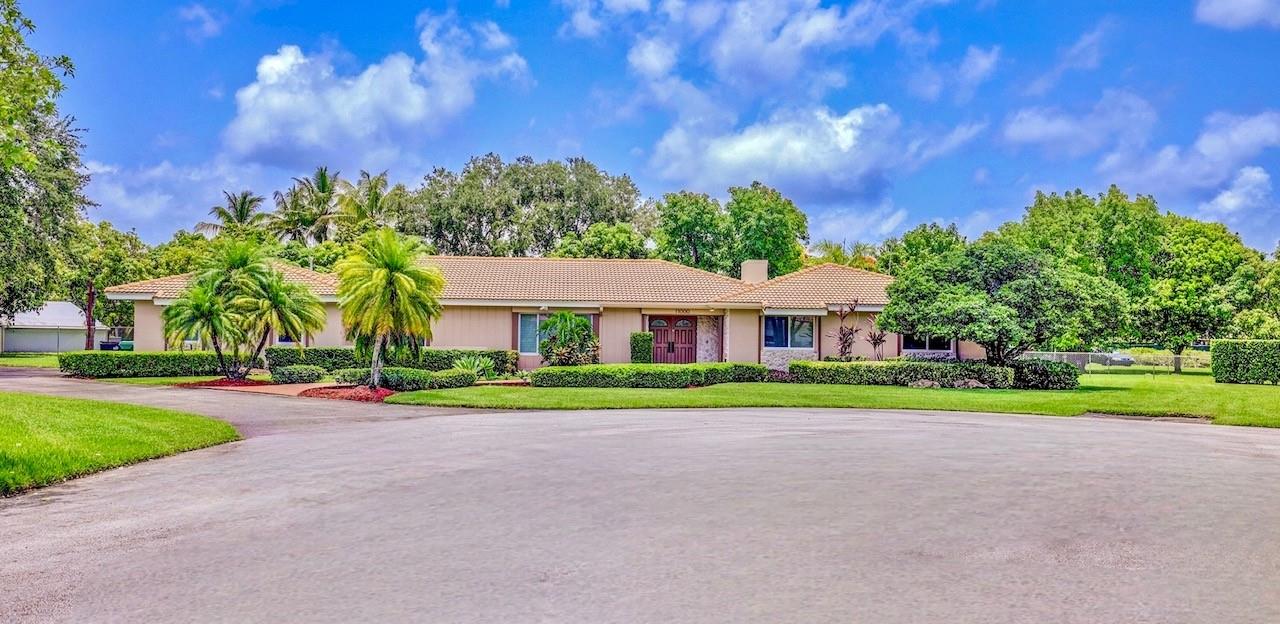
Active
$2,399,000
5
bds
|
3
ba
|
3,694
sqft
|
built
1971
11000 SW 75th Ct, Pinecrest, FL 33156
$-7,513
Cash flow
-16.3%
Cash-on-Cash Return
2.5%
Cap rate
0.4%
Rent to Value Ratio
Active
$1,400,000
2
bds
|
1
ba
|
1,404
sqft
|
built
1924
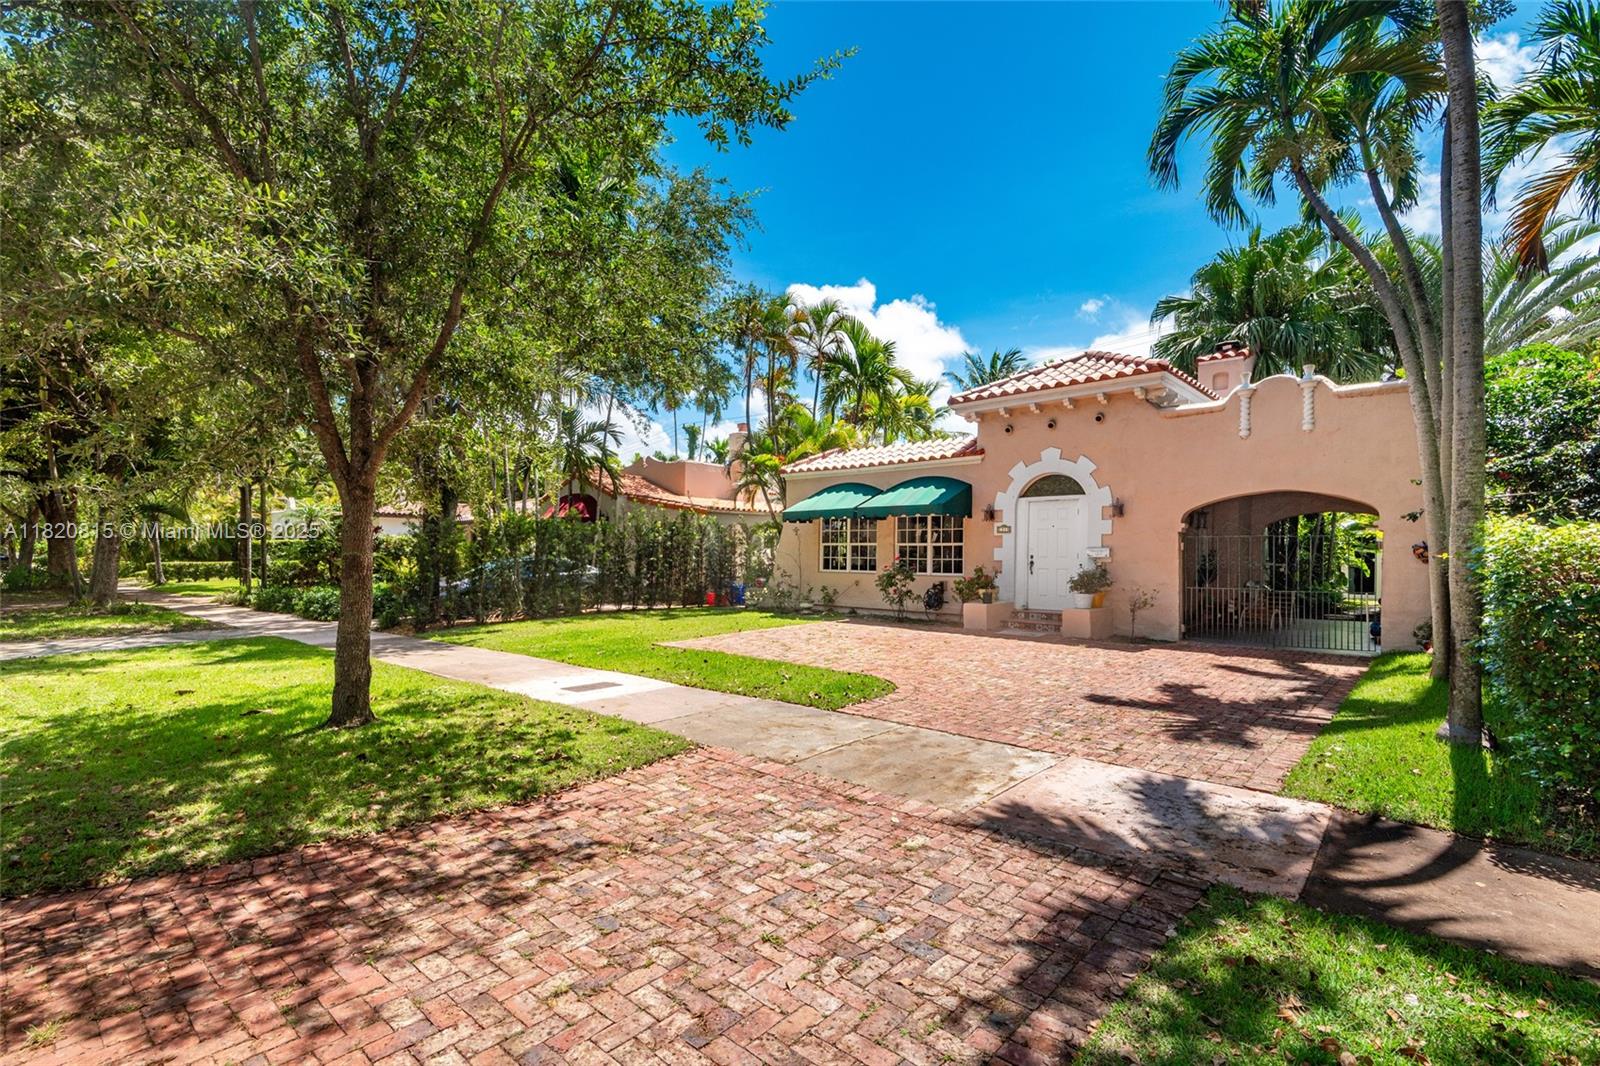
1218 Madrid St, Coral Gables, FL 33134
$-5,376
Cash flow
-20.0%
Cash-on-Cash Return
1.7%
Cap rate
0.3%
Rent to Value Ratio
Active
$345,000
2
bds
|
3
ba
|
1,224
sqft
|
built
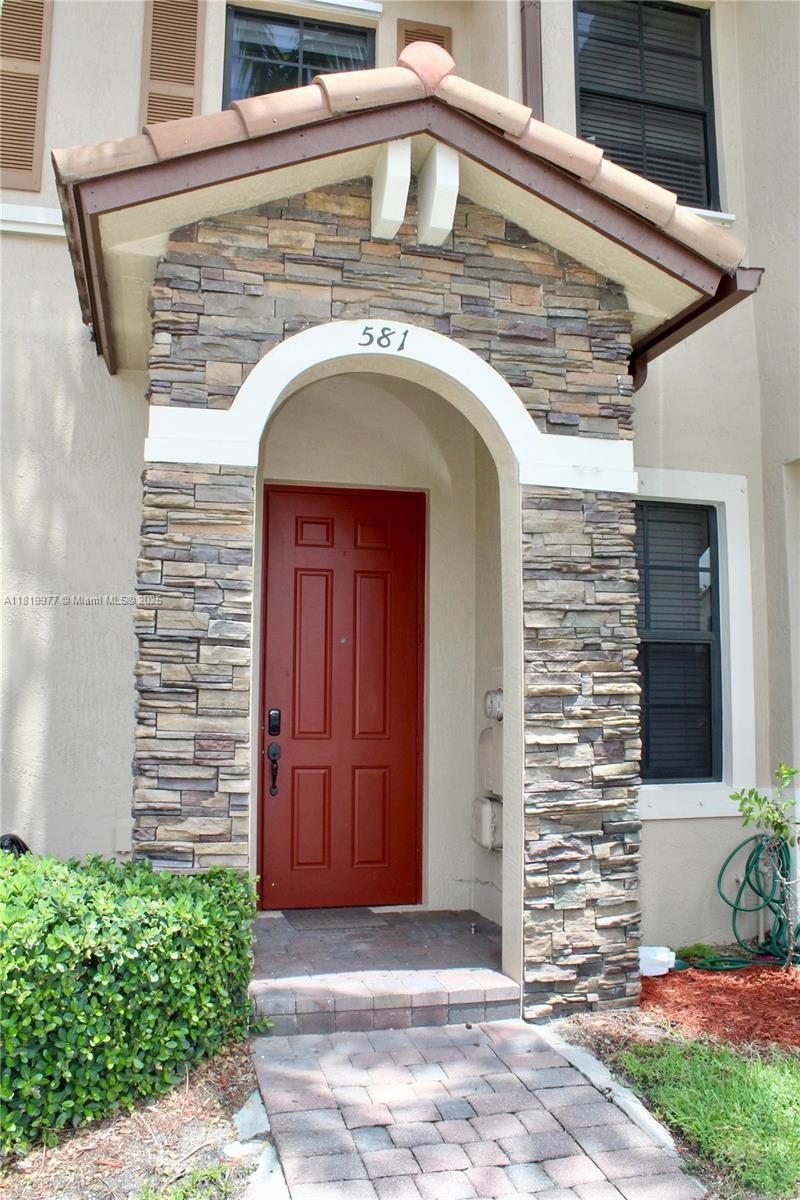
2014
581 SE 32nd Ter, Homestead, FL 33033
$-829
Cash flow
-12.5%
Cash-on-Cash Return
3.4%
Cap rate
0.7%
Rent to Value Ratio
Active
$1,799,000
5
bds
|
7
ba
|
3,676
sqft
|
built
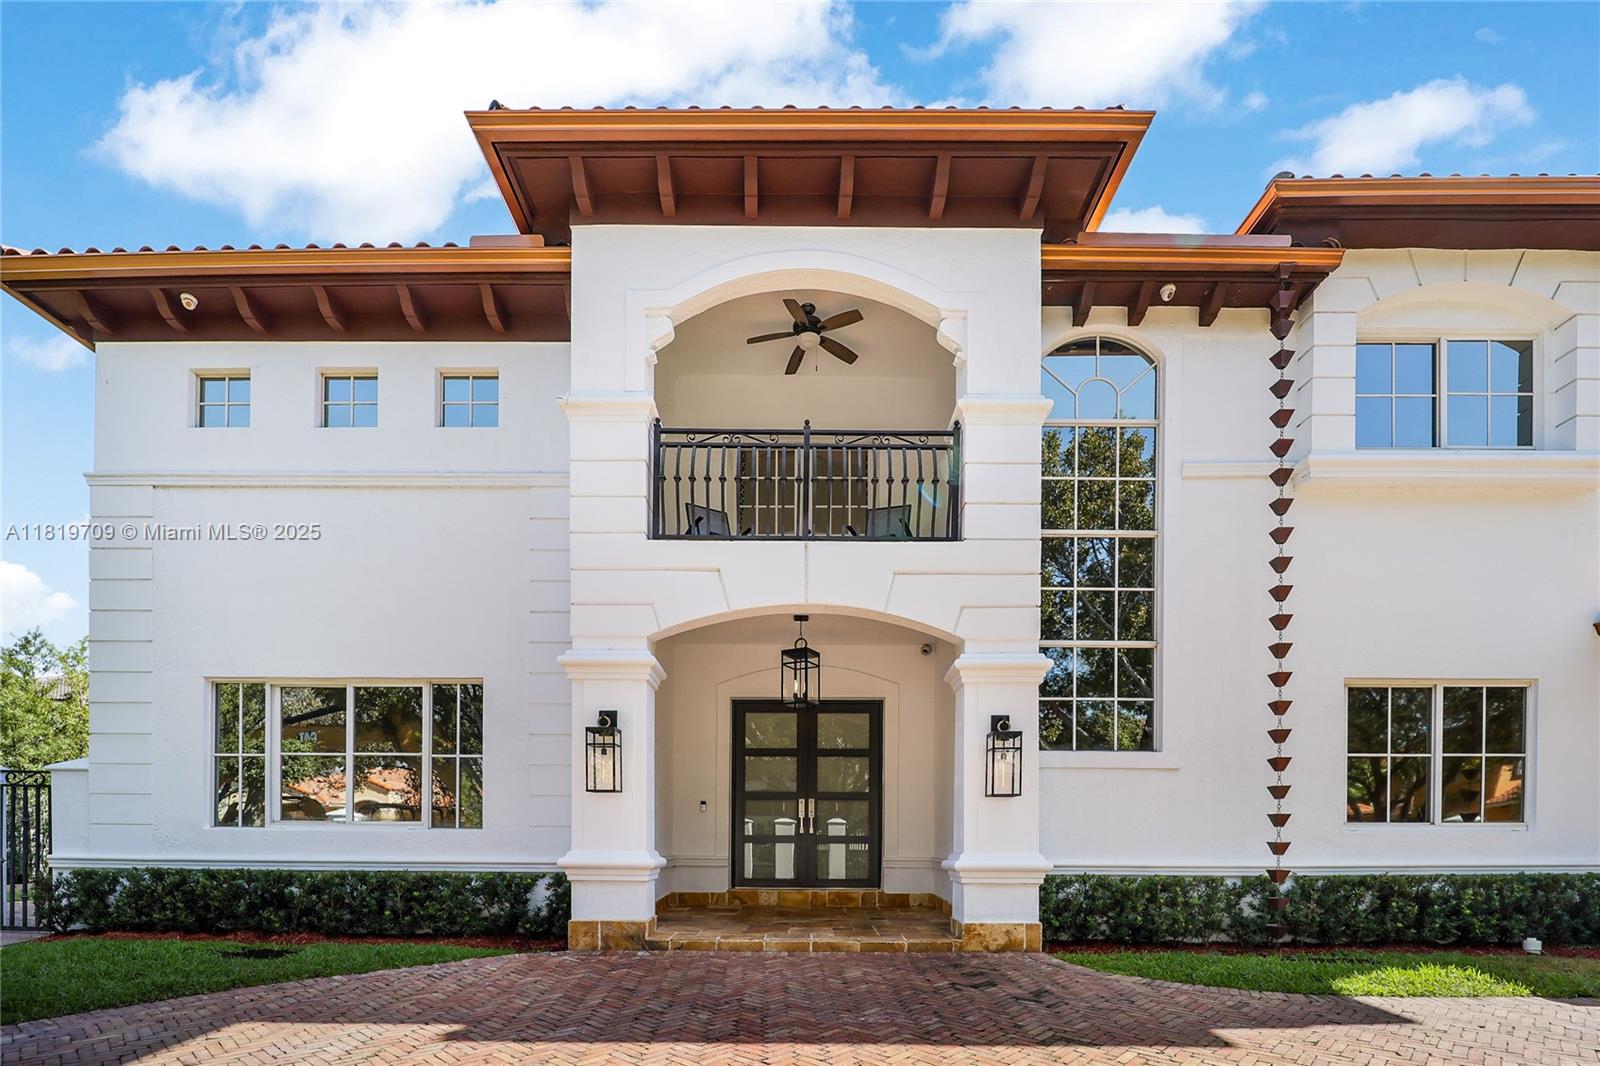
2006
16763 NW 77th Path, Miami Lakes, FL 33016
$-5,876
Cash flow
-17.0%
Cash-on-Cash Return
2.4%
Cap rate
0.4%
Rent to Value Ratio
Pending
$1,950,000
4
bds
|
3
ba
|
3,020
sqft
|
built
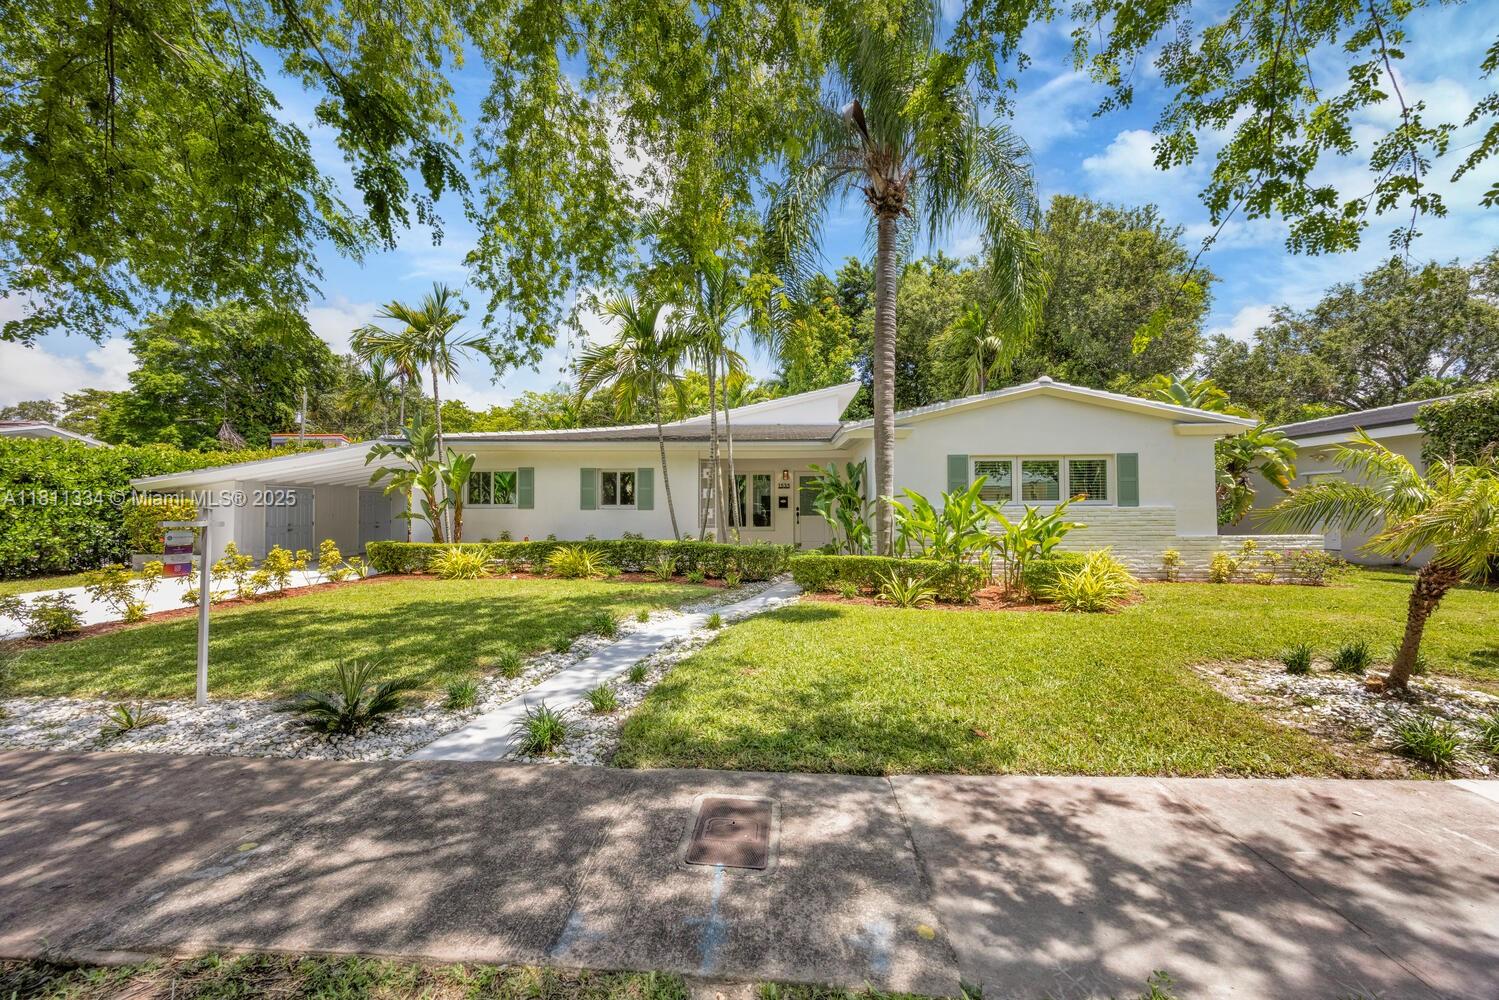
1954
1535 Trevino Ave, Coral Gables, FL 33134
$-6,204
Cash flow
-16.6%
Cash-on-Cash Return
2.5%
Cap rate
0.5%
Rent to Value Ratio
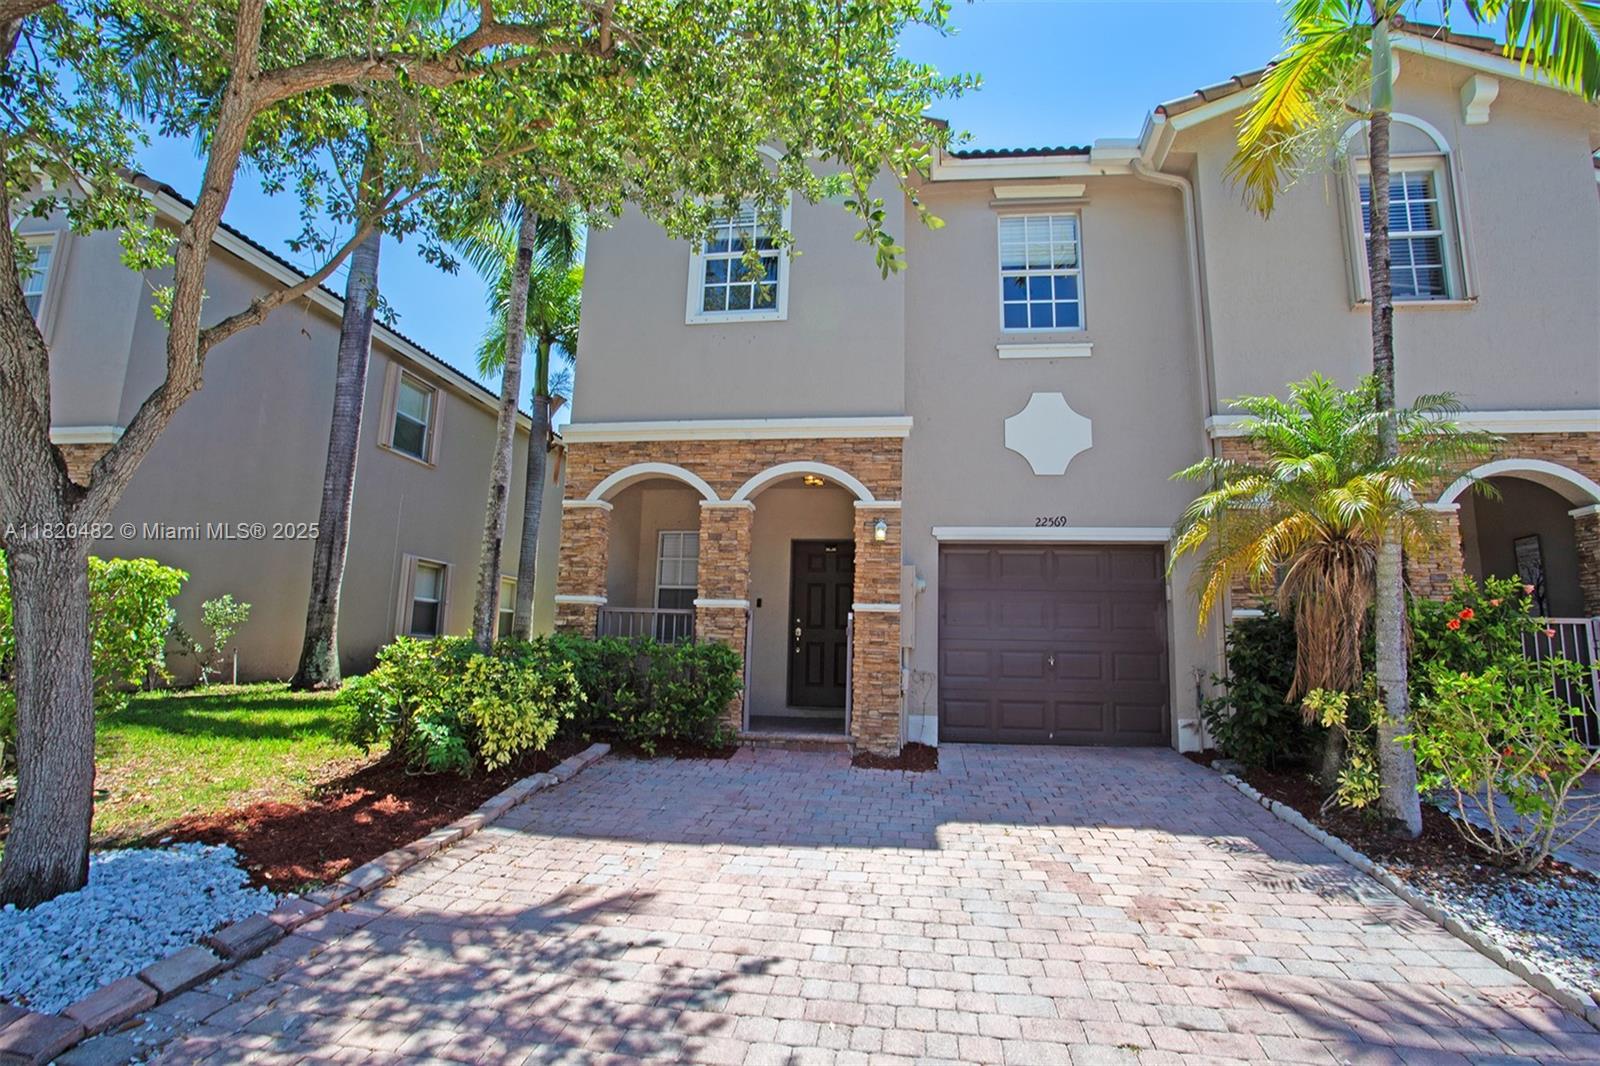
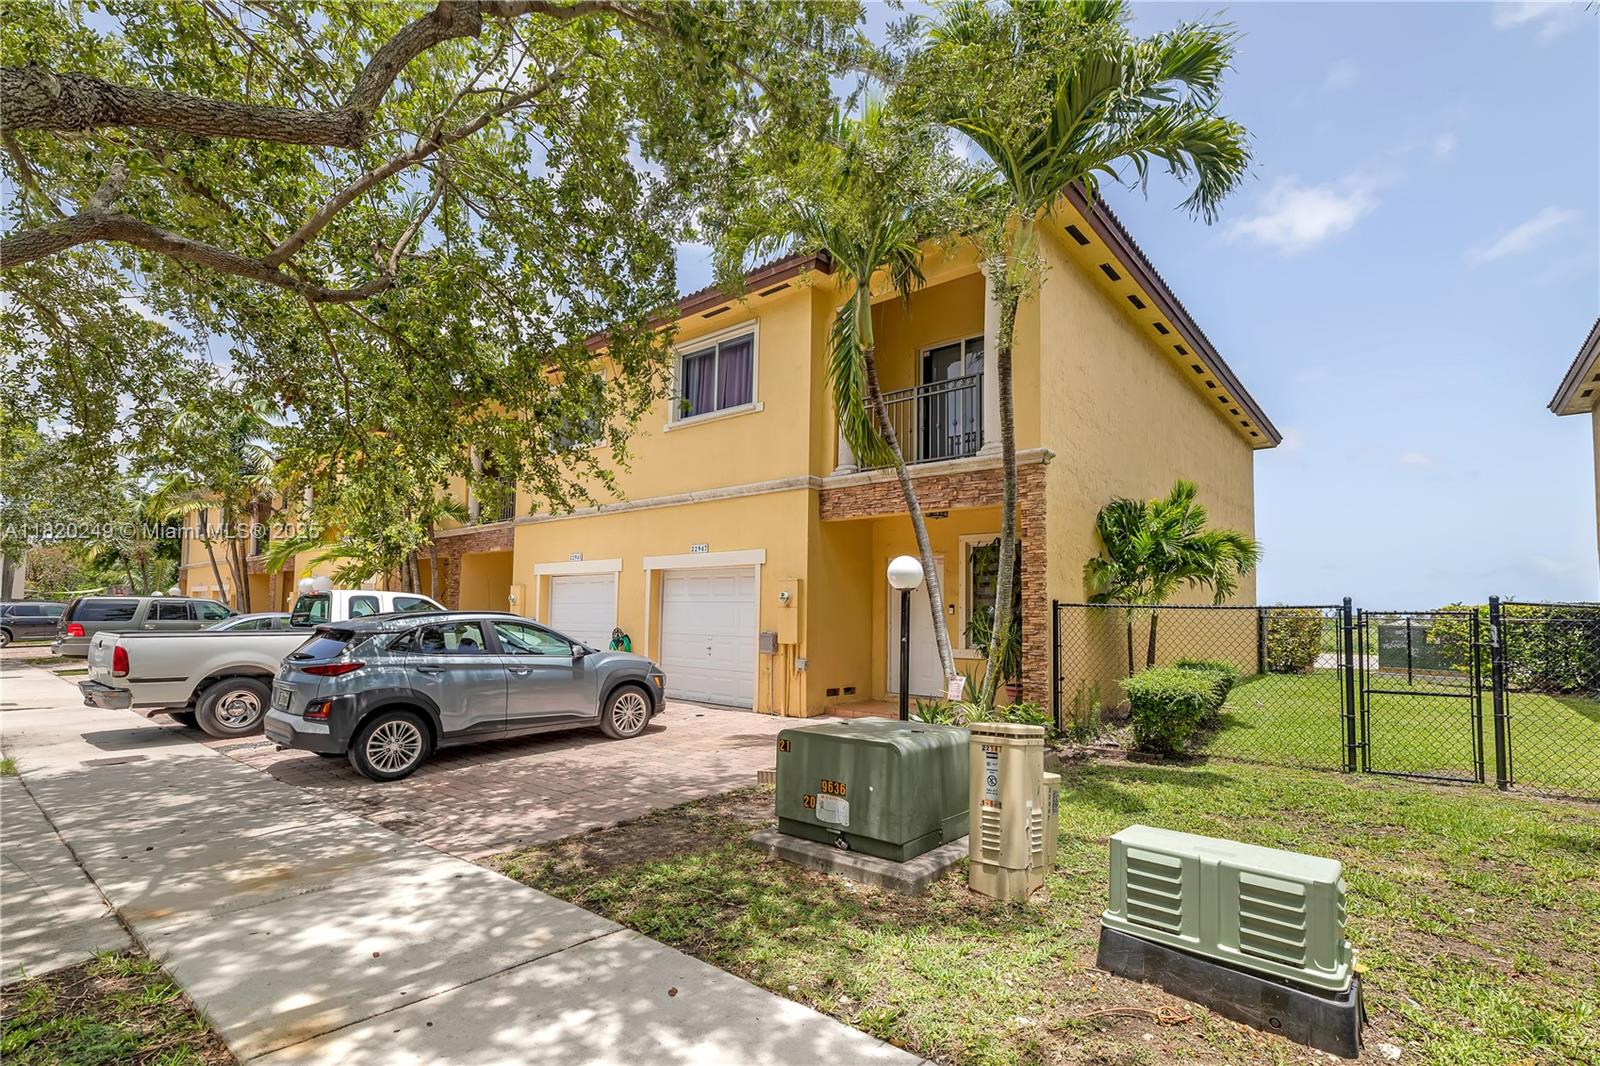
Active
$465,000
4
bds
|
3
ba
|
1,720
sqft
|
built
2006
22569 SW 89th Pl, Cutler Bay, FL 33190
$-1,241
Cash flow
-13.9%
Cash-on-Cash Return
3.1%
Cap rate
0.6%
Rent to Value Ratio
Active
$315,000
2
bds
|
2
ba
|
993
sqft
|
built
1985
9810 Hammocks Blvd, Miami, FL 33196
$-787
Cash flow
-13.0%
Cash-on-Cash Return
3.3%
Cap rate
0.7%
Rent to Value Ratio
Active
$805,000
3
bds
|
2
ba
|
1,525
sqft
|
built
1973
230 174th St, Sunny Isles Beach, FL 33160
$-3,069
Cash flow
-19.9%
Cash-on-Cash Return
1.7%
Cap rate
0.4%
Rent to Value Ratio
Active
$630,000
3
bds
|
2
ba
|
1,568
sqft
|
built
1950
13885 NW 5th Ave, North Miami, FL 33168
$-1,701
Cash flow
-14.1%
Cash-on-Cash Return
3.0%
Cap rate
0.5%
Rent to Value Ratio
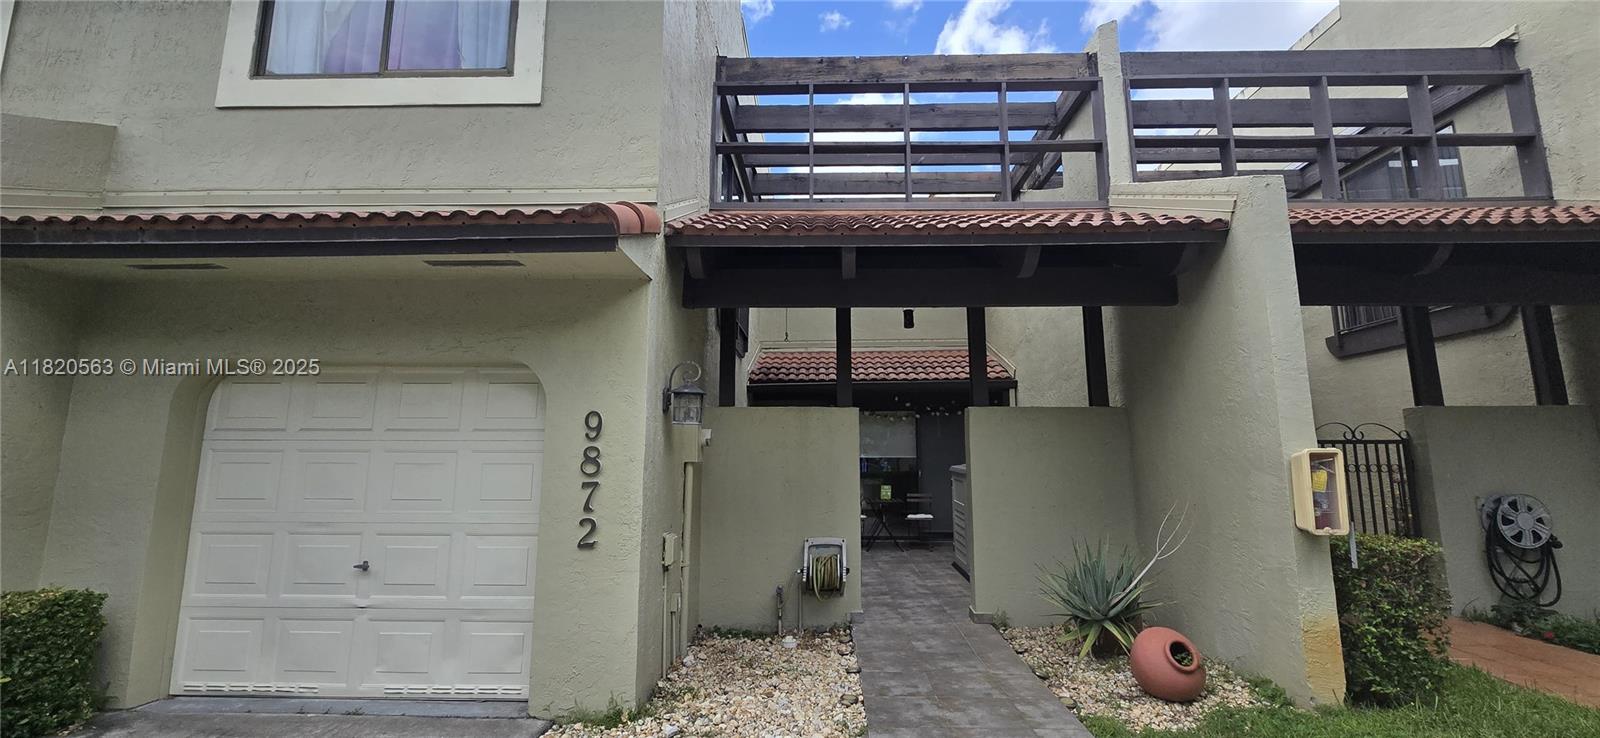
Active
$650,000
3
bds
|
3
ba
|
1,712
sqft
|
built
1990
9872 Costa Del Sol Blvd, Doral, FL 33178
$-2,229
Cash flow
-17.9%
Cash-on-Cash Return
2.2%
Cap rate
0.6%
Rent to Value Ratio
Active
$1,490,000
4
bds
|
3
ba
|
2,596
sqft
|
built
1978
17025 SW 80th Ct, Palmetto Bay, FL 33157
$-4,077
Cash flow
-14.3%
Cash-on-Cash Return
3.0%
Cap rate
0.4%
Rent to Value Ratio
Active
$569,900
4
bds
|
2
ba
|
1,344
sqft
|
built
1979
20747 NW 41st Avenue Rd, Miami Gardens, FL 33055
$-1,588
Cash flow
-14.5%
Cash-on-Cash Return
2.9%
Cap rate
0.5%
Rent to Value Ratio
Active
$450,000
1
bds
|
2
ba
|
838
sqft
|
built
2004
1250 S Miami Ave, Miami, FL 33130
$-1,814
Cash flow
-21.0%
Cash-on-Cash Return
1.4%
Cap rate
0.6%
Rent to Value Ratio
Active
$230,000
1
bds
|
1
ba
|
536
sqft
|
built
1973
17570 Atlantic Blvd, Sunny Isles Beach, FL 33160
$-465
Cash flow
-10.5%
Cash-on-Cash Return
3.9%
Cap rate
0.9%
Rent to Value Ratio
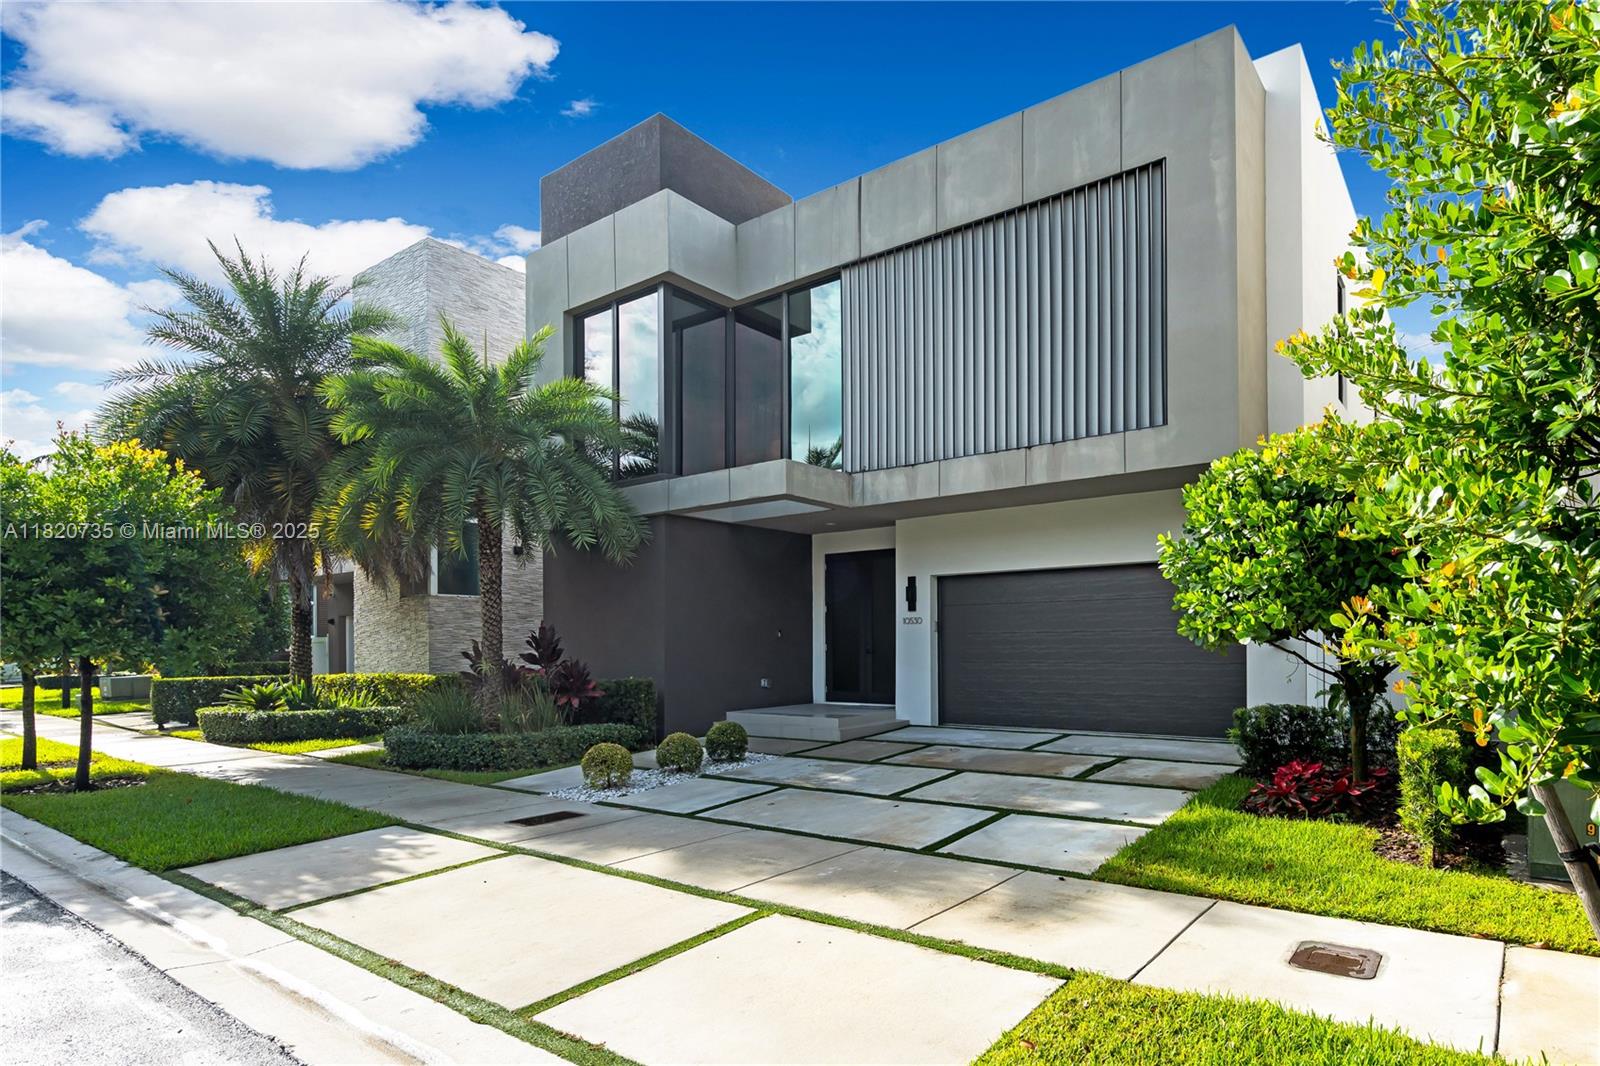
Active
$2,625,000
5
bds
|
6
ba
|
4,067
sqft
|
built
2021
10530 NW 67th Ter, Doral, FL 33178
$-9,214
Cash flow
-18.3%
Cash-on-Cash Return
2.1%
Cap rate
0.4%
Rent to Value Ratio
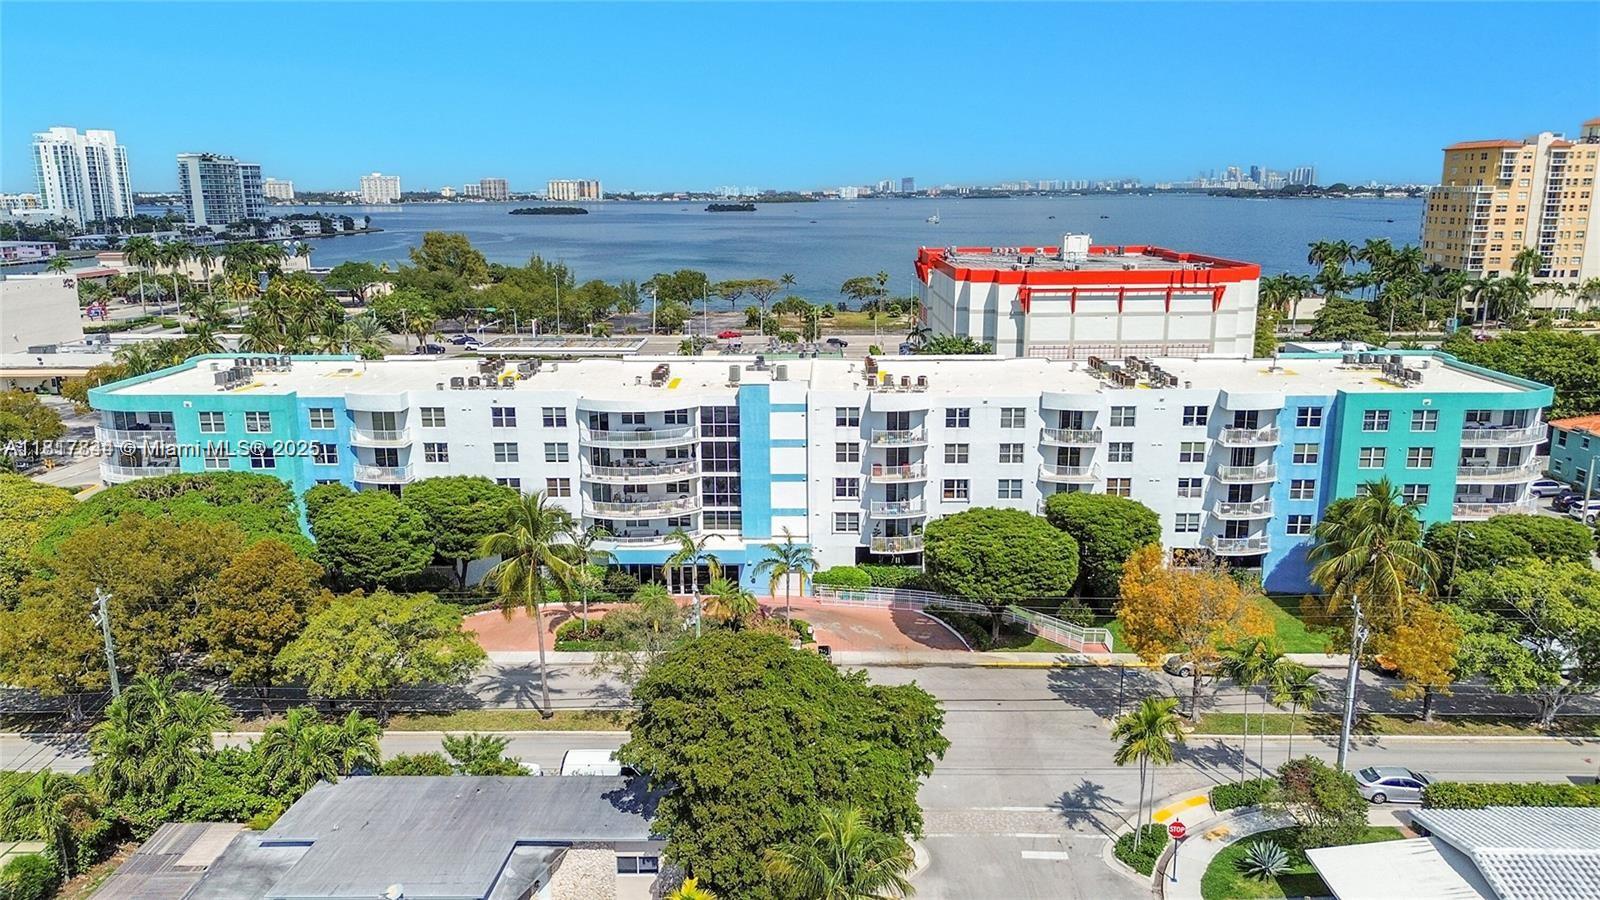
Active
$399,000
2
bds
|
2
ba
|
1,080
sqft
|
built
2005
1555 N Treasure Dr, North Bay Village, FL 33141
$-1,604
Cash flow
-21.0%
Cash-on-Cash Return
1.5%
Cap rate
0.7%
Rent to Value Ratio
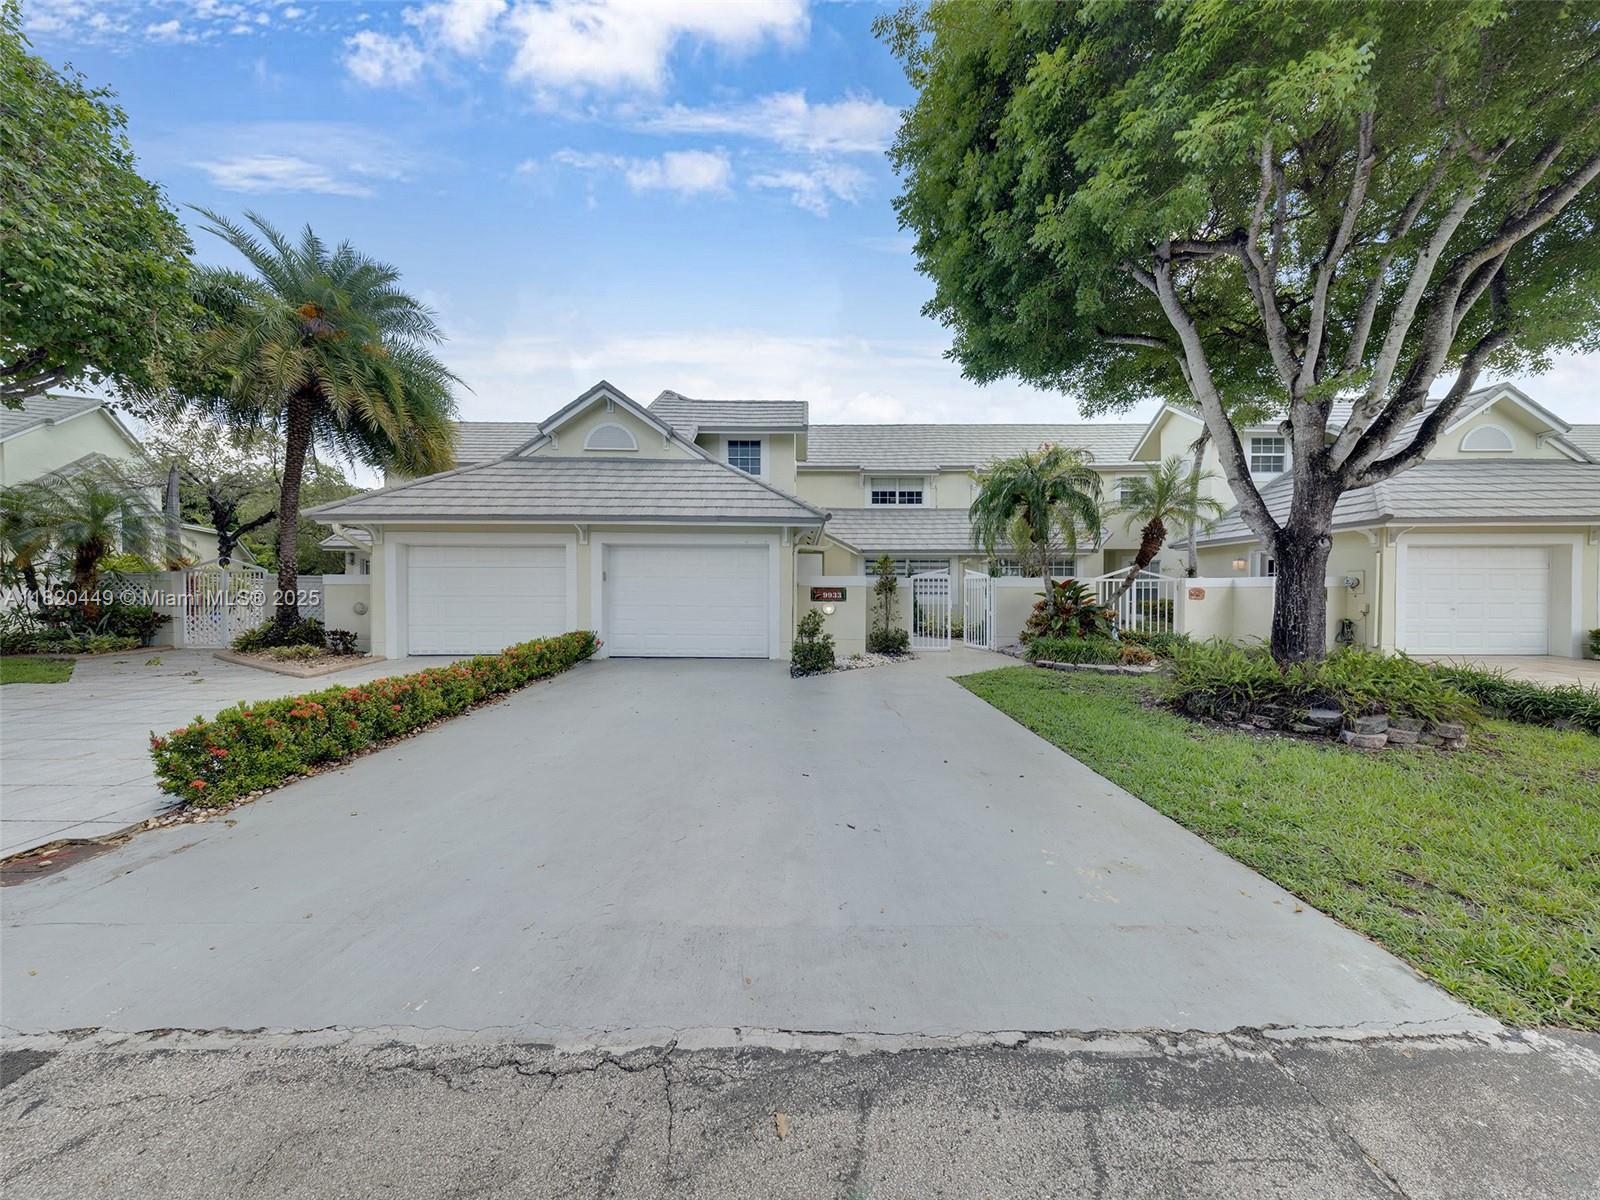
Active
$685,000
3
bds
|
3
ba
|
2,014
sqft
|
built
1987
9933 NW 49th Ter, Doral, FL 33178
$-1,998
Cash flow
-15.2%
Cash-on-Cash Return
2.8%
Cap rate
0.6%
Rent to Value Ratio
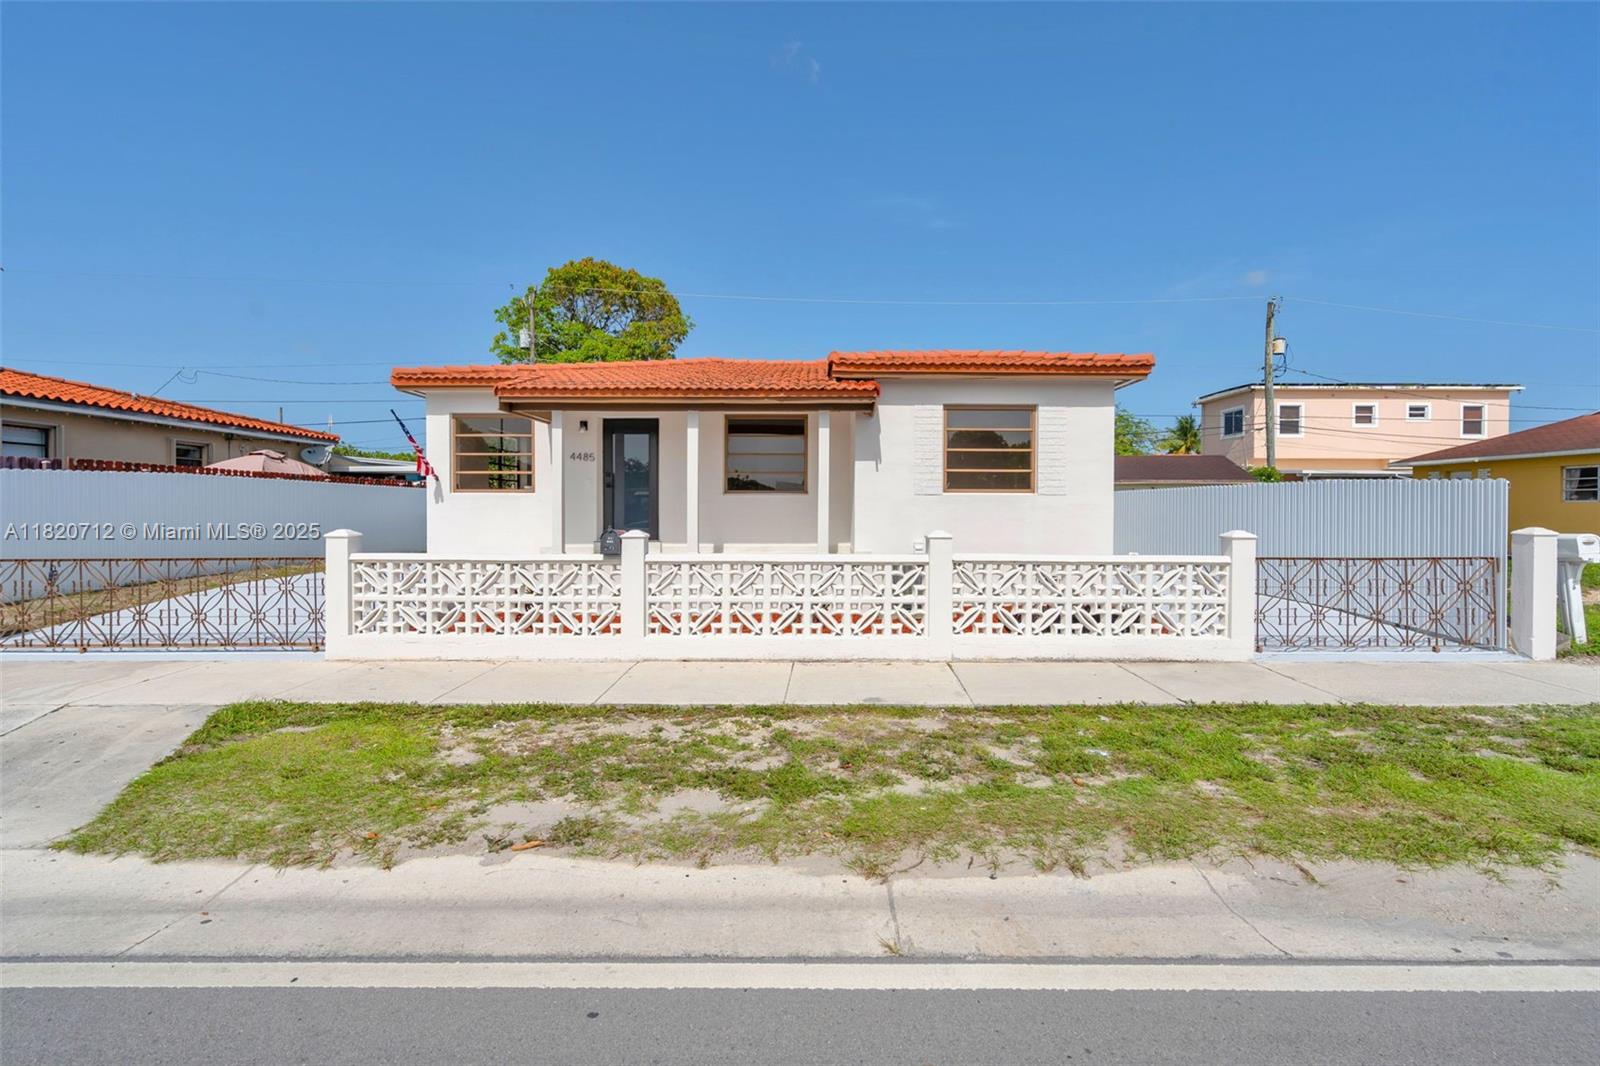
Active
$559,000
3
bds
|
1
ba
|
1,403
sqft
|
built
1955
4485 E 8th Ave, Hialeah, FL 33013
$-873
Cash flow
-8.1%
Cash-on-Cash Return
4.4%
Cap rate
0.6%
Rent to Value Ratio
Pending
$550,000
3
bds
|
2
ba
|
1,589
sqft
|
built
1991
13811 SW 285th Ter, Homestead, FL 33033
$-781
Cash flow
-7.4%
Cash-on-Cash Return
4.6%
Cap rate
0.6%
Rent to Value Ratio
Active
$535,000
3
bds
|
2
ba
|
1,129
sqft
|
built
2019
4740 NW 84th Ct, Doral, FL 33166
$-1,940
Cash flow
-18.9%
Cash-on-Cash Return
1.9%
Cap rate
0.6%
Rent to Value Ratio

Active
$2,500,000
4
bds
|
4
ba
|
2,620
sqft
|
built
1955
2085 Ixora Rd, North Miami, FL 33181
$-11,422
Cash flow
-23.8%
Cash-on-Cash Return
0.8%
Cap rate
0.3%
Rent to Value Ratio
Active
$9,500,000
3
bds
|
4
ba
|
3,524
sqft
|
built
2011
9705 Collins Ave, Bal Harbour, FL 33154
$-57,217
Cash flow
-31.4%
Cash-on-Cash Return
-0.9%
Cap rate
0.1%
Rent to Value Ratio
Pending
$420,000
4
bds
|
3
ba
|
1,698
sqft
|
built
2006
22947 SW 112th Ct, Miami, FL 33170
$-670
Cash flow
-8.3%
Cash-on-Cash Return
4.4%
Cap rate
0.7%
Rent to Value Ratio
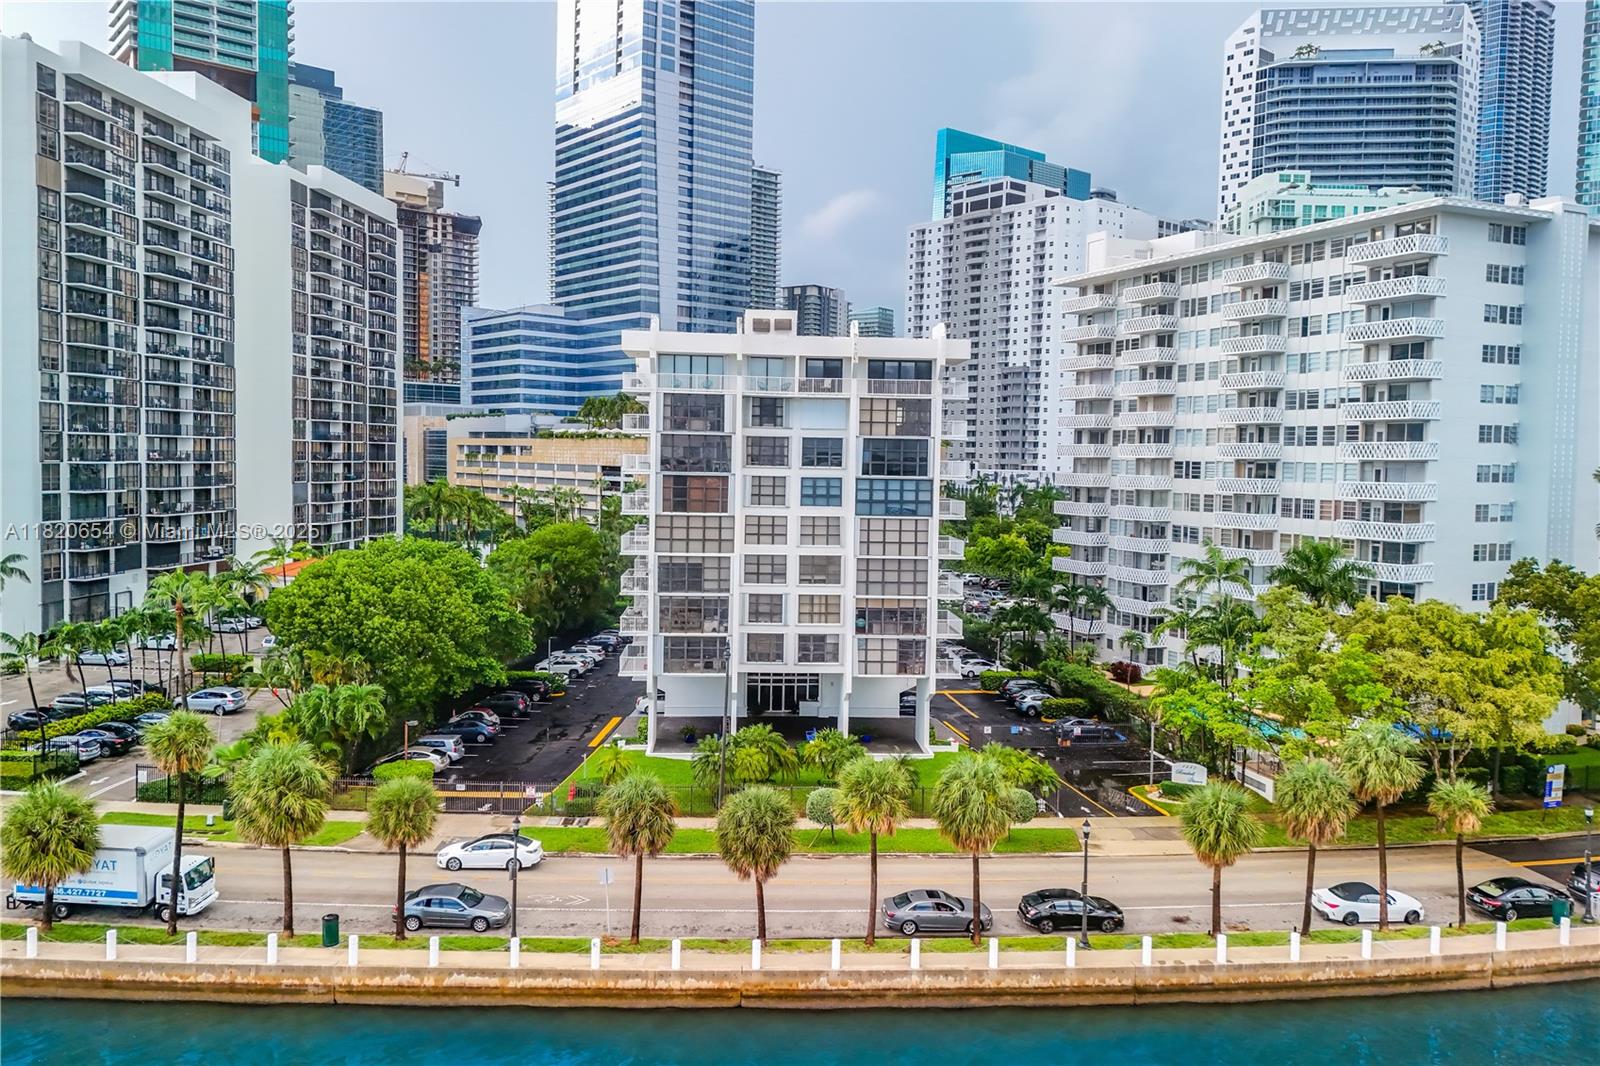
Active
$568,500
2
bds
|
2
ba
|
986
sqft
|
built
1978
1440 Brickell Bay Dr, Miami, FL 33131
$-1,758
Cash flow
-16.1%
Cash-on-Cash Return
2.6%
Cap rate
0.7%
Rent to Value Ratio
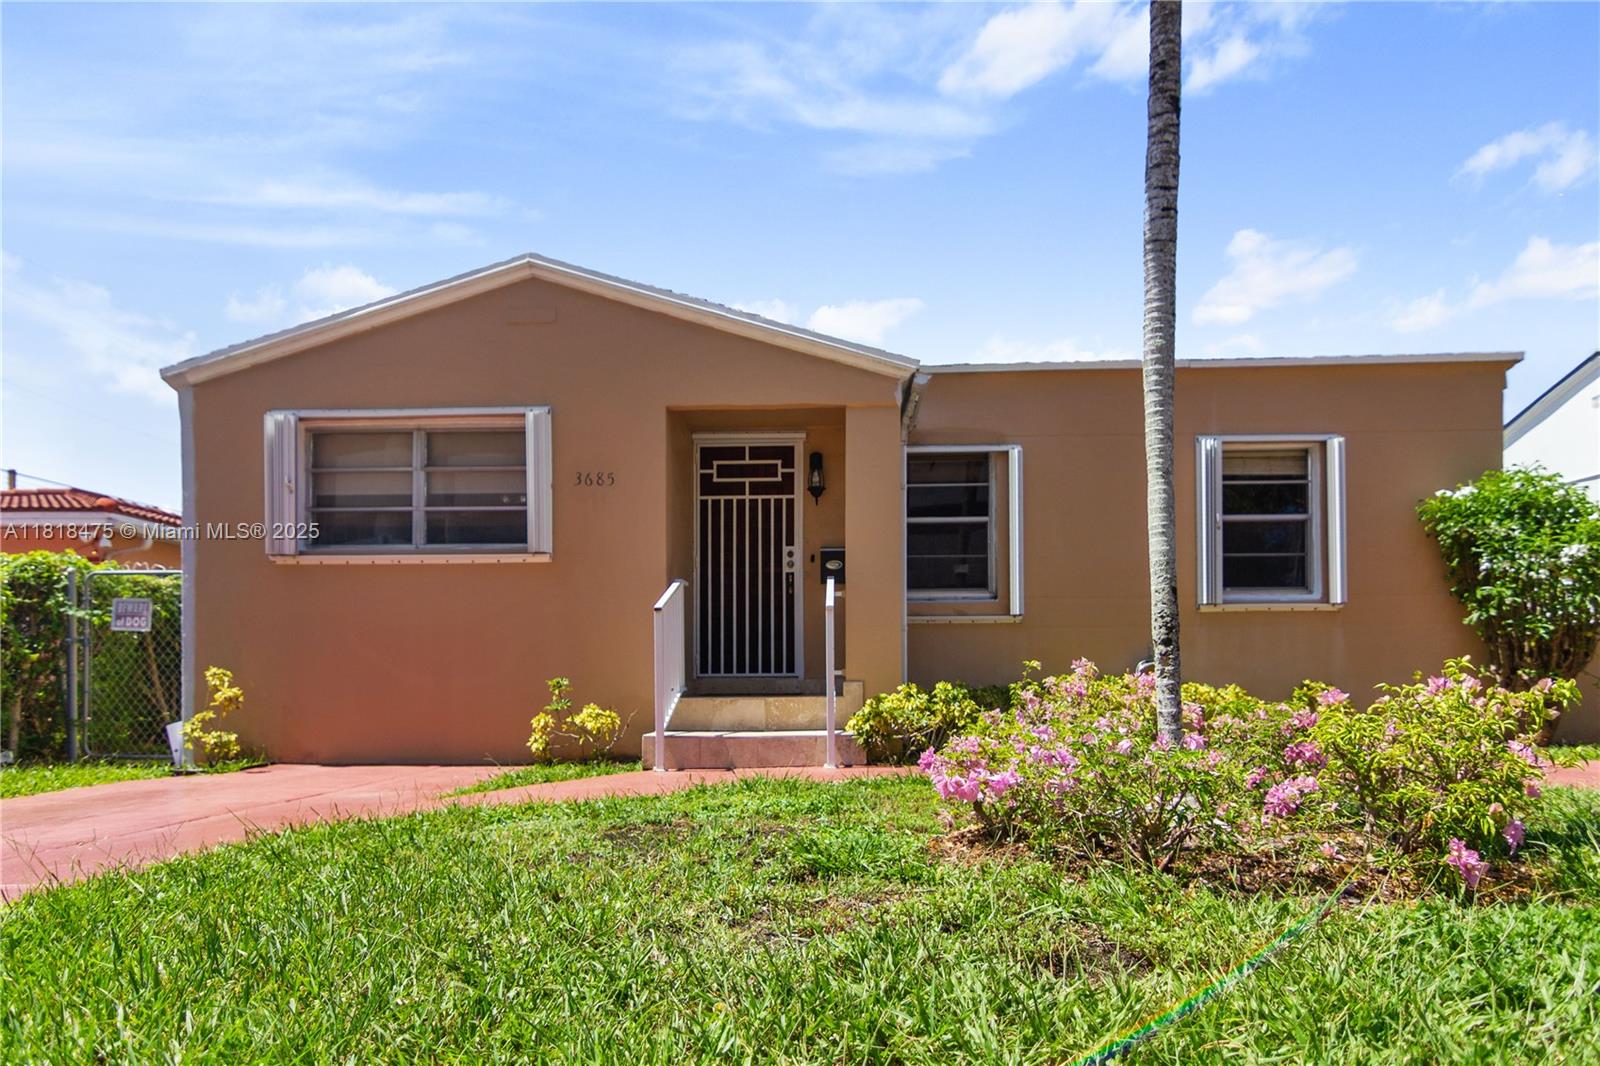
Active
$750,000
3
bds
|
2
ba
|
1,263
sqft
|
built
1940
3685 SW 26th St, Miami, FL 33133
$-1,400
Cash flow
-9.7%
Cash-on-Cash Return
4.0%
Cap rate
0.5%
Rent to Value Ratio
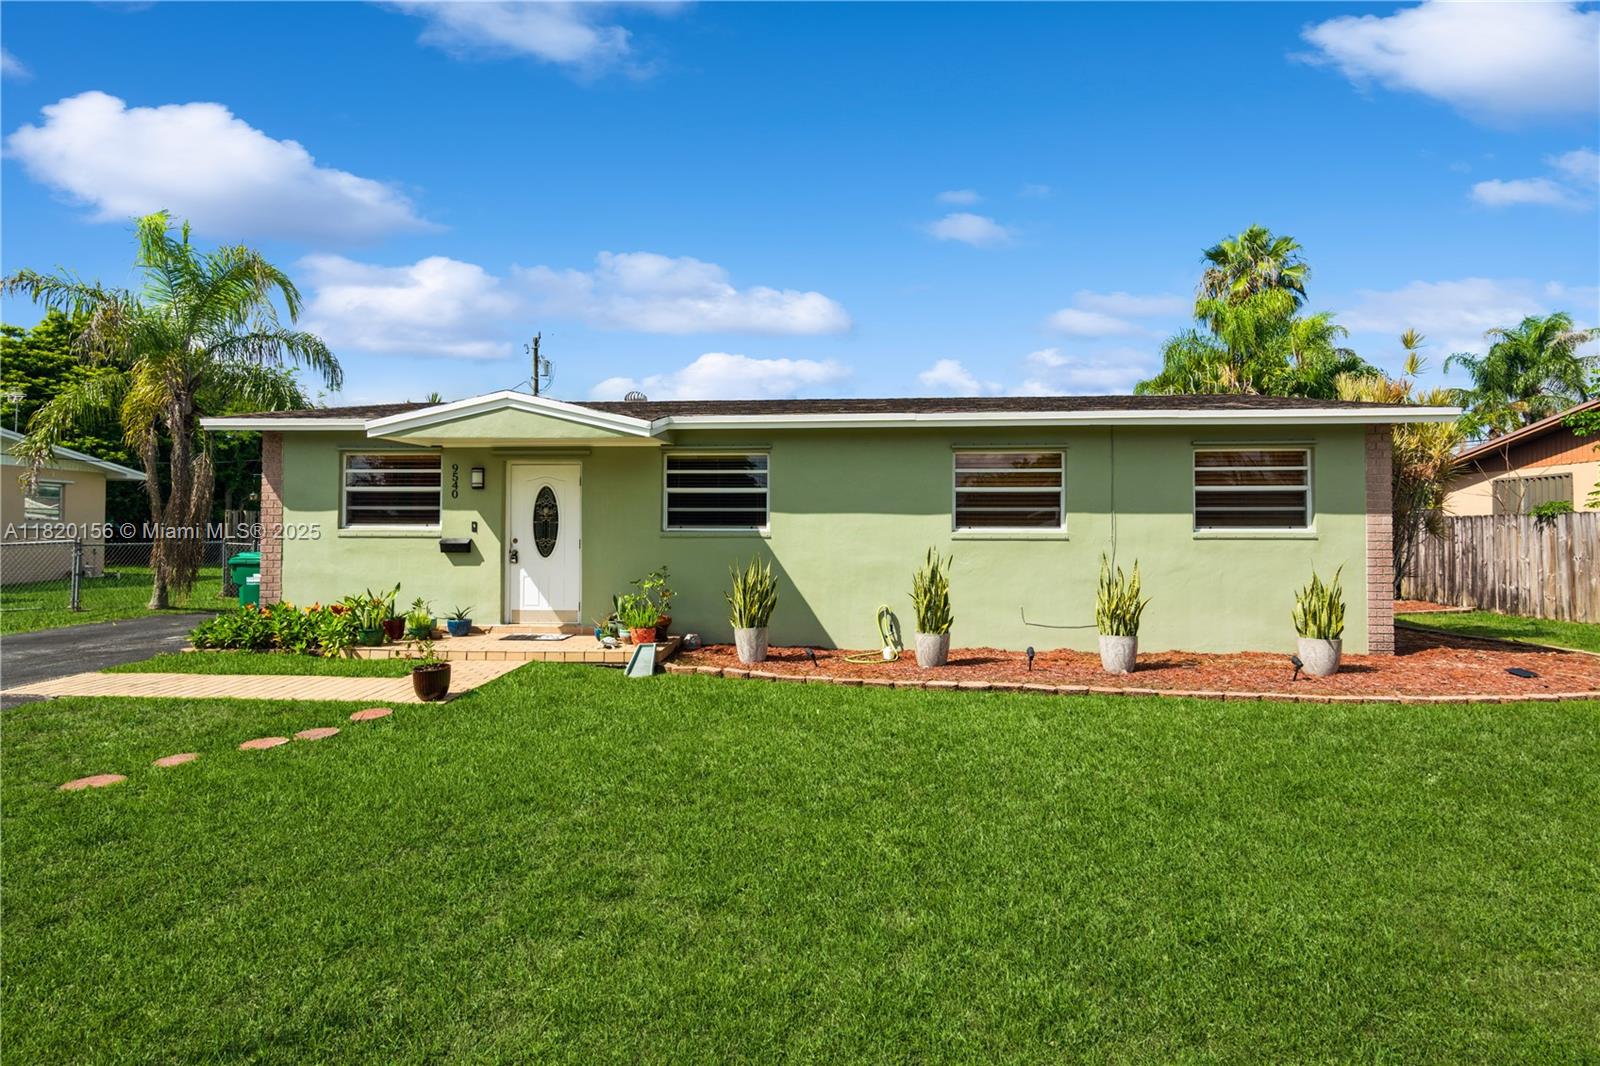
Active
$645,000
3
bds
|
2
ba
|
1,565
sqft
|
built
1971
9540 Lisa Rd, Cutler Bay, FL 33157
$-1,363
Cash flow
-11.0%
Cash-on-Cash Return
3.7%
Cap rate
0.5%
Rent to Value Ratio
Active
$460,000
2
bds
|
2
ba
|
1,229
sqft
|
built
1982
780 NE 69th St, Miami, FL 33138
$-2,048
Cash flow
-23.2%
Cash-on-Cash Return
0.9%
Cap rate
0.7%
Rent to Value Ratio
Active
$680,000
2
bds
|
2
ba
|
1,424
sqft
|
built
1980
1925 Brickell Ave, Miami, FL 33129
$-2,911
Cash flow
-22.3%
Cash-on-Cash Return
1.1%
Cap rate
0.6%
Rent to Value Ratio
Active
$356,000
2
bds
|
2
ba
|
1,175
sqft
|
built
1980
7801 Abbott Ave, Miami Beach, FL 33141
$-413
Cash flow
-6.1%
Cash-on-Cash Return
4.9%
Cap rate
0.9%
Rent to Value Ratio
Active
$1,790,000
3
bds
|
3
ba
|
1,708
sqft
|
built
2010
2020 N Bayshore Dr, Miami, FL 33137
$-6,862
Cash flow
-20.0%
Cash-on-Cash Return
1.7%
Cap rate
0.6%
Rent to Value Ratio
Active
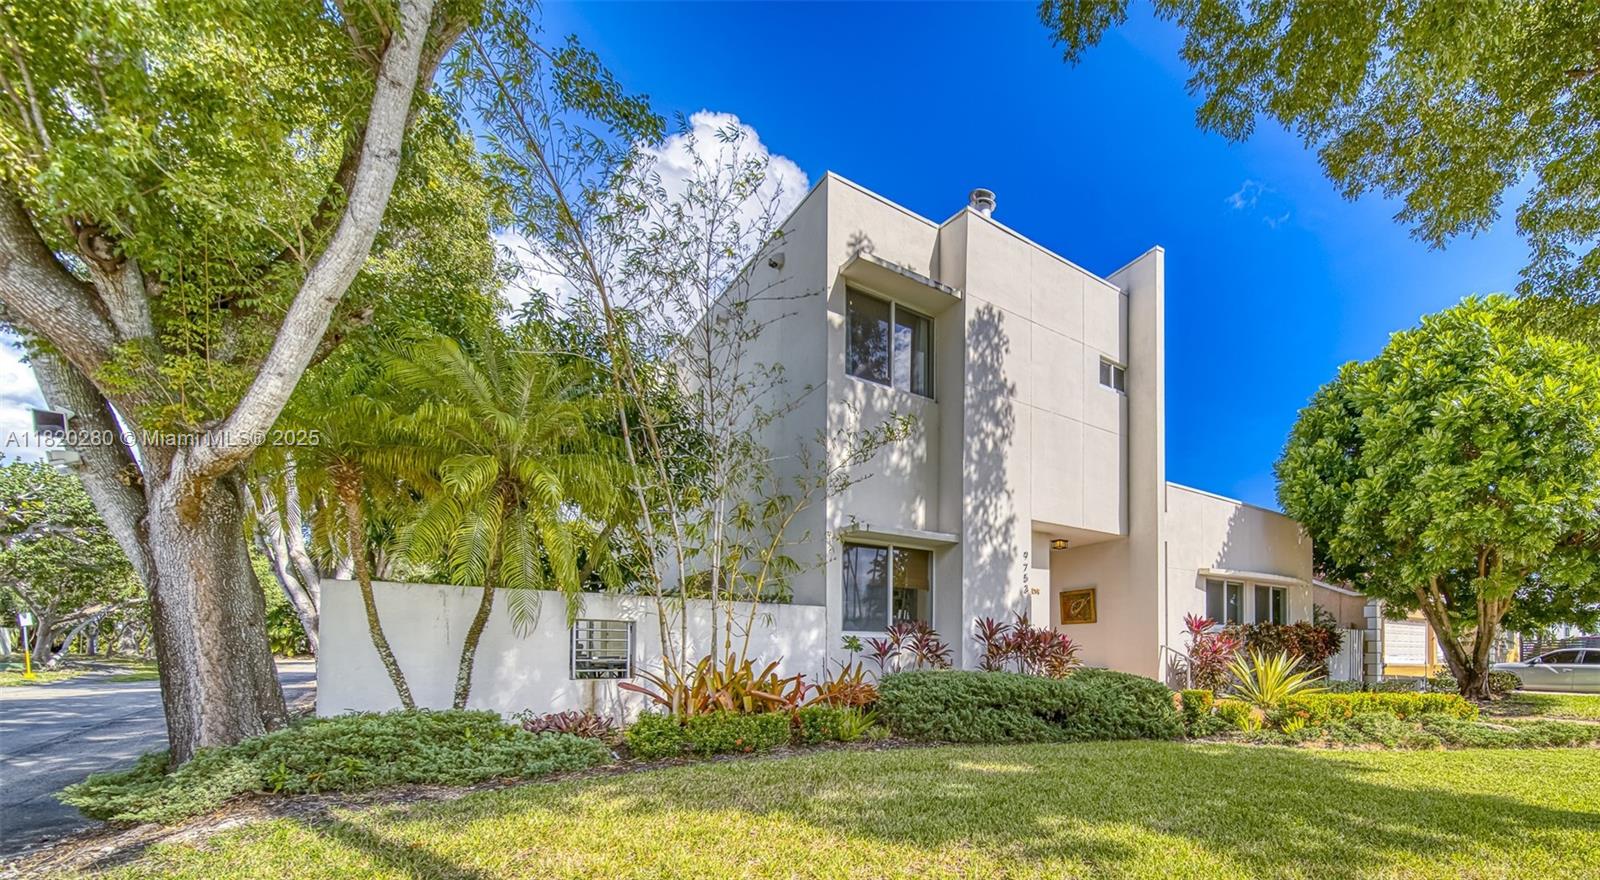
$1,449,900
4
bds
|
3
ba
|
3,475
sqft
|
built
1999
9753 SW 93rd Ter, Miami, FL 33176
$-3,004
Cash flow
-10.8%
Cash-on-Cash Return
3.8%
Cap rate
0.6%
Rent to Value Ratio
Active
$375,000
1
bds
|
2
ba
|
991
sqft
|
built
1975
100 Bayview Dr, Sunny Isles Beach, FL 33160
$-1,220
Cash flow
-17.0%
Cash-on-Cash Return
2.4%
Cap rate
0.8%
Rent to Value Ratio
Active
$499,000
2
bds
|
2
ba
|
1,521
sqft
|
built
1975
100 Bayview Dr, Sunny Isles Beach, FL 33160
$-2,156
Cash flow
-22.5%
Cash-on-Cash Return
1.1%
Cap rate
0.7%
Rent to Value Ratio
Active
$594,000
2
bds
|
2
ba
|
1,380
sqft
|
built
1990
3500 Mystic Pointe Dr, Aventura, FL 33180
$-2,491
Cash flow
-21.9%
Cash-on-Cash Return
1.3%
Cap rate
0.6%
Rent to Value Ratio

Active
$575,000
3
bds
|
3
ba
|
1,621
sqft
|
built
2018
18410 NW 91st Ct, Hialeah, FL 33018
$-1,444
Cash flow
-13.1%
Cash-on-Cash Return
3.3%
Cap rate
0.6%
Rent to Value Ratio
Active
$400,000
3
bds
|
2
ba
|
1,320
sqft
|
built
1961
1940 NW 153rd St, Miami Gardens, FL 33054
$29
Cash flow
0.4%
Cash-on-Cash Return
6.4%
Cap rate
0.9%
Rent to Value Ratio
Active
$390,000
2
bds
|
2
ba
|
1,350
sqft
|
built
1969
500 Bayview Dr, Sunny Isles Beach, FL 33160
$-1,597
Cash flow
-21.4%
Cash-on-Cash Return
1.4%
Cap rate
0.8%
Rent to Value Ratio
Active
$255,000
2
bds
|
2
ba
|
1,070
sqft
|
built
1973
13499 Biscayne Blvd, North Miami, FL 33181
$-1,505
Cash flow
-30.8%
Cash-on-Cash Return
-0.8%
Cap rate
0.8%
Rent to Value Ratio
Active
$195,000
1
bds
|
2
ba
|
920
sqft
|
built
1978
28091 SW 143rd Ct, Homestead, FL 33033
$39
Cash flow
1.0%
Cash-on-Cash Return
6.5%
Cap rate
1.0%
Rent to Value Ratio