Miami Dade County Investment Properties for Sale
Browse homes for sale and investment properties in Miami Dade County. Refine your search by price, property type, or more.
Best cash flowing properties in Miami Dade County
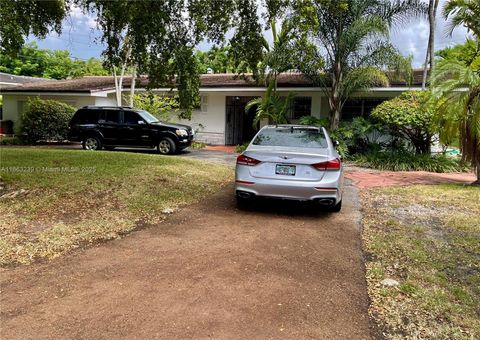
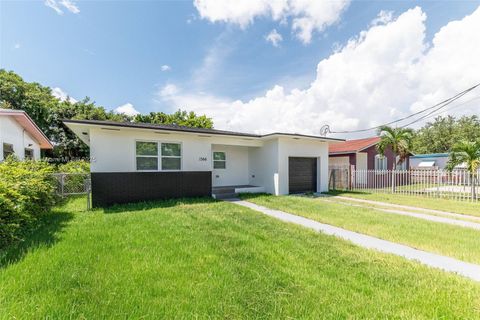
Active
$200,000
1
bds
|
1
ba
|
465
sqft
|
built
1973
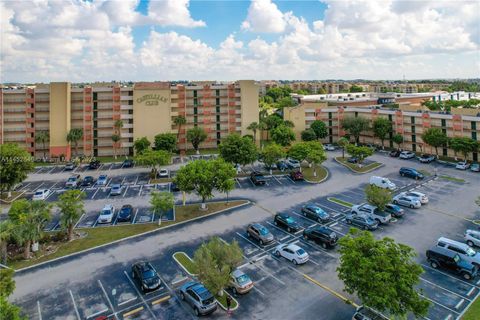
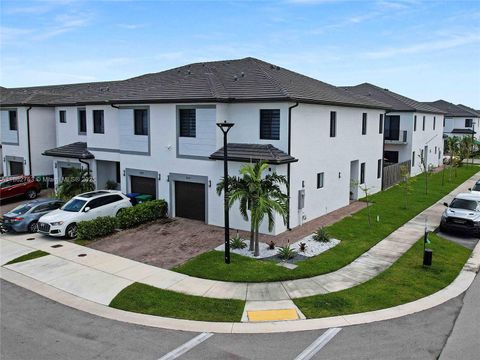
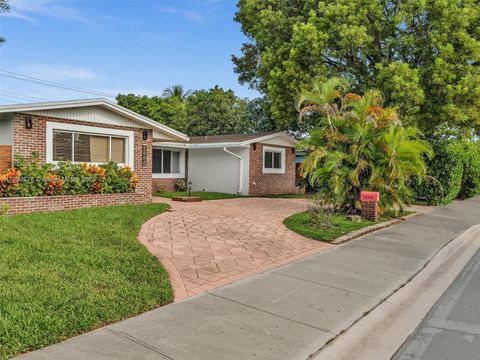
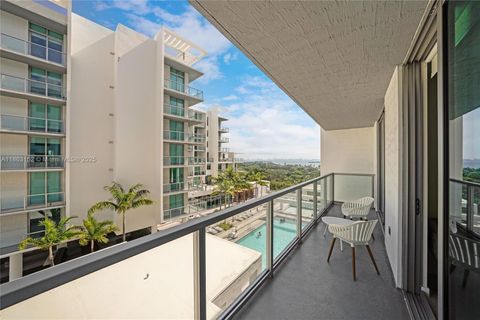
9405 W Flagler St, Miami, FL 33174
$-157
Cash flow
-4.1%
Cash-on-Cash Return
5.2%
Cap rate
0.9%
Rent to Value Ratio
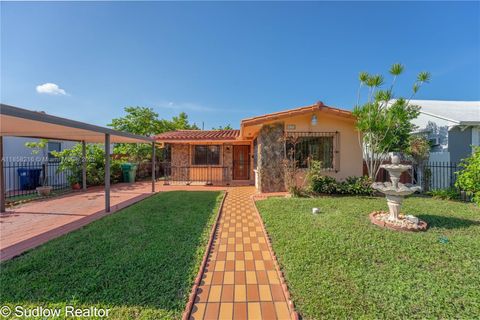
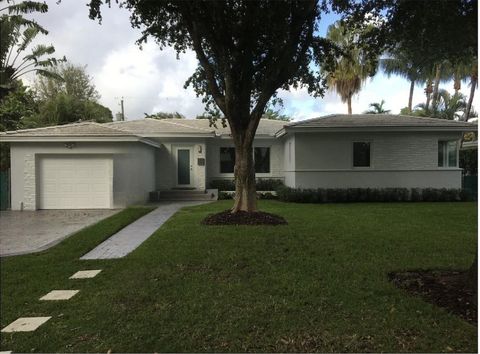
Active
$155,000
1
bds
|
2
ba
|
883
sqft
|
built
1972
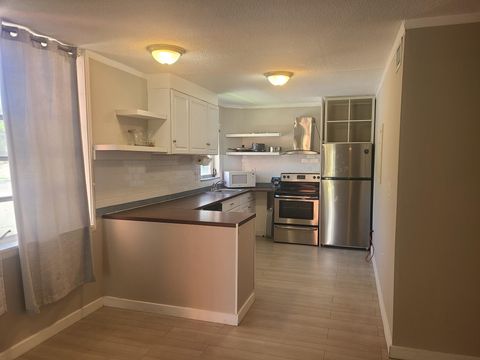
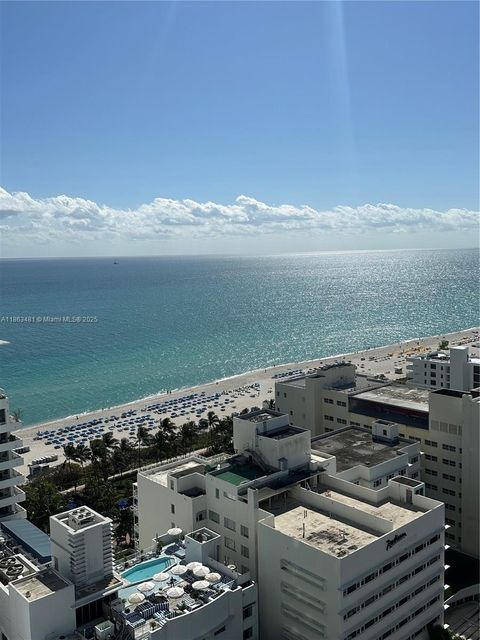
1700 NE 191st St, Miami, FL 33179
$-220
Cash flow
-7.4%
Cash-on-Cash Return
4.4%
Cap rate
1.2%
Rent to Value Ratio
9,916 out of 11,366 properties for sale in Miami Dade County
Limited Results Shown
Create a free account, or log in to reveal all property listings and enjoy the complete experience.
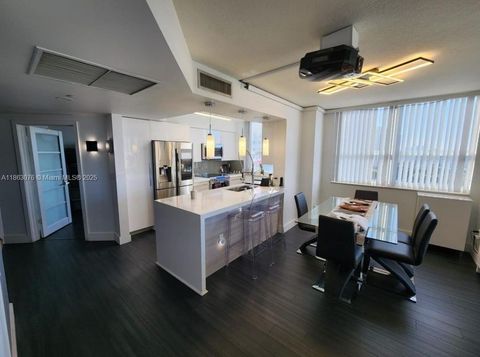
Active
$775,000
2
bds
|
2
ba
|
1,173
sqft
|
built
2019
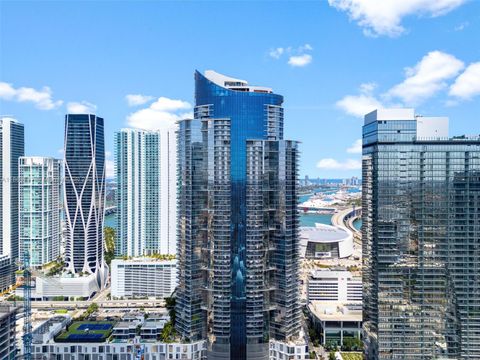
851 NE 1st Ave, Miami, FL 33132
$-3,472
Cash flow
-23.4%
Cash-on-Cash Return
0.8%
Cap rate
0.7%
Rent to Value Ratio
Active
$279,000
2
bds
|
2
ba
|
1,086
sqft
|
built
1975
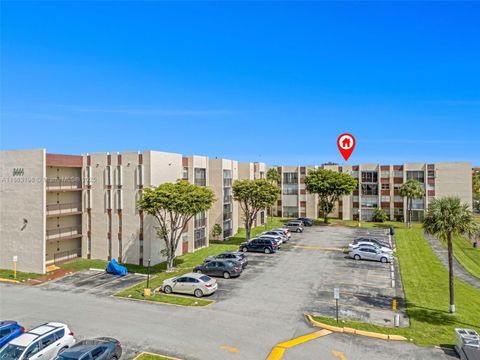
9441 SW 4th St, Miami, FL 33174
$-375
Cash flow
-7.0%
Cash-on-Cash Return
4.5%
Cap rate
0.9%
Rent to Value Ratio
Active
$699,000
4
bds
|
4
ba
|
2,254
sqft
|
built
2023
13663 SW 158th Ave, Miami, FL 33196
$-1,585
Cash flow
-11.8%
Cash-on-Cash Return
3.4%
Cap rate
0.6%
Rent to Value Ratio
Active
$520,000
2
bds
|
2
ba
|
821
sqft
|
built
2018
321 NE 26th St, Miami, FL 33137
$-1,947
Cash flow
-19.5%
Cash-on-Cash Return
1.7%
Cap rate
0.6%
Rent to Value Ratio
Active
$669,000
1
bds
|
1
ba
|
701
sqft
|
built
2014
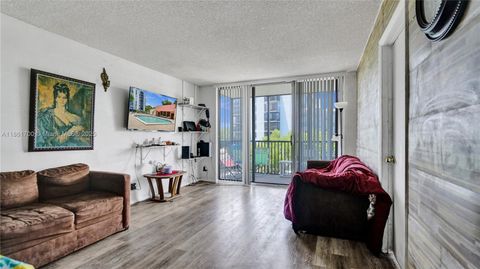
1300 Brickell Bay Dr, Miami, FL 33131
$-2,251
Cash flow
-17.6%
Cash-on-Cash Return
2.1%
Cap rate
0.6%
Rent to Value Ratio
Active
$2,725,000
2
bds
|
3
ba
|
1,900
sqft
|
built
2008
1100 West Ave, Miami Beach, FL 33139
$-15,367
Cash flow
-29.4%
Cash-on-Cash Return
-0.6%
Cap rate
0.3%
Rent to Value Ratio
Active
$530,000
2
bds
|
2
ba
|
1,245
sqft
|
built
2002
19501 W Country Club Dr, Aventura, FL 33180
$-1,840
Cash flow
-18.1%
Cash-on-Cash Return
2.0%
Cap rate
0.7%
Rent to Value Ratio
Active
$235,000
2
bds
|
2
ba
|
1,140
sqft
|
built
1969
1351 NE Miami Gardens Dr, Miami, FL 33179
$-476
Cash flow
-10.6%
Cash-on-Cash Return
3.7%
Cap rate
1.0%
Rent to Value Ratio
Active
$779,000
4
bds
|
3
ba
|
2,203
sqft
|
built
2000
14824 SW 180th St, Miami, FL 33187
$-1,638
Cash flow
-11.0%
Cash-on-Cash Return
3.6%
Cap rate
0.5%
Rent to Value Ratio
Active
$475,000
3
bds
|
2
ba
|
1,550
sqft
|
built
2003
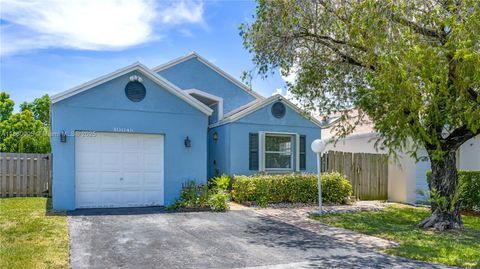
1417 SE 22nd Ln, Homestead, FL 33035
$-1,125
Cash flow
-12.4%
Cash-on-Cash Return
3.3%
Cap rate
0.7%
Rent to Value Ratio
Active
$1,225,000
4
bds
|
2
ba
|
1,789
sqft
|
built
1962
20350 Highland Lakes Blvd, Miami, FL 33179
$-3,463
Cash flow
-14.7%
Cash-on-Cash Return
2.8%
Cap rate
0.4%
Rent to Value Ratio
Active
$435,000
4
bds
|
3
ba
|
1,965
sqft
|
built
2006
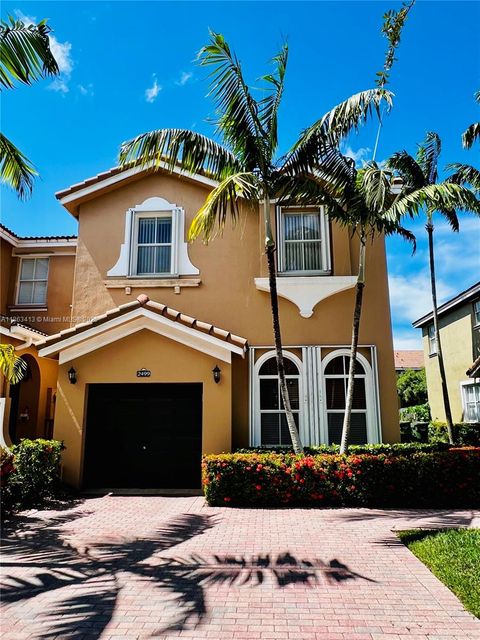
2499 SE 14th St, Homestead, FL 33035
$-571
Cash flow
-6.8%
Cash-on-Cash Return
4.6%
Cap rate
0.7%
Rent to Value Ratio
Active
$1,250,000
3
bds
|
3
ba
|
2,360
sqft
|
built
1982
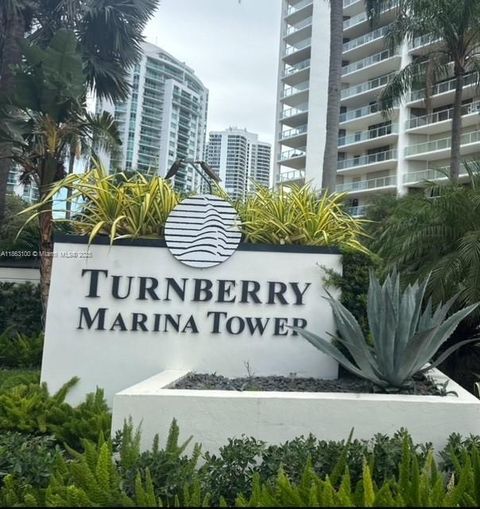
19500 Turnberry Way, Aventura, FL 33180
$-5,270
Cash flow
-22.0%
Cash-on-Cash Return
1.1%
Cap rate
0.6%
Rent to Value Ratio
Active
$980,000
3
bds
|
2
ba
|
2,400
sqft
|
built
1984
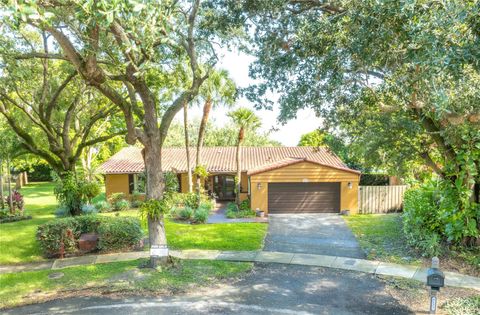
8635 Menteith Ter, Miami Lakes, FL 33016
$-2,412
Cash flow
-12.8%
Cash-on-Cash Return
3.2%
Cap rate
0.5%
Rent to Value Ratio
Active
$1,785,000
3
bds
|
3
ba
|
2,080
sqft
|
built
1956
1535 Mercado Ave, Coral Gables, FL 33146
$-5,232
Cash flow
-15.3%
Cash-on-Cash Return
2.6%
Cap rate
0.4%
Rent to Value Ratio
Active
$850,000
3
bds
|
2
ba
|
1,708
sqft
|
built
1972
4230 SW 10th St, Miami, FL 33134
$-781
Cash flow
-4.8%
Cash-on-Cash Return
5.0%
Cap rate
0.7%
Rent to Value Ratio
Active
$179,900
2
bds
|
2
ba
|
1,040
sqft
|
built
1989
2638 SE 20th Ct, Homestead, FL 33035
$-540
Cash flow
-15.7%
Cash-on-Cash Return
2.5%
Cap rate
1.1%
Rent to Value Ratio
Active
$485,000
4
bds
|
3
ba
|
1,927
sqft
|
built
2022
28626 SW 131st Ct, Homestead, FL 33033
$-1,075
Cash flow
-11.6%
Cash-on-Cash Return
3.5%
Cap rate
0.7%
Rent to Value Ratio
Active
$849,000
4
bds
|
3
ba
|
2,496
sqft
|
built
1986
11822 SW 108th Ter, Miami, FL 33186
$-2,093
Cash flow
-12.9%
Cash-on-Cash Return
3.2%
Cap rate
0.5%
Rent to Value Ratio
Active
$725,000
4
bds
|
3
ba
|
1,718
sqft
|
built
1987
10511 SW 147th Ct, Miami, FL 33196
$-2,210
Cash flow
-15.9%
Cash-on-Cash Return
2.5%
Cap rate
0.4%
Rent to Value Ratio
Active
$665,000
3
bds
|
1
ba
|
1,057
sqft
|
built
1954
3635 SW 95th Ave, Miami, FL 33165
$-1,425
Cash flow
-11.2%
Cash-on-Cash Return
3.6%
Cap rate
0.5%
Rent to Value Ratio
Active
$799,900
4
bds
|
3
ba
|
2,529
sqft
|
built
1989
15613 SW 55th Ter, Miami, FL 33185
$-1,830
Cash flow
-11.9%
Cash-on-Cash Return
3.4%
Cap rate
0.5%
Rent to Value Ratio
Active
$549,900
1
bds
|
1
ba
|
776
sqft
|
built
2019
3900 Biscayne Blvd, Miami, FL 33137
$-1,582
Cash flow
-15.0%
Cash-on-Cash Return
2.7%
Cap rate
0.8%
Rent to Value Ratio
Active
$890,000
bds
|
1
ba
|
526
sqft
|
built
2005
4401 Collins Ave, Miami Beach, FL 33140
$-3,614
Cash flow
-21.2%
Cash-on-Cash Return
1.3%
Cap rate
0.4%
Rent to Value Ratio
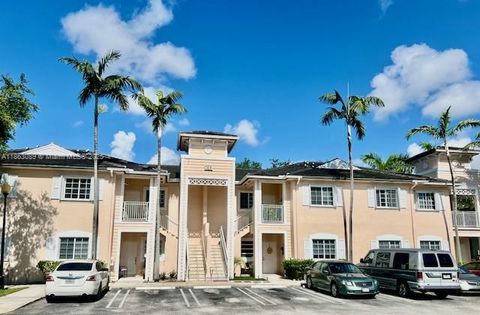
Active
$199,999
2
bds
|
2
ba
|
994
sqft
|
built
1972
3101 N Country Club Dr, Aventura, FL 33180
$-521
Cash flow
-13.6%
Cash-on-Cash Return
3.0%
Cap rate
1.3%
Rent to Value Ratio
Active
$509,000
3
bds
|
2
ba
|
1,211
sqft
|
built
1989
10048 SW 222nd St, Cutler Bay, FL 33190
$-1,343
Cash flow
-13.8%
Cash-on-Cash Return
3.0%
Cap rate
0.6%
Rent to Value Ratio
Active
$529,000
3
bds
|
2
ba
|
1,416
sqft
|
built
1964
1366 NW 75th St, Miami, FL 33147
$-1,563
Cash flow
-15.4%
Cash-on-Cash Return
2.6%
Cap rate
0.4%
Rent to Value Ratio
Active
$2,400,000
3
bds
|
2
ba
|
2,065
sqft
|
built
1952
555 NE 52nd St, Miami, FL 33137
$-8,337
Cash flow
-18.1%
Cash-on-Cash Return
2.0%
Cap rate
0.4%
Rent to Value Ratio

Active
$565,000
3
bds
|
2
ba
|
1,647
sqft
|
built
1980
11011 SW 162nd Ter, Miami, FL 33157
$-1,621
Cash flow
-15.0%
Cash-on-Cash Return
2.7%
Cap rate
0.5%
Rent to Value Ratio
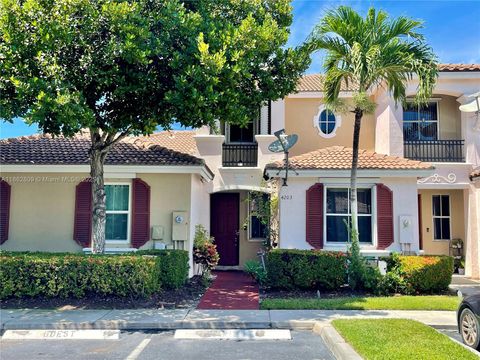
Active
$345,000
3
bds
|
3
ba
|
1,428
sqft
|
built
2004
4203 NE 22nd Dr, Homestead, FL 33033
$-499
Cash flow
-7.5%
Cash-on-Cash Return
4.4%
Cap rate
0.7%
Rent to Value Ratio
Active
$279,000
2
bds
|
2
ba
|
1,048
sqft
|
built
2007
364 NE 25th Pl, Homestead, FL 33033
$-538
Cash flow
-10.1%
Cash-on-Cash Return
3.8%
Cap rate
0.8%
Rent to Value Ratio

Active
$1,648,000
4
bds
|
4
ba
|
3,036
sqft
|
built
2004
8100 SW 179th St, Palmetto Bay, FL 33157
$-4,979
Cash flow
-15.8%
Cash-on-Cash Return
2.5%
Cap rate
0.4%
Rent to Value Ratio

Active
$625,000
4
bds
|
2
ba
|
1,568
sqft
|
built
1949
1321 NW 44th St, Miami, FL 33142
$-1,352
Cash flow
-11.3%
Cash-on-Cash Return
3.6%
Cap rate
0.5%
Rent to Value Ratio
Active
$429,000
2
bds
|
2
ba
|
1,666
sqft
|
built
1974
2801 NE 183rd St, Aventura, FL 33160
$-465
Cash flow
-5.7%
Cash-on-Cash Return
4.8%
Cap rate
0.7%
Rent to Value Ratio
Active
$1,350,000
3
bds
|
2
ba
|
1,663
sqft
|
built
1948
149 NW 89th St, El Portal, FL 33150
$-2,710
Cash flow
-10.5%
Cash-on-Cash Return
3.7%
Cap rate
0.7%
Rent to Value Ratio

Active
$275,000
2
bds
|
2
ba
|
985
sqft
|
built
1981
8415 SW 107th Ave, Miami, FL 33173
$-248
Cash flow
-4.7%
Cash-on-Cash Return
5.1%
Cap rate
0.9%
Rent to Value Ratio
Active
$3,300,000
4
bds
|
4
ba
|
3,764
sqft
|
built
1999
23400 SW 192nd Ave, Homestead, FL 33031
$-16,419
Cash flow
-26.0%
Cash-on-Cash Return
0.2%
Cap rate
0.1%
Rent to Value Ratio
Active
$950,000
1
bds
|
2
ba
|
1,260
sqft
|
built
1993
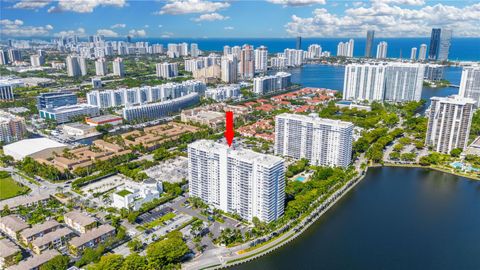
16445 Collins Ave, Sunny Isles Beach, FL 33160
$-2,845
Cash flow
-15.6%
Cash-on-Cash Return
2.6%
Cap rate
0.5%
Rent to Value Ratio