Miami Dade County Investment Properties for Sale
Browse homes for sale and investment properties in Miami Dade County. Refine your search by price, property type, or more.
Best cash flowing properties in Miami Dade County

Active
$249,000
2
bds
|
1
ba
|
837
sqft
|
built
1950
23100 SW 123rd Ave, Miami, FL 33170
$93
Cash flow
1.9%
Cash-on-Cash Return
6.6%
Cap rate
1.0%
Rent to Value Ratio
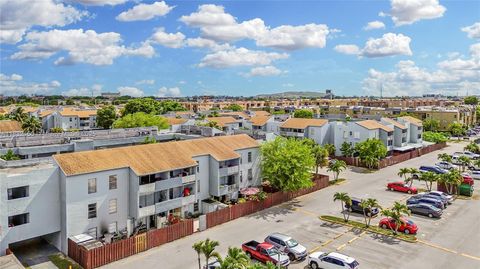
Active
$255,000
2
bds
|
2
ba
|
908
sqft
|
built
1972
1755 W 60th St, Hialeah, FL 33012
$-169
Cash flow
-3.5%
Cash-on-Cash Return
5.4%
Cap rate
0.9%
Rent to Value Ratio
10,000 out of 11,974 properties for sale in Miami Dade County
Limited Results Shown
Create a free account, or log in to reveal all property listings and enjoy the complete experience.
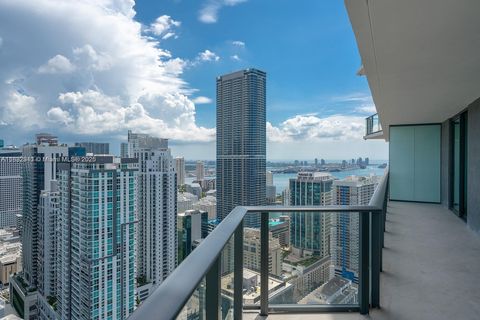
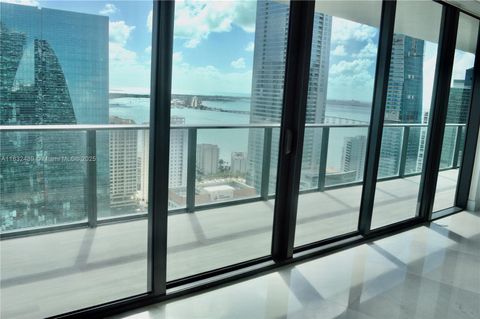
Active
$750,000
2
bds
|
2
ba
|
868
sqft
|
built
2016
1300 S Miami Ave, Miami, FL 33130
$-2,389
Cash flow
-16.6%
Cash-on-Cash Return
2.3%
Cap rate
0.7%
Rent to Value Ratio

Active
$1,090,000
2
bds
|
3
ba
|
1,143
sqft
|
built
2019
480 NE 31st St, Miami, FL 33137
$-4,769
Cash flow
-22.8%
Cash-on-Cash Return
0.9%
Cap rate
0.5%
Rent to Value Ratio

Active
$339,900
3
bds
|
2
ba
|
1,442
sqft
|
built
1969
8650 SW 109th Ave, Miami, FL 33173
$-924
Cash flow
-14.2%
Cash-on-Cash Return
2.9%
Cap rate
0.9%
Rent to Value Ratio

Active
$675,000
3
bds
|
3
ba
|
1,564
sqft
|
built
1971
20350 SW 182nd Ave, Miami, FL 33187
$-2,011
Cash flow
-15.5%
Cash-on-Cash Return
2.6%
Cap rate
0.4%
Rent to Value Ratio

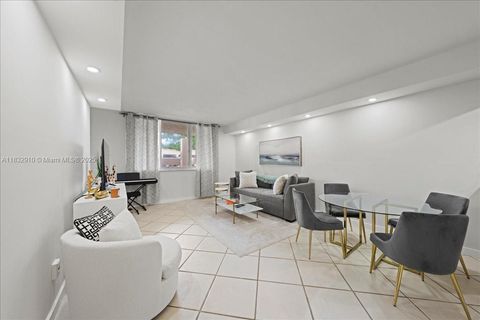
Active
$185,000
1
bds
|
1
ba
|
720
sqft
|
built
1973
16851 NE 23rd Ave, North Miami Beach, FL 33160
$-192
Cash flow
-5.4%
Cash-on-Cash Return
4.9%
Cap rate
1.0%
Rent to Value Ratio

Active
$19,950,000
5
bds
|
6
ba
|
5,818
sqft
|
built
1951
4539 Pine Tree Dr, Miami Beach, FL 33140
$-112,376
Cash flow
-29.4%
Cash-on-Cash Return
-0.6%
Cap rate
0.0%
Rent to Value Ratio

Active
$335,000
1
bds
|
2
ba
|
1,040
sqft
|
built
1976
200 178th Dr, Sunny Isles Beach, FL 33160
$-1,262
Cash flow
-19.7%
Cash-on-Cash Return
1.6%
Cap rate
0.7%
Rent to Value Ratio

Active
$689,000
3
bds
|
2
ba
|
1,155
sqft
|
built
1975
2550 SW 68th Ave, Miami, FL 33155
$-617
Cash flow
-4.7%
Cash-on-Cash Return
5.1%
Cap rate
0.7%
Rent to Value Ratio

Active
$1,099,000
3
bds
|
4
ba
|
1,785
sqft
|
built
2009
200 Sunny Isles Blvd, Sunny Isles Beach, FL 33160
$-2,783
Cash flow
-13.2%
Cash-on-Cash Return
3.1%
Cap rate
0.7%
Rent to Value Ratio

Active
$949,900
4
bds
|
3
ba
|
2,218
sqft
|
built
1958
8631 SW 16th Ter, Miami, FL 33155
$-1,075
Cash flow
-5.9%
Cash-on-Cash Return
4.8%
Cap rate
0.7%
Rent to Value Ratio

Active
$299,000
2
bds
|
2
ba
|
847
sqft
|
built
1972
3522 NE 171st St, North Miami Beach, FL 33160
$-578
Cash flow
-10.1%
Cash-on-Cash Return
3.8%
Cap rate
0.8%
Rent to Value Ratio
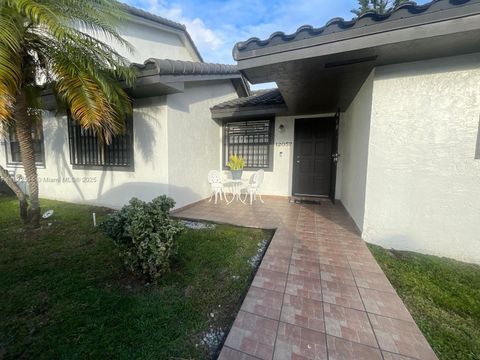
Active
$495,000
3
bds
|
2
ba
|
1,150
sqft
|
built
1987
12057 SW 10th St, Miami, FL 33184
$-1,148
Cash flow
-12.1%
Cash-on-Cash Return
3.4%
Cap rate
0.6%
Rent to Value Ratio
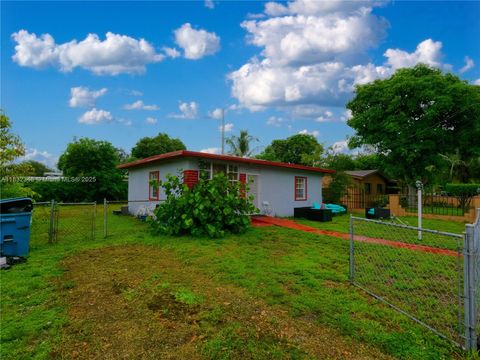
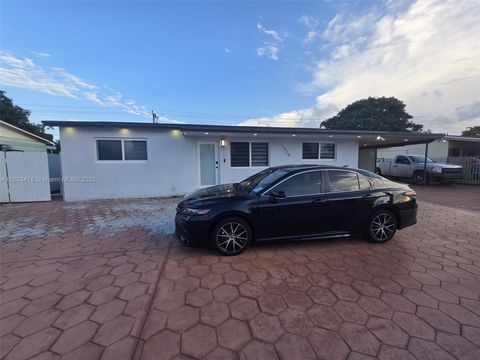
Active
$389,900
2
bds
|
1
ba
|
891
sqft
|
built
1947
1841 NW 86th Ter, Miami, FL 33147
$-743
Cash flow
-9.9%
Cash-on-Cash Return
3.9%
Cap rate
0.6%
Rent to Value Ratio

Active
$799,000
2
bds
|
2
ba
|
1,594
sqft
|
built
2007
700 NE 25th St, Miami, FL 33137
$-3,707
Cash flow
-24.2%
Cash-on-Cash Return
0.6%
Cap rate
0.6%
Rent to Value Ratio

Active
$215,000
1
bds
|
2
ba
|
740
sqft
|
built
1967
15201 NE 6th Ave, Miami, FL 33162
$-351
Cash flow
-8.5%
Cash-on-Cash Return
4.2%
Cap rate
0.9%
Rent to Value Ratio

Active
$229,900
1
bds
|
1
ba
|
769
sqft
|
built
1974
8895 Fontainebleau Blvd, Miami, FL 33172
$-363
Cash flow
-8.2%
Cash-on-Cash Return
4.3%
Cap rate
0.8%
Rent to Value Ratio

Active
$225,000
1
bds
|
2
ba
|
981
sqft
|
built
1982
20801 San Simeon Way, Miami, FL 33179
$-528
Cash flow
-12.2%
Cash-on-Cash Return
3.3%
Cap rate
0.8%
Rent to Value Ratio

Active
$2,150,000
4
bds
|
4
ba
|
2,580
sqft
|
built
1938
1548 Biarritz Dr, Miami Beach, FL 33141
$-7,998
Cash flow
-19.4%
Cash-on-Cash Return
1.7%
Cap rate
0.3%
Rent to Value Ratio

Active
$1,140,000
3
bds
|
2
ba
|
1,849
sqft
|
built
2009
150 Sunny Isles Blvd, Sunny Isles Beach, FL 33160
$-4,694
Cash flow
-21.5%
Cash-on-Cash Return
1.2%
Cap rate
0.6%
Rent to Value Ratio

Active
$250,000
2
bds
|
2
ba
|
1,023
sqft
|
built
1971
1800 Sans Souci Blvd, North Miami, FL 33181
$-873
Cash flow
-18.2%
Cash-on-Cash Return
2.0%
Cap rate
0.9%
Rent to Value Ratio
Active
$460,000
3
bds
|
2
ba
|
1,236
sqft
|
built
2019
8031 NW 104th Ave, Doral, FL 33178
$-1,535
Cash flow
-17.4%
Cash-on-Cash Return
2.1%
Cap rate
0.7%
Rent to Value Ratio

Active
$1,790,000
3
bds
|
4
ba
|
3,264
sqft
|
built
2004
20201 E Country Club Dr, Aventura, FL 33180
$-7,798
Cash flow
-22.7%
Cash-on-Cash Return
0.9%
Cap rate
0.5%
Rent to Value Ratio

Active
$430,000
3
bds
|
3
ba
|
1,801
sqft
|
built
2007
14951 Royal Oaks Ln, North Miami, FL 33181
$-1,402
Cash flow
-17.0%
Cash-on-Cash Return
2.2%
Cap rate
1.0%
Rent to Value Ratio

Active
$350,000
1
bds
|
1
ba
|
610
sqft
|
built
1947
1611 Euclid Ave, Miami Beach, FL 33139
$-1,160
Cash flow
-17.3%
Cash-on-Cash Return
2.2%
Cap rate
0.6%
Rent to Value Ratio
Active
$385,000
2
bds
|
2
ba
|
1,067
sqft
|
built
2004
816 NW 11th St, Miami, FL 33136
$-1,262
Cash flow
-17.1%
Cash-on-Cash Return
2.2%
Cap rate
0.7%
Rent to Value Ratio

Active
$1,400,000
2
bds
|
2
ba
|
1,128
sqft
|
built
2010
2020 N Bayshore Dr, Miami, FL 33137
$-6,310
Cash flow
-23.5%
Cash-on-Cash Return
0.7%
Cap rate
0.4%
Rent to Value Ratio

Active
$1,699,000
3
bds
|
4
ba
|
1,526
sqft
|
built
2018
3131 NE 7th Ave, Miami, FL 33137
$-222,575
Cash flow
-683.5%
Cash-on-Cash Return
-151.1%
Cap rate
0.6%
Rent to Value Ratio

Active
$1,100,000
2
bds
|
3
ba
|
1,137
sqft
|
built
2017
2900 NE 7th Ave, Miami, FL 33137
$-4,277
Cash flow
-20.3%
Cash-on-Cash Return
1.5%
Cap rate
0.6%
Rent to Value Ratio

Active
$698,000
3
bds
|
3
ba
|
2,490
sqft
|
built
2002
10700 NW 66th St, Doral, FL 33178
$-2,510
Cash flow
-18.8%
Cash-on-Cash Return
1.8%
Cap rate
0.6%
Rent to Value Ratio

Active
$420,000
2
bds
|
2
ba
|
1,050
sqft
|
built
2018
2651 NE 212th Ter, Aventura, FL 33180
$-1,042
Cash flow
-12.9%
Cash-on-Cash Return
3.2%
Cap rate
0.7%
Rent to Value Ratio
Active
$4,490,000
5
bds
|
6
ba
|
3,398
sqft
|
built
2008
900 Brickell Key Blvd, Miami, FL 33131
$-28,341
Cash flow
-32.9%
Cash-on-Cash Return
-1.4%
Cap rate
0.2%
Rent to Value Ratio

Active
$2,259,000
4
bds
|
2
ba
|
4,296
sqft
|
built
1979
14025 SW 208th St, Miami, FL 33177
$-5,171
Cash flow
-11.9%
Cash-on-Cash Return
3.4%
Cap rate
0.4%
Rent to Value Ratio

Active
$480,000
1
bds
|
2
ba
|
900
sqft
|
built
1968
5700 Collins Ave, Miami Beach, FL 33140
$-2,083
Cash flow
-22.6%
Cash-on-Cash Return
0.9%
Cap rate
0.6%
Rent to Value Ratio
Active
$495,000
2
bds
|
2
ba
|
1,129
sqft
|
built
2019
4670 NW 84th Ave, Doral, FL 33166
$-1,749
Cash flow
-18.4%
Cash-on-Cash Return
1.9%
Cap rate
0.6%
Rent to Value Ratio

Active
$499,999
1
bds
|
0
ba
|
973
sqft
|
built
1948
5158 NW 19th Ave, Miami, FL 33142
$-1,818
Cash flow
-19.0%
Cash-on-Cash Return
1.8%
Cap rate
0.3%
Rent to Value Ratio
Active
$985,000
2
bds
|
2
ba
|
1,279
sqft
|
built
2016
1300 S Miami Ave, Miami, FL 33130
$-3,686
Cash flow
-19.5%
Cash-on-Cash Return
1.7%
Cap rate
0.7%
Rent to Value Ratio
Active
$329,900
1
bds
|
2
ba
|
700
sqft
|
built
1991
540 Brickell Key Dr, Miami, FL 33131
$-2,234
Cash flow
-35.3%
Cash-on-Cash Return
-2.0%
Cap rate
0.8%
Rent to Value Ratio
Active
$630,000
3
bds
|
2
ba
|
1,303
sqft
|
built
1958
1320 NW 179th Ter, Miami Gardens, FL 33169
$-1,267
Cash flow
-10.5%
Cash-on-Cash Return
3.7%
Cap rate
0.6%
Rent to Value Ratio