Miami Dade County Investment Properties for Sale
Browse homes for sale and investment properties in Miami Dade County. Refine your search by price, property type, or more.
Best cash flowing properties in Miami Dade County

Active
$435,000
3
bds
|
2
ba
|
1,302
sqft
|
built
1976
5571 NW 194th Ln, Miami Gardens, FL 33055
$-407
Cash flow
-4.9%
Cash-on-Cash Return
5.0%
Cap rate
0.7%
Rent to Value Ratio
Active
$284,500
2
bds
|
2
ba
|
918
sqft
|
built
1972
7204 Fairway Dr, Miami Lakes, FL 33014
$-510
Cash flow
-9.4%
Cash-on-Cash Return
4.0%
Cap rate
0.8%
Rent to Value Ratio
9,870 out of 11,316 properties for sale in Miami Dade County
Limited Results Shown
Create a free account, or log in to reveal all property listings and enjoy the complete experience.
Active
$239,999
2
bds
|
1
ba
|
1,035
sqft
|
built
1973
6930 NW 186th St, Hialeah, FL 33015
$-657
Cash flow
-14.3%
Cash-on-Cash Return
2.9%
Cap rate
0.9%
Rent to Value Ratio

Active
$599,900
5
bds
|
4
ba
|
3,187
sqft
|
built
2018
4152 NE 20th St, Homestead, FL 33033
$-1,276
Cash flow
-11.1%
Cash-on-Cash Return
3.6%
Cap rate
0.7%
Rent to Value Ratio
Active
$434,900
3
bds
|
3
ba
|
1,612
sqft
|
built
2022
11815 SW 247th Ter, Homestead, FL 33032
$-1,124
Cash flow
-13.5%
Cash-on-Cash Return
3.0%
Cap rate
0.7%
Rent to Value Ratio

Active
$530,000
2
bds
|
2
ba
|
1,316
sqft
|
built
2001
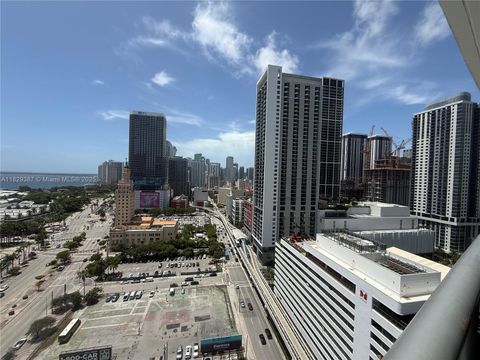
2811 NE 185th St, Miami, FL 33180
$-2,022
Cash flow
-19.9%
Cash-on-Cash Return
1.6%
Cap rate
0.7%
Rent to Value Ratio

Active
$14,550,000
6
bds
|
7
ba
|
5,145
sqft
|
built
2020
1410 S Biscayne Point Rd, Miami Beach, FL 33141
$-69,954
Cash flow
-25.1%
Cash-on-Cash Return
0.4%
Cap rate
0.1%
Rent to Value Ratio

Active
$3,999,000
3
bds
|
3
ba
|
1,950
sqft
|
built
1952
1865 Keystone Blvd, North Miami, FL 33181
$-16,043
Cash flow
-20.9%
Cash-on-Cash Return
1.3%
Cap rate
0.2%
Rent to Value Ratio
Active
$599,000
1
bds
|
2
ba
|
653
sqft
|
built
2014
1300 Brickell Bay Dr, Miami, FL 33131
$-2,022
Cash flow
-17.6%
Cash-on-Cash Return
2.1%
Cap rate
0.6%
Rent to Value Ratio

Active
$750,000
4
bds
|
2
ba
|
2,153
sqft
|
built
1980
14861 SW 149th St, Miami, FL 33196
$-2,086
Cash flow
-14.5%
Cash-on-Cash Return
2.8%
Cap rate
0.5%
Rent to Value Ratio

Active
$280,000
3
bds
|
2
ba
|
1,185
sqft
|
built
1983
20065 NE 3rd Ct, Miami, FL 33179
$-632
Cash flow
-11.8%
Cash-on-Cash Return
3.4%
Cap rate
0.9%
Rent to Value Ratio
Active
$650,000
2
bds
|
2
ba
|
1,315
sqft
|
built
2008
888 Biscayne Blvd, Miami, FL 33132
$-1,994
Cash flow
-16.0%
Cash-on-Cash Return
2.5%
Cap rate
0.8%
Rent to Value Ratio

Active
$719,900
4
bds
|
2
ba
|
1,797
sqft
|
built
2004
20233 SW 128th Pl, Miami, FL 33177
$-1,568
Cash flow
-11.4%
Cash-on-Cash Return
3.5%
Cap rate
0.5%
Rent to Value Ratio

Active
$475,000
4
bds
|
2
ba
|
1,419
sqft
|
built
1958
18005 NW 7th Ave, Miami Gardens, FL 33169
$-837
Cash flow
-9.2%
Cash-on-Cash Return
4.0%
Cap rate
0.7%
Rent to Value Ratio

Active
$539,900
4
bds
|
3
ba
|
1,896
sqft
|
built
2021
13370 SW 284th St, Homestead, FL 33033
$-1,396
Cash flow
-13.5%
Cash-on-Cash Return
3.0%
Cap rate
0.6%
Rent to Value Ratio
Active
$335,000
3
bds
|
3
ba
|
1,182
sqft
|
built
1985
5350 W 26th Ave, Hialeah, FL 33016
$-523
Cash flow
-8.1%
Cash-on-Cash Return
4.3%
Cap rate
0.8%
Rent to Value Ratio

Active
$780,000
3
bds
|
2
ba
|
2,387
sqft
|
built
1992
14240 SW 19th Ter, Miami, FL 33175
$-2,181
Cash flow
-14.6%
Cash-on-Cash Return
2.8%
Cap rate
0.5%
Rent to Value Ratio

Active
$1,590,000
2
bds
|
3
ba
|
1,962
sqft
|
built
2008
16001 Collins Ave, Sunny Isles Beach, FL 33160
$-6,625
Cash flow
-21.7%
Cash-on-Cash Return
1.1%
Cap rate
0.5%
Rent to Value Ratio
Active
$448,500
2
bds
|
2
ba
|
910
sqft
|
built
1990
1280 S Alhambra Cir, Coral Gables, FL 33146
$-1,443
Cash flow
-16.8%
Cash-on-Cash Return
2.3%
Cap rate
0.7%
Rent to Value Ratio
Active
$7,700,000
6
bds
|
8
ba
|
7,400
sqft
|
built
2002
10851 SW 63rd Ave, Pinecrest, FL 33156
$-36,546
Cash flow
-24.8%
Cash-on-Cash Return
0.5%
Cap rate
0.1%
Rent to Value Ratio

Active
$395,000
2
bds
|
2
ba
|
902
sqft
|
built
1925
1559 Michigan Ave, Miami Beach, FL 33139
$-1,146
Cash flow
-15.1%
Cash-on-Cash Return
2.7%
Cap rate
0.7%
Rent to Value Ratio
Active
$1,125,000
2
bds
|
3
ba
|
1,283
sqft
|
built
2017
1010 Brickell Ave, Miami, FL 33131
$-4,343
Cash flow
-20.1%
Cash-on-Cash Return
1.5%
Cap rate
0.6%
Rent to Value Ratio

Active
$629,000
2
bds
|
2
ba
|
972
sqft
|
built
2018
121 NE 34th St, Miami, FL 33137
$-2,570
Cash flow
-21.3%
Cash-on-Cash Return
1.2%
Cap rate
0.7%
Rent to Value Ratio

Active
$1,099,000
3
bds
|
2
ba
|
1,860
sqft
|
built
1967
8200 SW 164th St, Palmetto Bay, FL 33157
$-3,295
Cash flow
-15.6%
Cash-on-Cash Return
2.5%
Cap rate
0.4%
Rent to Value Ratio
Active
$1,775,000
2
bds
|
2
ba
|
1,496
sqft
|
built
1969
609 Ocean Dr, Key Biscayne, FL 33149
$-7,203
Cash flow
-21.2%
Cash-on-Cash Return
1.3%
Cap rate
0.4%
Rent to Value Ratio

Active
$1,199,000
4
bds
|
4
ba
|
2,920
sqft
|
built
2017
10218 NW 76th Ter, Doral, FL 33178
$-2,251
Cash flow
-9.8%
Cash-on-Cash Return
3.9%
Cap rate
0.7%
Rent to Value Ratio

Active
$1,425,000
5
bds
|
4
ba
|
2,122
sqft
|
built
1976
14400 NE 4th Ave, Miami, FL 33161
$-2,684
Cash flow
-9.8%
Cash-on-Cash Return
3.9%
Cap rate
0.6%
Rent to Value Ratio

Active
$760,000
3
bds
|
2
ba
|
1,723
sqft
|
built
1990
14480 SW 112th St, Miami, FL 33186
$-1,873
Cash flow
-12.9%
Cash-on-Cash Return
3.2%
Cap rate
0.5%
Rent to Value Ratio

Active
$600,000
2
bds
|
2
ba
|
837
sqft
|
built
2018
481 NE 29th St, Miami, FL 33137
$-1,956
Cash flow
-17.0%
Cash-on-Cash Return
2.2%
Cap rate
0.6%
Rent to Value Ratio

Active
$980,000
4
bds
|
3
ba
|
2,351
sqft
|
built
2004
6102 SW 159th Ct, Miami, FL 33193
$-2,486
Cash flow
-13.2%
Cash-on-Cash Return
3.1%
Cap rate
0.4%
Rent to Value Ratio
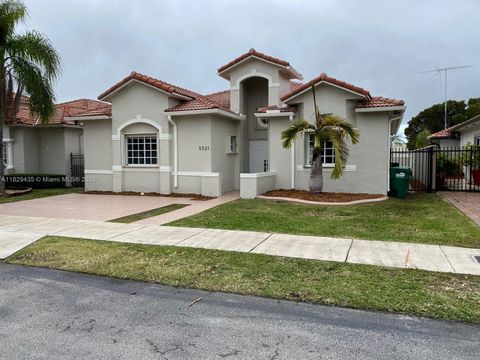
Active
$635,000
3
bds
|
2
ba
|
1,608
sqft
|
built
1998
5521 SW 158th Ct, Miami, FL 33185
$-1,387
Cash flow
-11.4%
Cash-on-Cash Return
3.5%
Cap rate
0.6%
Rent to Value Ratio
Active
$1,100,000
4
bds
|
2
ba
|
1,880
sqft
|
built
1969
16225 SW 88th Avenue Rd, Palmetto Bay, FL 33157
$-2,810
Cash flow
-13.3%
Cash-on-Cash Return
3.1%
Cap rate
0.5%
Rent to Value Ratio
Active
$464,000
4
bds
|
3
ba
|
2,016
sqft
|
built
2006
11266 SW 236th Ln, Homestead, FL 33032
$-1,008
Cash flow
-11.3%
Cash-on-Cash Return
3.5%
Cap rate
0.7%
Rent to Value Ratio

Active
$618,000
3
bds
|
2
ba
|
880
sqft
|
built
1954
1401 NE 178th St, North Miami Beach, FL 33162
$-1,906
Cash flow
-16.1%
Cash-on-Cash Return
2.4%
Cap rate
0.5%
Rent to Value Ratio

Active
$239,900
1
bds
|
2
ba
|
913
sqft
|
built
1975
20379 W Country Club Dr, Aventura, FL 33180
$-545
Cash flow
-11.9%
Cash-on-Cash Return
3.4%
Cap rate
1.0%
Rent to Value Ratio

Active
$1,149,000
2
bds
|
2
ba
|
1,322
sqft
|
built
2004
6365 Collins Ave, Miami Beach, FL 33141
$-4,962
Cash flow
-22.5%
Cash-on-Cash Return
1.0%
Cap rate
0.5%
Rent to Value Ratio
Active
$825,000
4
bds
|
3
ba
|
2,382
sqft
|
built
2013
18203 SW 152nd Pl, Miami, FL 33187
$-1,599
Cash flow
-10.1%
Cash-on-Cash Return
3.8%
Cap rate
0.5%
Rent to Value Ratio

Active
$900,000
4
bds
|
3
ba
|
2,733
sqft
|
built
2004
14432 SW 38th Ln, Miami, FL 33175
$-2,344
Cash flow
-13.6%
Cash-on-Cash Return
3.0%
Cap rate
0.5%
Rent to Value Ratio

Active
$560,000
2
bds
|
2
ba
|
1,945
sqft
|
built
1989
3700 Island Blvd, Aventura, FL 33160
$-2,423
Cash flow
-22.6%
Cash-on-Cash Return
1.0%
Cap rate
1.0%
Rent to Value Ratio
Active
$555,000
4
bds
|
2
ba
|
1,365
sqft
|
built
1986
19926 NW 67th Pl, Hialeah, FL 33015
$-943
Cash flow
-8.9%
Cash-on-Cash Return
4.1%
Cap rate
0.6%
Rent to Value Ratio