Miami Dade County Investment Properties for Sale
Browse homes for sale and investment properties in Miami Dade County. Refine your search by price, property type, or more.
Best cash flowing properties in Miami Dade County
Active
$126,900
1
bds
|
1
ba
|
705
sqft
|
built
2008
5300 NW 87th Ave, Doral, FL 33178
$-357
Cash flow
-14.7%
Cash-on-Cash Return
2.8%
Cap rate
1.7%
Rent to Value Ratio
Active
$1,190,000
4
bds
|
4
ba
|
2,193
sqft
|
built
1966
15201 SW 87th Ct, Palmetto Bay, FL 33157
$-426
Cash flow
-1.9%
Cash-on-Cash Return
5.7%
Cap rate
0.7%
Rent to Value Ratio
10,000 out of 12,464 properties for sale in Miami Dade County
Limited Results Shown
Create a free account, or log in to reveal all property listings and enjoy the complete experience.
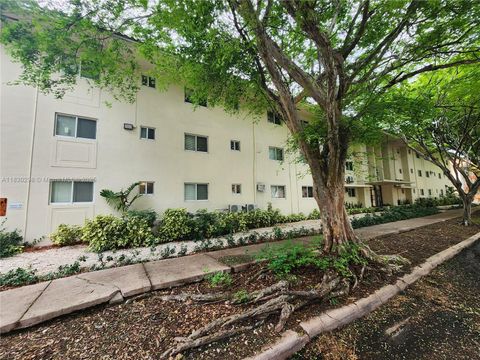
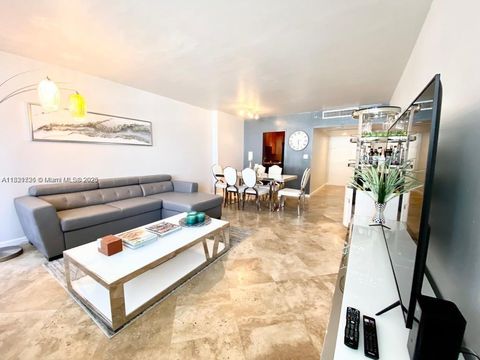
Active
$585,000
2
bds
|
3
ba
|
0
sqft
|
built
2016
1010 SW 2nd Ave, Miami, FL 33130
$-1,606
Cash flow
-14.3%
Cash-on-Cash Return
2.9%
Cap rate
0.7%
Rent to Value Ratio
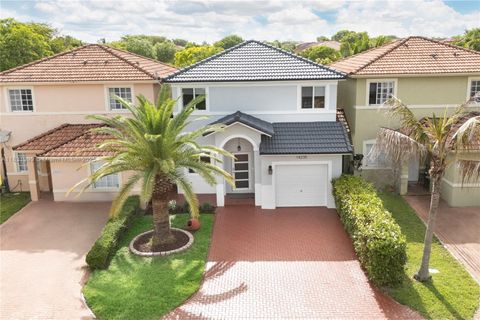
Active
$400,000
3
bds
|
2
ba
|
1,565
sqft
|
built
1979
10114 NW 4th Ln, Miami, FL 33172
$-946
Cash flow
-12.3%
Cash-on-Cash Return
3.3%
Cap rate
0.8%
Rent to Value Ratio
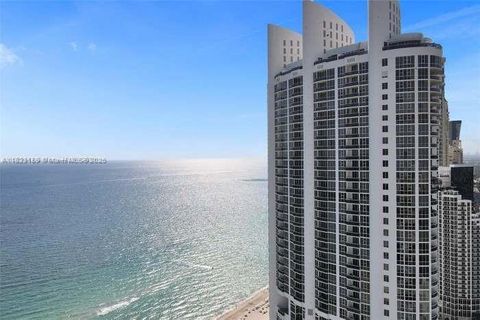
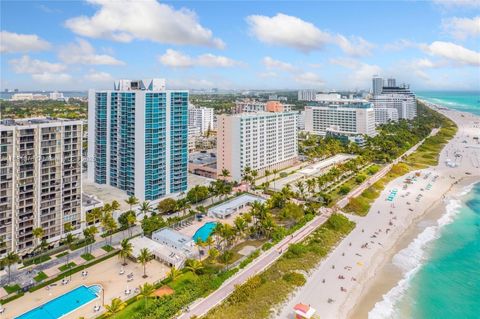
Active
$1,675,000
2
bds
|
4
ba
|
1,499
sqft
|
built
2008
18201 Collins Ave, Sunny Isles Beach, FL 33160
$-7,250
Cash flow
-22.6%
Cash-on-Cash Return
1.0%
Cap rate
0.4%
Rent to Value Ratio
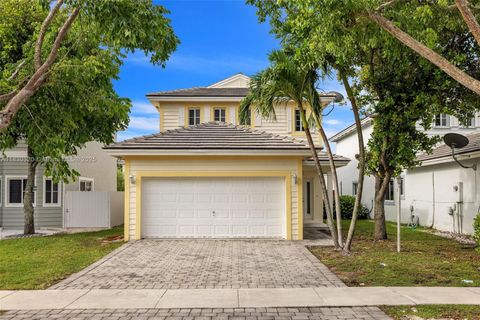
Active
$710,000
4
bds
|
4
ba
|
2,433
sqft
|
built
2016
3274 W 96th Pl, Hialeah, FL 33018
$-1,881
Cash flow
-13.8%
Cash-on-Cash Return
3.0%
Cap rate
0.5%
Rent to Value Ratio
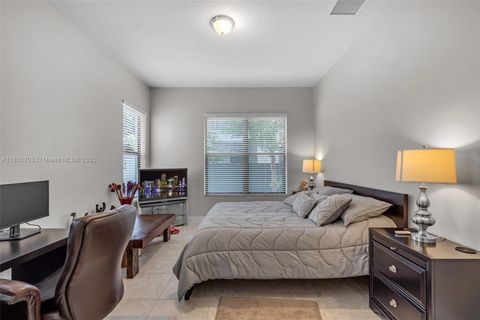
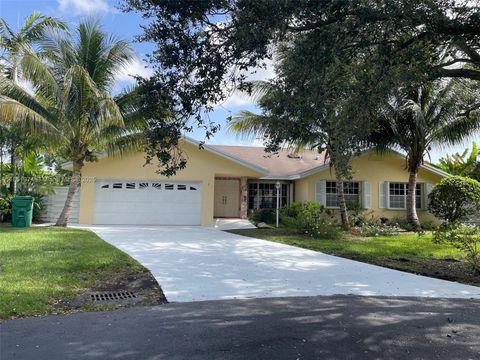
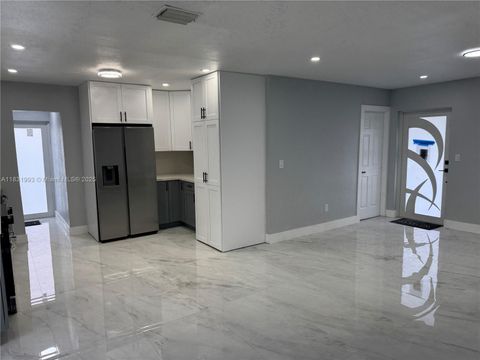
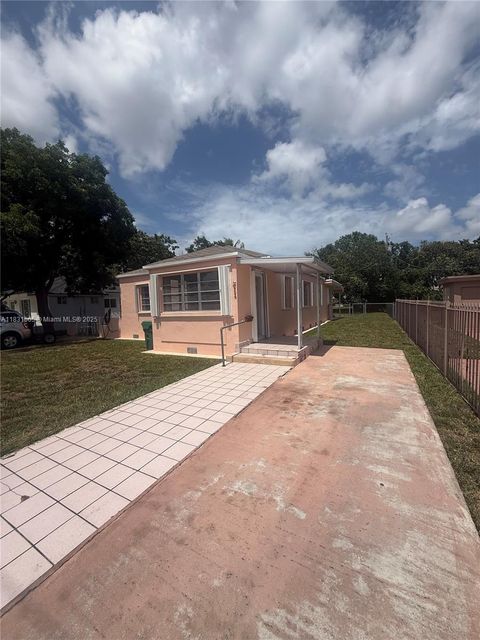
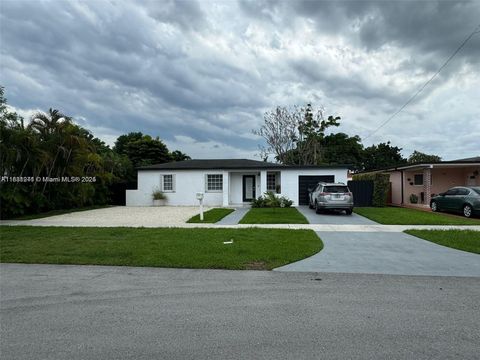
Active
$470,000
5
bds
|
3
ba
|
2,170
sqft
|
built
2006
3156 NE 4th St, Homestead, FL 33033
$-1,107
Cash flow
-12.3%
Cash-on-Cash Return
3.3%
Cap rate
0.7%
Rent to Value Ratio
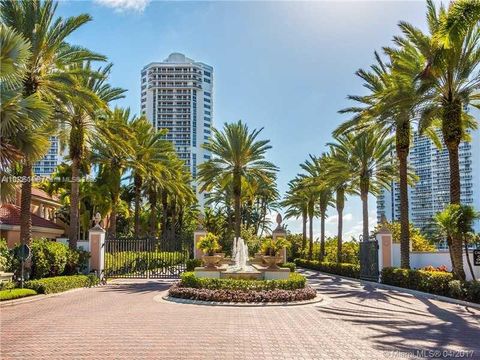
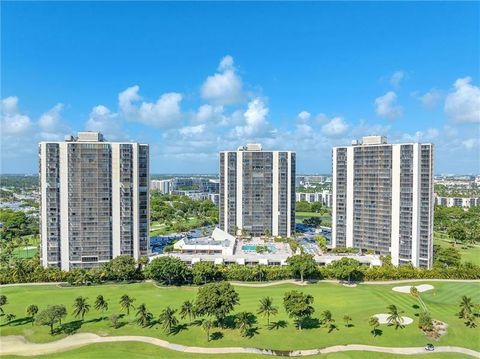
Active
$899,000
2
bds
|
3
ba
|
2,370
sqft
|
built
1991
3802 NE 207th St, Aventura, FL 33180
$-3,156
Cash flow
-18.3%
Cash-on-Cash Return
1.9%
Cap rate
0.8%
Rent to Value Ratio
Active
$222,000
1
bds
|
1
ba
|
410
sqft
|
built
1963
1014 Salzedo St, Coral Gables, FL 33134
$-470
Cash flow
-11.0%
Cash-on-Cash Return
3.6%
Cap rate
0.8%
Rent to Value Ratio
Active
$550,000
3
bds
|
2
ba
|
1,624
sqft
|
built
2000
14235 SW 133rd Ct, Miami, FL 33186
$-969
Cash flow
-9.2%
Cash-on-Cash Return
4.0%
Cap rate
0.6%
Rent to Value Ratio
Active
$775,000
4
bds
|
3
ba
|
2,795
sqft
|
built
1992
14409 SW 141st Pl, Miami, FL 33186
$-1,945
Cash flow
-13.1%
Cash-on-Cash Return
3.1%
Cap rate
0.5%
Rent to Value Ratio
Active
$559,900
3
bds
|
2
ba
|
1,056
sqft
|
built
1960
14621 SW 106th Ave, Miami, FL 33176
$-1,633
Cash flow
-15.2%
Cash-on-Cash Return
2.6%
Cap rate
0.5%
Rent to Value Ratio
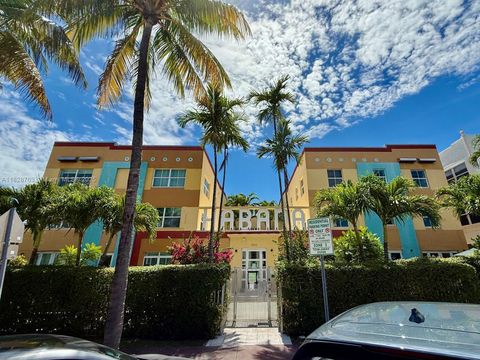
Active
$430,000
2
bds
|
2
ba
|
660
sqft
|
built
1926
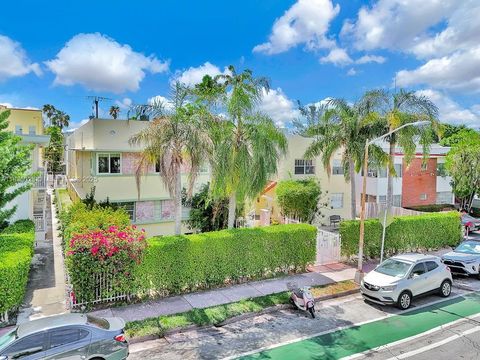
1337 Euclid Ave, Miami Beach, FL 33139
$-1,291
Cash flow
-15.7%
Cash-on-Cash Return
2.5%
Cap rate
0.7%
Rent to Value Ratio
Active
$749,900
4
bds
|
2
ba
|
1,300
sqft
|
built
1947
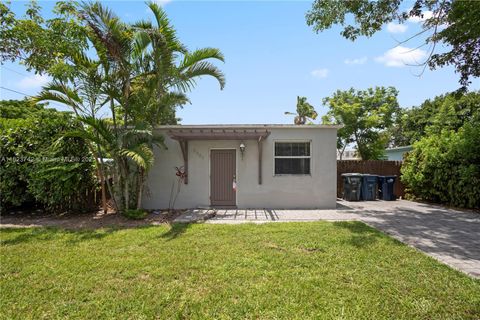
5900 SW 62nd Ter, South Miami, FL 33143
$-2,875
Cash flow
-20.0%
Cash-on-Cash Return
1.5%
Cap rate
0.3%
Rent to Value Ratio
Active
$850,000
3
bds
|
3
ba
|
2,020
sqft
|
built
2006
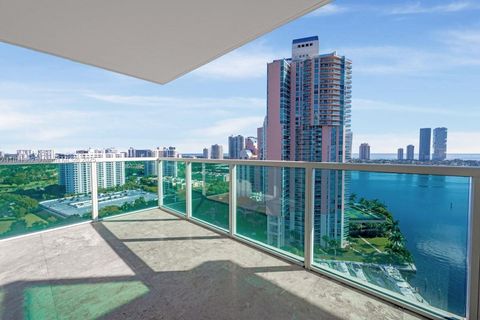
3330 NE 190th St, Aventura, FL 33180
$-4,006
Cash flow
-24.6%
Cash-on-Cash Return
0.5%
Cap rate
0.5%
Rent to Value Ratio
Active
$1,999,000
4
bds
|
3
ba
|
2,941
sqft
|
built
1974
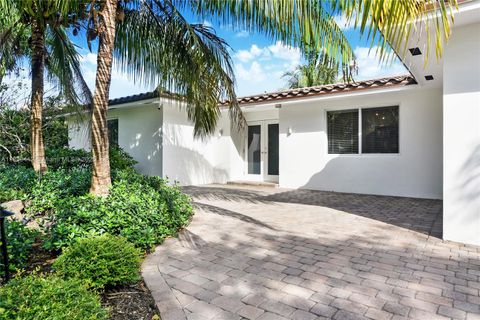
20701 NE 21st Ct, Miami, FL 33179
$-5,405
Cash flow
-14.1%
Cash-on-Cash Return
2.9%
Cap rate
0.5%
Rent to Value Ratio
Active
$259,900
2
bds
|
2
ba
|
1,186
sqft
|
built
1966
11685 Canal Dr, North Miami, FL 33181
$-440
Cash flow
-8.8%
Cash-on-Cash Return
4.1%
Cap rate
0.9%
Rent to Value Ratio
Active
$235,000
1
bds
|
1
ba
|
715
sqft
|
built
1969
7725 SW 86th St, Miami, FL 33143
$-688
Cash flow
-15.3%
Cash-on-Cash Return
2.6%
Cap rate
0.8%
Rent to Value Ratio
Active
$610,000
2
bds
|
4
ba
|
1,555
sqft
|
built
1965
1075 92nd St, Bay Harbor Islands, FL 33154
$-2,118
Cash flow
-18.1%
Cash-on-Cash Return
2.0%
Cap rate
0.6%
Rent to Value Ratio
Active
$928,000
2
bds
|
3
ba
|
1,143
sqft
|
built
2019
480 NE 31st St, Miami, FL 33137
$-3,587
Cash flow
-20.2%
Cash-on-Cash Return
1.5%
Cap rate
0.6%
Rent to Value Ratio
Active
$550,000
1
bds
|
1
ba
|
865
sqft
|
built
1965
100 Lincoln Rd, Miami Beach, FL 33139
$-1,422
Cash flow
-13.5%
Cash-on-Cash Return
3.0%
Cap rate
0.8%
Rent to Value Ratio
Active
$510,000
2
bds
|
2
ba
|
1,122
sqft
|
built
1975
2655 Collins Ave, Miami Beach, FL 33140
$-2,192
Cash flow
-22.4%
Cash-on-Cash Return
1.0%
Cap rate
0.6%
Rent to Value Ratio
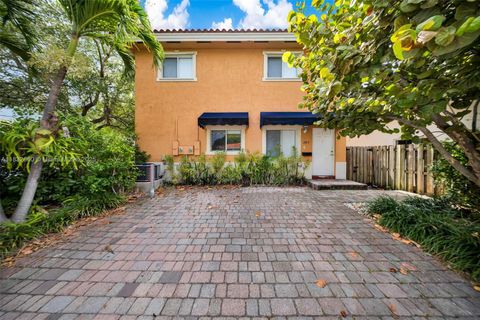
Active
$599,000
3
bds
|
2
ba
|
1,384
sqft
|
built
1944
511 NW 33rd Ave, Miami, FL 33125
$-1,180
Cash flow
-10.3%
Cash-on-Cash Return
3.8%
Cap rate
0.6%
Rent to Value Ratio
Active
$299,900
2
bds
|
2
ba
|
1,138
sqft
|
built
1975
20301 W Country Club Dr, Aventura, FL 33180
$-687
Cash flow
-12.0%
Cash-on-Cash Return
3.4%
Cap rate
0.9%
Rent to Value Ratio
Active
$775,000
3
bds
|
2
ba
|
2,308
sqft
|
built
1986
19621 SW 78th Ct, Cutler Bay, FL 33189
$-2,191
Cash flow
-14.8%
Cash-on-Cash Return
2.8%
Cap rate
0.5%
Rent to Value Ratio
Active
$310,000
2
bds
|
2
ba
|
991
sqft
|
built
2005
21150 SW 87th Ave, Cutler Bay, FL 33189
$-763
Cash flow
-12.8%
Cash-on-Cash Return
3.2%
Cap rate
0.7%
Rent to Value Ratio
Active
$558,999
3
bds
|
2
ba
|
1,090
sqft
|
built
1954
771 E 35th St, Hialeah, FL 33013
$-544
Cash flow
-5.1%
Cash-on-Cash Return
5.0%
Cap rate
0.6%
Rent to Value Ratio
Active
$810,000
4
bds
|
3
ba
|
2,364
sqft
|
built
2000
14604 SW 132nd Ave, Miami, FL 33186
$-2,274
Cash flow
-14.6%
Cash-on-Cash Return
2.8%
Cap rate
0.5%
Rent to Value Ratio
Active
$725,000
5
bds
|
3
ba
|
1,543
sqft
|
built
1952
7390 SW 30th Ter, Miami, FL 33155
$-1,760
Cash flow
-12.7%
Cash-on-Cash Return
3.2%
Cap rate
0.5%
Rent to Value Ratio
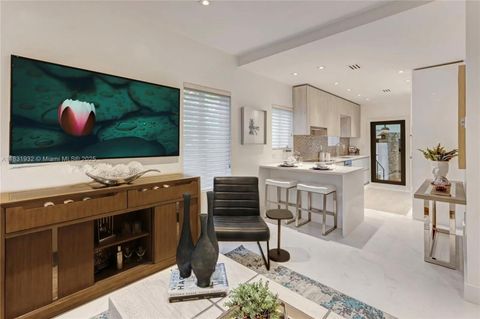
Active
$649,900
3
bds
|
3
ba
|
1,346
sqft
|
built
2005
2814 SW 27th St, Miami, FL 33133
$-1,393
Cash flow
-11.2%
Cash-on-Cash Return
3.6%
Cap rate
0.6%
Rent to Value Ratio
Active
$2,300,000
4
bds
|
4
ba
|
2,224
sqft
|
built
1934
2298 SW 16th Ave, Miami, FL 33145
$-6,699
Cash flow
-15.2%
Cash-on-Cash Return
2.7%
Cap rate
0.4%
Rent to Value Ratio
Active
$929,999
2
bds
|
2
ba
|
1,460
sqft
|
built
1974
2333 Brickell Ave, Miami, FL 33129
$-3,111
Cash flow
-17.5%
Cash-on-Cash Return
2.1%
Cap rate
0.7%
Rent to Value Ratio
Active
$200,000
1
bds
|
1
ba
|
500
sqft
|
built
1925
1308 Drexel Ave, Miami Beach, FL 33139
$-457
Cash flow
-11.9%
Cash-on-Cash Return
3.4%
Cap rate
0.9%
Rent to Value Ratio
Active
$2,400,000
3
bds
|
4
ba
|
2,972
sqft
|
built
2003
13621 Deering Bay Dr, Coral Gables, FL 33158
$-10,589
Cash flow
-23.0%
Cash-on-Cash Return
0.9%
Cap rate
0.4%
Rent to Value Ratio
Active
$549,995
2
bds
|
2
ba
|
1,488
sqft
|
built
1976
301 174th St, Sunny Isles Beach, FL 33160
$-1,327
Cash flow
-12.6%
Cash-on-Cash Return
3.3%
Cap rate
0.7%
Rent to Value Ratio

Active
$1,310,000
2
bds
|
2
ba
|
1,715
sqft
|
built
1981
161 Crandon Blvd, Key Biscayne, FL 33149
$-5,277
Cash flow
-21.0%
Cash-on-Cash Return
1.3%
Cap rate
0.5%
Rent to Value Ratio
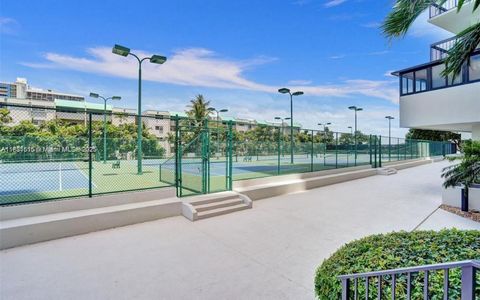
Active
$1,995,000
3
bds
|
5
ba
|
2,665
sqft
|
built
2001
19111 Collins Ave, Sunny Isles Beach, FL 33160
$-6,990
Cash flow
-18.3%
Cash-on-Cash Return
1.9%
Cap rate
0.5%
Rent to Value Ratio
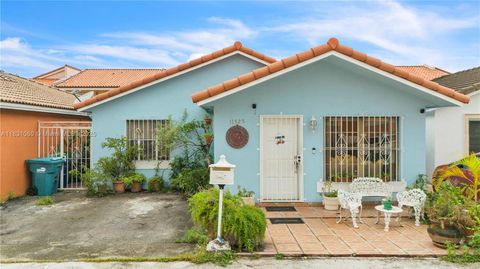
Active
$520,000
3
bds
|
2
ba
|
1,173
sqft
|
built
1989
11525 SW 6th St, Miami, FL 33174
$-647
Cash flow
-6.5%
Cash-on-Cash Return
4.7%
Cap rate
0.6%
Rent to Value Ratio
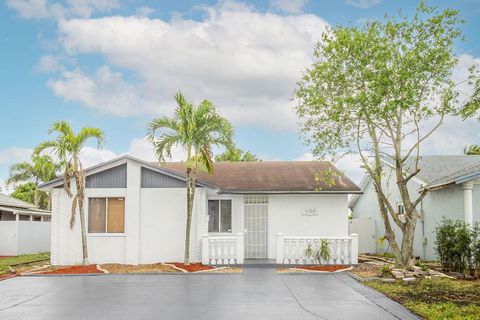
Active
$495,000
3
bds
|
2
ba
|
1,260
sqft
|
built
1984
5100 NW 195th Ter, Miami Gardens, FL 33055
$-731
Cash flow
-7.7%
Cash-on-Cash Return
4.4%
Cap rate
0.6%
Rent to Value Ratio
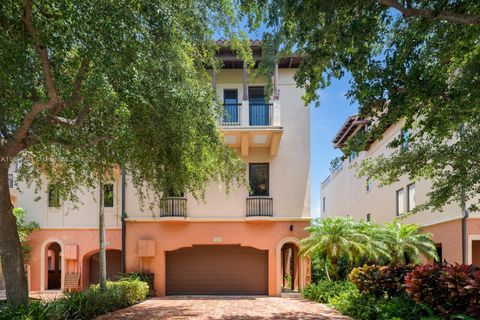
Active
$2,895,000
4
bds
|
6
ba
|
4,815
sqft
|
built
2008
6226 Paradise Point Dr, Palmetto Bay, FL 33157
$-11,630
Cash flow
-21.0%
Cash-on-Cash Return
1.3%
Cap rate
0.3%
Rent to Value Ratio