Miami Dade County Investment Properties for Sale
Browse homes for sale and investment properties in Miami Dade County. Refine your search by price, property type, or more.
Best cash flowing properties in Miami Dade County
Active
$252,499
2
bds
|
2
ba
|
920
sqft
|
built
2005
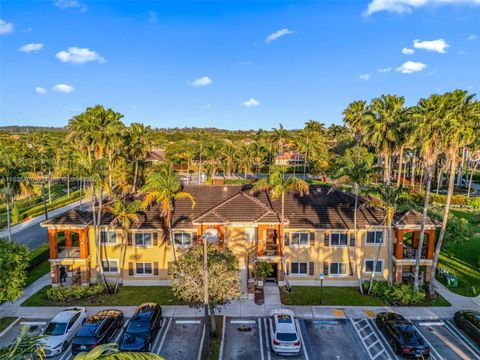
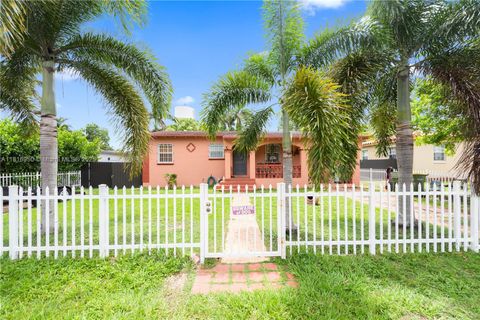
945 NE 34th Ave, Homestead, FL 33033
$-272
Cash flow
-5.6%
Cash-on-Cash Return
4.9%
Cap rate
0.8%
Rent to Value Ratio
Active
$170,000
1
bds
|
1
ba
|
900
sqft
|
built
1972
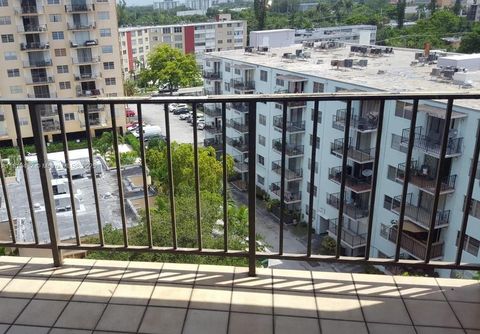
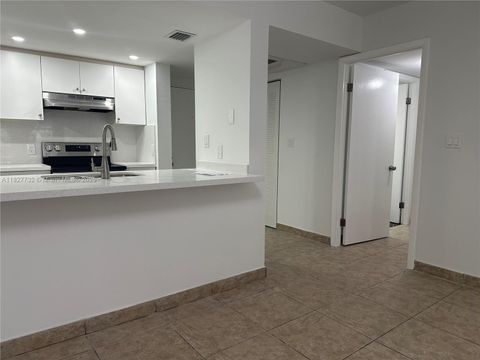
1465 NE 123rd St, North Miami, FL 33161
$-314
Cash flow
-9.6%
Cash-on-Cash Return
3.9%
Cap rate
1.1%
Rent to Value Ratio
10,000 out of 12,525 properties for sale in Miami Dade County
Limited Results Shown
Create a free account, or log in to reveal all property listings and enjoy the complete experience.
Active
$890,000
3
bds
|
3
ba
|
1,480
sqft
|
built
1994
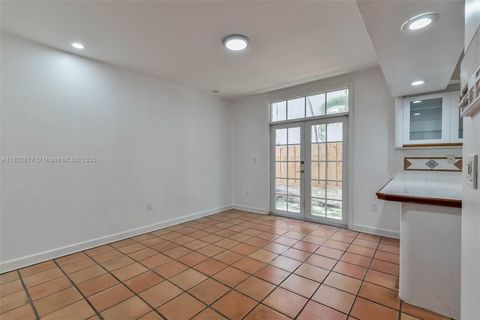
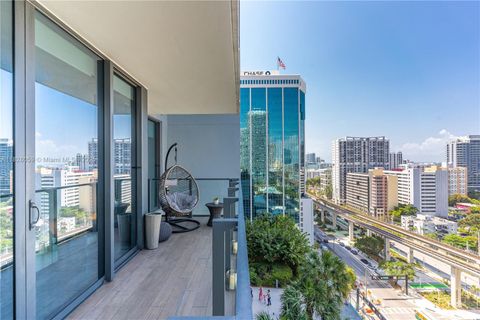
3136 Virginia St, Miami, FL 33133
$-2,779
Cash flow
-16.3%
Cash-on-Cash Return
2.4%
Cap rate
0.6%
Rent to Value Ratio
Active
$280,000
2
bds
|
2
ba
|
1,050
sqft
|
built
1973
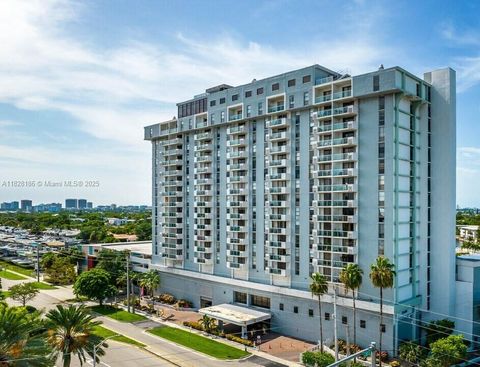
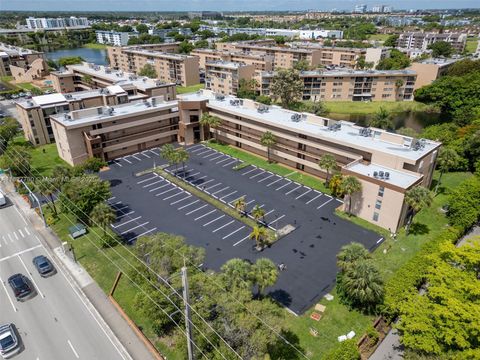
13499 Biscayne Blvd, North Miami, FL 33181
$-1,051
Cash flow
-19.6%
Cash-on-Cash Return
1.6%
Cap rate
0.8%
Rent to Value Ratio
Active
$440,000
3
bds
|
3
ba
|
1,780
sqft
|
built
1996
8260 NW 10th St, Miami, FL 33126
$-1,064
Cash flow
-12.6%
Cash-on-Cash Return
3.2%
Cap rate
0.7%
Rent to Value Ratio
Active
$595,000
2
bds
|
2
ba
|
1,312
sqft
|
built
2007
19900 E Country Club Dr, Aventura, FL 33180
$-854
Cash flow
-7.5%
Cash-on-Cash Return
4.4%
Cap rate
0.7%
Rent to Value Ratio
Active
$225,000
1
bds
|
1
ba
|
697
sqft
|
built
1965
400 Kings Point Dr, Sunny Isles Beach, FL 33160
$-873
Cash flow
-20.2%
Cash-on-Cash Return
1.5%
Cap rate
0.9%
Rent to Value Ratio
Active
$442,000
1
bds
|
1
ba
|
661
sqft
|
built
2019
5350 NW 84th Ave, Doral, FL 33166
$-1,762
Cash flow
-20.8%
Cash-on-Cash Return
1.4%
Cap rate
0.6%
Rent to Value Ratio
Active
$1,100,000
3
bds
|
3
ba
|
1,513
sqft
|
built
2006
31 SE 5th St, Miami, FL 33131
$-3,698
Cash flow
-17.5%
Cash-on-Cash Return
2.1%
Cap rate
0.6%
Rent to Value Ratio
Active
$575,000
3
bds
|
2
ba
|
1,334
sqft
|
built
1977
26505 SW 124th Ct, Homestead, FL 33032
$-1,030
Cash flow
-9.3%
Cash-on-Cash Return
4.0%
Cap rate
0.6%
Rent to Value Ratio
Active
$749,200
3
bds
|
2
ba
|
1,711
sqft
|
built
1947
921 NW 30th Ct, Miami, FL 33125
$-2,326
Cash flow
-16.2%
Cash-on-Cash Return
2.4%
Cap rate
0.4%
Rent to Value Ratio
Active
$672,000
3
bds
|
2
ba
|
1,230
sqft
|
built
1939
547 NW 49th St, Miami, FL 33127
$-2,108
Cash flow
-16.4%
Cash-on-Cash Return
2.4%
Cap rate
0.4%
Rent to Value Ratio
Active
$1,185,000
2
bds
|
2
ba
|
1,642
sqft
|
built
1981
3 Grove Isle Dr, Miami, FL 33133
$-6,323
Cash flow
-27.8%
Cash-on-Cash Return
-0.3%
Cap rate
0.4%
Rent to Value Ratio
Active
$285,000
1
bds
|
2
ba
|
600
sqft
|
built
1991
540 Brickell Key Dr, Miami, FL 33131
$-1,290
Cash flow
-23.6%
Cash-on-Cash Return
0.7%
Cap rate
0.7%
Rent to Value Ratio
Active
$3,200,000
5
bds
|
5
ba
|
2,955
sqft
|
built
1949
4444 Adams Ave, Miami Beach, FL 33140
$-13,732
Cash flow
-22.4%
Cash-on-Cash Return
1.0%
Cap rate
0.3%
Rent to Value Ratio
Active
$435,000
1
bds
|
2
ba
|
710
sqft
|
built
2014
31 SE 6th St, Miami, FL 33131
$-1,968
Cash flow
-23.6%
Cash-on-Cash Return
0.7%
Cap rate
0.7%
Rent to Value Ratio
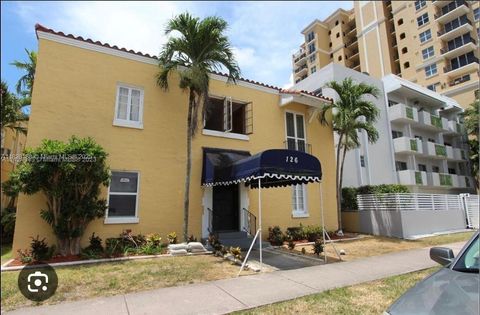
Active
$204,888
bds
|
1
ba
|
351
sqft
|
built
1927
126 Mendoza Ave, Coral Gables, FL 33134
$-453
Cash flow
-11.5%
Cash-on-Cash Return
3.5%
Cap rate
0.9%
Rent to Value Ratio
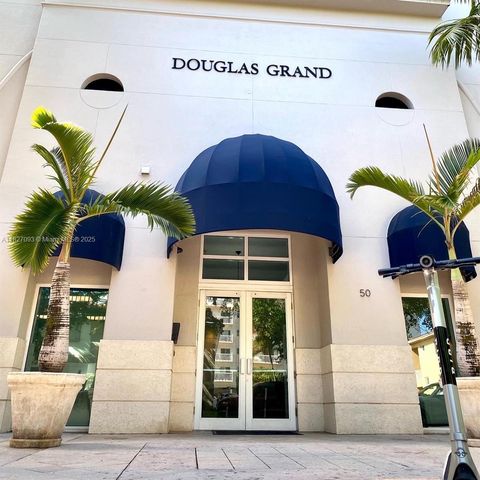
Active
$325,000
1
bds
|
1
ba
|
778
sqft
|
built
2002
50 Menores Ave, Coral Gables, FL 33134
$-995
Cash flow
-16.0%
Cash-on-Cash Return
2.5%
Cap rate
0.8%
Rent to Value Ratio
Active
$1,100,000
2
bds
|
2
ba
|
1,175
sqft
|
built
2016
6620 Indian Creek Dr, Miami Beach, FL 33141
$-4,631
Cash flow
-22.0%
Cash-on-Cash Return
1.1%
Cap rate
0.5%
Rent to Value Ratio
Active
$948,000
2
bds
|
2
ba
|
1,255
sqft
|
built
2009
495 Brickell Ave, Miami, FL 33131
$-2,736
Cash flow
-15.1%
Cash-on-Cash Return
2.7%
Cap rate
0.7%
Rent to Value Ratio
Active
$419,000
1
bds
|
1
ba
|
615
sqft
|
built
2008
60 SW 13th St, Miami, FL 33130
$-1,507
Cash flow
-18.8%
Cash-on-Cash Return
1.8%
Cap rate
0.7%
Rent to Value Ratio
Active
$6,490,000
3
bds
|
5
ba
|
3,227
sqft
|
built
1986
2443 Fisher Island Dr, Miami Beach, FL 33109
$-39,696
Cash flow
-31.9%
Cash-on-Cash Return
-1.2%
Cap rate
0.1%
Rent to Value Ratio
Active
$485,000
3
bds
|
2
ba
|
1,294
sqft
|
built
1990
24940 SW 129th Ct, Homestead, FL 33032
$-628
Cash flow
-6.8%
Cash-on-Cash Return
4.6%
Cap rate
0.6%
Rent to Value Ratio
Active
$599,900
1
bds
|
2
ba
|
1,030
sqft
|
built
1980
2401 Collins Ave, Miami Beach, FL 33140
$-2,742
Cash flow
-23.8%
Cash-on-Cash Return
0.7%
Cap rate
0.5%
Rent to Value Ratio
Active
$299,000
1
bds
|
2
ba
|
934
sqft
|
built
1972
1235 Mariposa Ave, Coral Gables, FL 33146
$-814
Cash flow
-14.2%
Cash-on-Cash Return
2.9%
Cap rate
0.8%
Rent to Value Ratio
Active
$1,899,000
3
bds
|
2
ba
|
1,809
sqft
|
built
1959
3865 Poinciana Ave, Miami, FL 33133
$-6,475
Cash flow
-17.8%
Cash-on-Cash Return
2.1%
Cap rate
0.3%
Rent to Value Ratio
Active
$1,770,000
3
bds
|
2
ba
|
1,870
sqft
|
built
2009
495 Brickell Ave, Miami, FL 33131
$-6,088
Cash flow
-17.9%
Cash-on-Cash Return
2.0%
Cap rate
0.6%
Rent to Value Ratio
Active
$239,000
1
bds
|
1
ba
|
436
sqft
|
built
2008
1550 Pennsylvania Ave, Miami Beach, FL 33139
$-662
Cash flow
-14.5%
Cash-on-Cash Return
2.8%
Cap rate
0.8%
Rent to Value Ratio
Active
$6,200,000
4
bds
|
3
ba
|
3,934
sqft
|
built
1951
1375 N Biscayne Point Rd, Miami Beach, FL 33141
$-33,139
Cash flow
-27.9%
Cash-on-Cash Return
-0.3%
Cap rate
0.1%
Rent to Value Ratio
Active
$265,000
bds
|
1
ba
|
508
sqft
|
built
2007
1750 N Bayshore Dr, Miami, FL 33132
$-1,341
Cash flow
-26.4%
Cash-on-Cash Return
0.1%
Cap rate
0.8%
Rent to Value Ratio
Active
$349,000
1
bds
|
1
ba
|
950
sqft
|
built
1966
10350 W Bay Harbor Dr, Bay Harbor Islands, FL 33154
$-1,623
Cash flow
-24.3%
Cash-on-Cash Return
0.6%
Cap rate
0.7%
Rent to Value Ratio
Active
$1,200,000
4
bds
|
0
ba
|
2,464
sqft
|
built
1950
740 84th St, Miami Beach, FL 33141
$-5,132
Cash flow
-22.3%
Cash-on-Cash Return
1.0%
Cap rate
0.3%
Rent to Value Ratio
Active
$1,200,000
4
bds
|
0
ba
|
2,464
sqft
|
built
1950
750 84th St, Miami Beach, FL 33141
$-5,063
Cash flow
-22.0%
Cash-on-Cash Return
1.1%
Cap rate
0.3%
Rent to Value Ratio
Active
$2,695,000
3
bds
|
4
ba
|
2,210
sqft
|
built
1999
18671 Collins Ave, Sunny Isles Beach, FL 33160
$-10,455
Cash flow
-20.2%
Cash-on-Cash Return
1.5%
Cap rate
0.4%
Rent to Value Ratio
Active
$430,000
3
bds
|
3
ba
|
1,394
sqft
|
built
2021
10237 SW 228th Ter, Miami, FL 33190
$-1,206
Cash flow
-14.6%
Cash-on-Cash Return
2.8%
Cap rate
0.6%
Rent to Value Ratio
Active
$359,995
2
bds
|
2
ba
|
1,220
sqft
|
built
1974
2851 NE 183rd St, Aventura, FL 33160
$-1,235
Cash flow
-17.9%
Cash-on-Cash Return
2.0%
Cap rate
0.8%
Rent to Value Ratio
Active
$519,000
3
bds
|
2
ba
|
1,140
sqft
|
built
1950
916 NW 3rd Ave, Homestead, FL 33030
$-1,157
Cash flow
-11.6%
Cash-on-Cash Return
3.5%
Cap rate
0.5%
Rent to Value Ratio
Active
$329,900
2
bds
|
2
ba
|
992
sqft
|
built
1984
8100 Geneva Ct, Doral, FL 33166
$-788
Cash flow
-12.5%
Cash-on-Cash Return
3.3%
Cap rate
0.8%
Rent to Value Ratio
Active
$638,000
1
bds
|
2
ba
|
883
sqft
|
built
2016
88 SW 7th St, Miami, FL 33130
$-1,968
Cash flow
-16.1%
Cash-on-Cash Return
2.4%
Cap rate
0.7%
Rent to Value Ratio
Active
$318,000
2
bds
|
2
ba
|
1,193
sqft
|
built
1974
706 NW 87th Ave, Miami, FL 33172
$-688
Cash flow
-11.3%
Cash-on-Cash Return
3.6%
Cap rate
0.7%
Rent to Value Ratio