Orange County Investment Properties for Sale
Browse homes for sale and investment properties in Orange County. Refine your search by price, property type, or more.
Best cash flowing properties in Orange County

Active
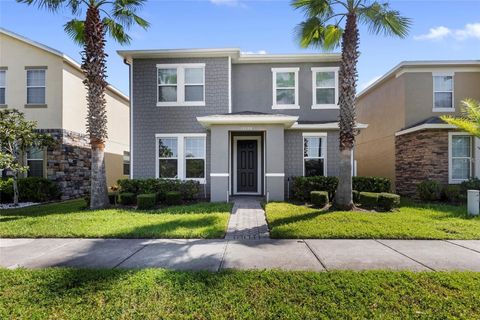
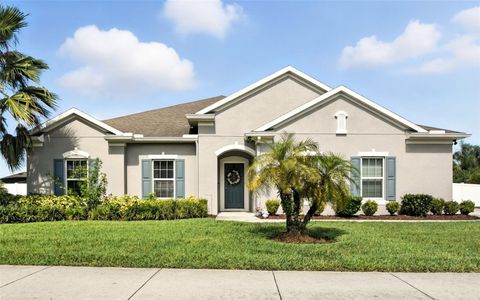
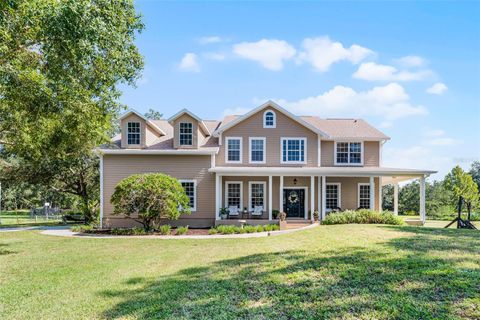
$360,000
3
bds
|
2
ba
|
1,798
sqft
|
built
2003
480 Lisa Karen Cir, Apopka, FL 32712
$-436
Cash flow
-6.3%
Cash-on-Cash Return
4.7%
Cap rate
0.6%
Rent to Value Ratio

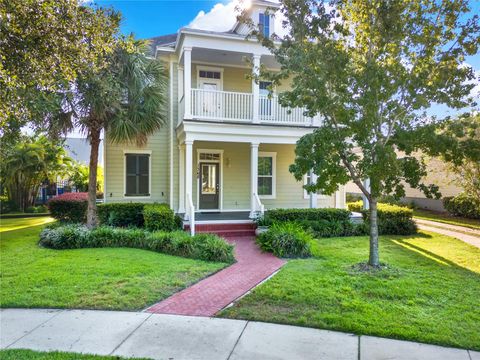
Active
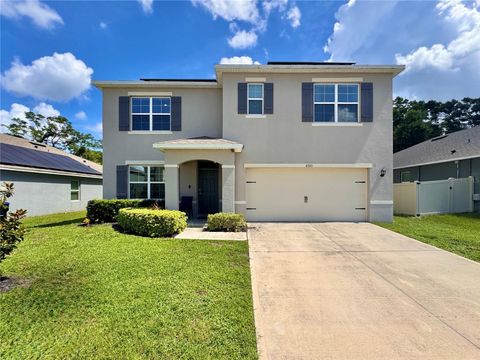
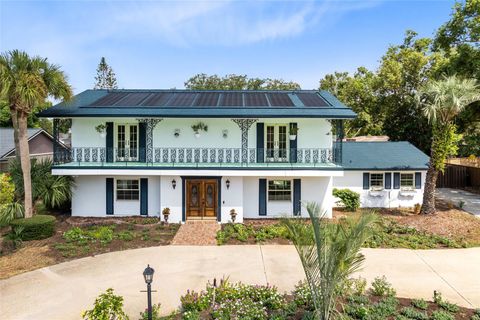
$390,000
4
bds
|
3
ba
|
2,349
sqft
|
built
2009
5565 Lochdale Dr, Orlando, FL 32818
$-496
Cash flow
-6.6%
Cash-on-Cash Return
4.6%
Cap rate
0.6%
Rent to Value Ratio
2,690 out of 2,913 properties for sale in Orange County
Limited Results Shown
Create a free account, or log in to reveal all property listings and enjoy the complete experience.

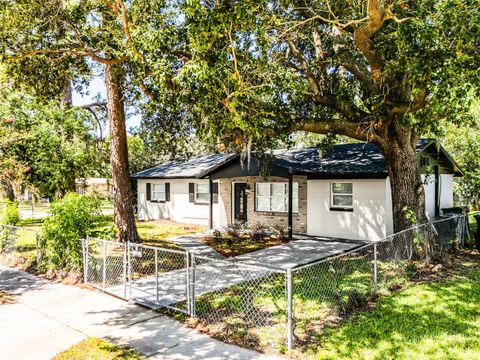
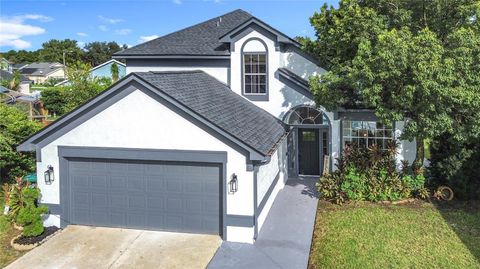
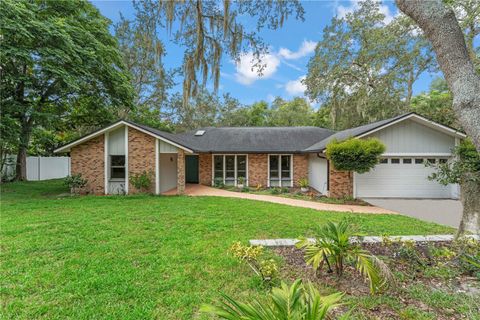
Active
$399,500
3
bds
|
3
ba
|
2,389
sqft
|
built
2004
7512 Fordham Creek Ln, Orlando, FL 32818
$-813
Cash flow
-10.6%
Cash-on-Cash Return
3.7%
Cap rate
0.6%
Rent to Value Ratio
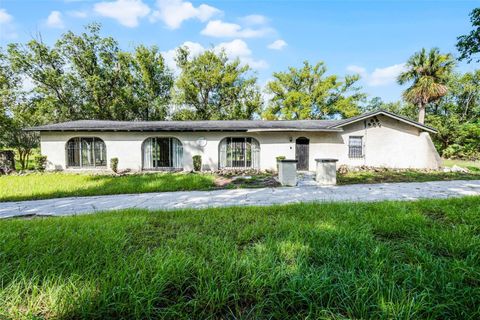
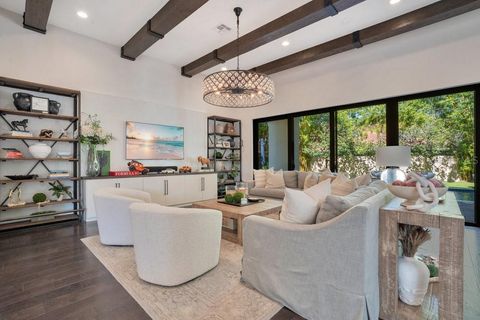
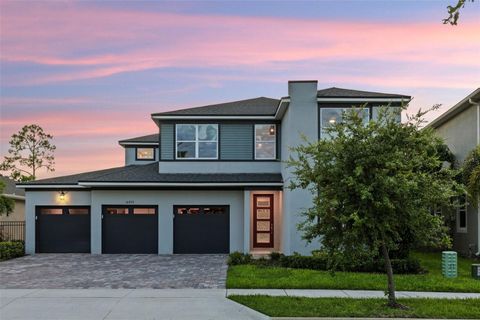
Active
$490,000
3
bds
|
3
ba
|
1,697
sqft
|
built
2013
5209 Creekside Park Ave, Orlando, FL 32811
$-1,290
Cash flow
-13.7%
Cash-on-Cash Return
3.0%
Cap rate
0.6%
Rent to Value Ratio

Active
$595,000
5
bds
|
3
ba
|
2,961
sqft
|
built
2006
5816 Covington Cove Way, Orlando, FL 32829
$-1,210
Cash flow
-10.6%
Cash-on-Cash Return
3.7%
Cap rate
0.6%
Rent to Value Ratio

Active
$597,000
4
bds
|
3
ba
|
2,104
sqft
|
built
1998
239 Longhirst Loop, Ocoee, FL 34761
$-1,941
Cash flow
-17.0%
Cash-on-Cash Return
2.2%
Cap rate
0.5%
Rent to Value Ratio
Active
$420,000
5
bds
|
3
ba
|
2,398
sqft
|
built
2021
6780 Coral Berry Dr, Mount Dora, FL 32757
$-773
Cash flow
-9.6%
Cash-on-Cash Return
3.9%
Cap rate
0.7%
Rent to Value Ratio
Active
$299,000
3
bds
|
2
ba
|
1,171
sqft
|
built
1971
5297 Letha St, Orlando, FL 32811
$-707
Cash flow
-12.3%
Cash-on-Cash Return
3.3%
Cap rate
0.5%
Rent to Value Ratio

Active
$380,000
3
bds
|
2
ba
|
1,292
sqft
|
built
1999
7646 Harbor Bend Cir, Orlando, FL 32822
$-667
Cash flow
-9.2%
Cash-on-Cash Return
4.0%
Cap rate
0.6%
Rent to Value Ratio

Active
$560,000
4
bds
|
3
ba
|
2,668
sqft
|
built
2014
10525 Arbor View Blvd, Orlando, FL 32825
$-852
Cash flow
-7.9%
Cash-on-Cash Return
4.3%
Cap rate
0.6%
Rent to Value Ratio

Active
$689,000
3
bds
|
2
ba
|
1,892
sqft
|
built
1994
14014 Fairway Willow Ln, Winter Garden, FL 34787
$-2,010
Cash flow
-15.2%
Cash-on-Cash Return
2.6%
Cap rate
0.4%
Rent to Value Ratio
Active
$3,495,000
2
bds
|
2
ba
|
3,170
sqft
|
built
1953
7625 Clarcona Ocoee Rd, Orlando, FL 32818
$-16,670
Cash flow
-24.9%
Cash-on-Cash Return
0.4%
Cap rate
0.1%
Rent to Value Ratio
Active
$565,000
3
bds
|
2
ba
|
2,119
sqft
|
built
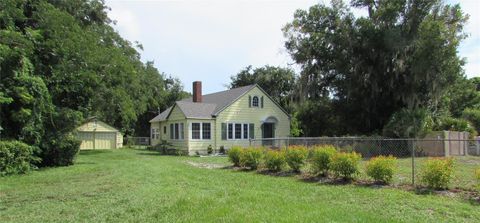
1935
7325 Tiffany Dr, Orlando, FL 32807
$-1,073
Cash flow
-9.9%
Cash-on-Cash Return
3.9%
Cap rate
0.5%
Rent to Value Ratio
Active
$1,495,000
1
bds
|
1
ba
|
616
sqft
|
built
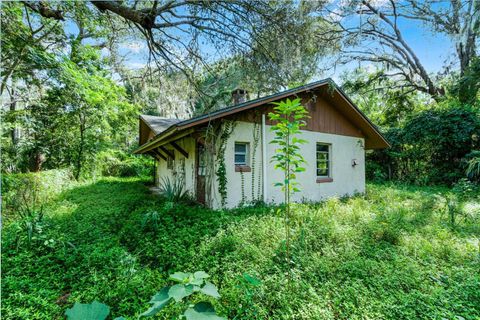
1950
7466 Vivian Ln, Orlando, FL 32818
$-7,056
Cash flow
-24.6%
Cash-on-Cash Return
0.5%
Cap rate
0.1%
Rent to Value Ratio

Active
$372,900
4
bds
|
3
ba
|
1,826
sqft
|
built
1942
3782 Summer Haven Ln, Apopka, FL 32703
$-842
Cash flow
-11.8%
Cash-on-Cash Return
3.4%
Cap rate
0.5%
Rent to Value Ratio

Active
$539,900
4
bds
|
2
ba
|
2,082
sqft
|
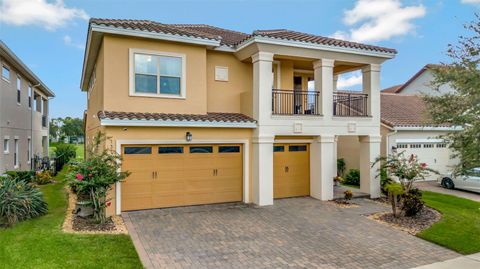
built
2006
8826 Irmastone Way, Orlando, FL 32817
$-52,920
Cash flow
-511.4%
Cash-on-Cash Return
-111.5%
Cap rate
0.5%
Rent to Value Ratio
Active
$995,000
5
bds
|
5
ba
|
4,238
sqft
|
built
2019
13109 Stanthorne Ave, Orlando, FL 32832
$-897
Cash flow
-4.7%
Cash-on-Cash Return
5.1%
Cap rate
0.6%
Rent to Value Ratio
Active
$329,000
3
bds
|
2
ba
|
1,330
sqft
|
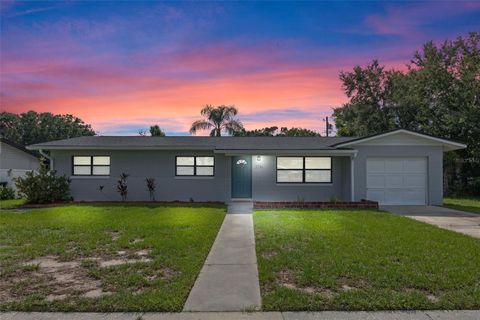
built
1962
5336 Weirwood Ave, Orlando, FL 32810
$-633
Cash flow
-10.0%
Cash-on-Cash Return
3.8%
Cap rate
0.6%
Rent to Value Ratio

Active
$665,000
5
bds
|
3
ba
|
3,904
sqft
|
built
2006
5042 Rishley Run Way, Mount Dora, FL 32757
$-2,093
Cash flow
-16.4%
Cash-on-Cash Return
2.4%
Cap rate
0.5%
Rent to Value Ratio
Active
$531,000
4
bds
|
2
ba
|
2,219
sqft
|
built
2016
4176 Golden Willow Cir, Apopka, FL 32712
$-1,313
Cash flow
-12.9%
Cash-on-Cash Return
3.2%
Cap rate
0.6%
Rent to Value Ratio
Active
$879,000
3
bds
|
3
ba
|
2,484
sqft
|
built
2014
1368 Union Club Dr, Winter Garden, FL 34787
$-2,794
Cash flow
-16.6%
Cash-on-Cash Return
2.3%
Cap rate
0.5%
Rent to Value Ratio
Active
$484,900
4
bds
|
3
ba
|
1,742
sqft
|
built
1993
4713 Fort Knox Ct, Orlando, FL 32822
$-955
Cash flow
-10.3%
Cash-on-Cash Return
3.8%
Cap rate
0.5%
Rent to Value Ratio
Active
$1,750,000
3
bds
|
4
ba
|
3,519
sqft
|
built
2016
8364 Via Vittoria Way, Orlando, FL 32819
$-5,478
Cash flow
-16.3%
Cash-on-Cash Return
2.4%
Cap rate
0.5%
Rent to Value Ratio
Active
$625,000
4
bds
|
4
ba
|
2,477
sqft
|
built
2016
16137 Wind View Ln, Winter Garden, FL 34787
$-1,637
Cash flow
-13.7%
Cash-on-Cash Return
3.0%
Cap rate
0.6%
Rent to Value Ratio
Active
$1,489,000
5
bds
|
5
ba
|
4,178
sqft
|
built
2018
10594 Royal Cypress Way, Orlando, FL 32836
$-4,674
Cash flow
-16.4%
Cash-on-Cash Return
2.4%
Cap rate
0.5%
Rent to Value Ratio

Active
$475,000
3
bds
|
2
ba
|
1,698
sqft
|
built
1984
817 Hickory Knoll Ct, Apopka, FL 32712
$-1,205
Cash flow
-13.2%
Cash-on-Cash Return
3.1%
Cap rate
0.5%
Rent to Value Ratio
Active
$625,000
4
bds
|
3
ba
|
2,640
sqft
|
built
2006
10227 Kristen Park Dr, Orlando, FL 32832
$-1,672
Cash flow
-14.0%
Cash-on-Cash Return
2.9%
Cap rate
0.5%
Rent to Value Ratio

Active
$549,900
3
bds
|
2
ba
|
1,361
sqft
|
built
1958
4201 Park Lake St, Orlando, FL 32803
$-1,709
Cash flow
-16.2%
Cash-on-Cash Return
2.4%
Cap rate
0.4%
Rent to Value Ratio
Active
$699,900
5
bds
|
3
ba
|
2,524
sqft
|
built
1955
3849 Round Lake Rd, Zellwood, FL 32798
$-1,873
Cash flow
-14.0%
Cash-on-Cash Return
2.9%
Cap rate
0.4%
Rent to Value Ratio
Active
$799,000
5
bds
|
3
ba
|
3,599
sqft
|
built
2004
19801 Quinella St, Orlando, FL 32833
$-2,001
Cash flow
-13.1%
Cash-on-Cash Return
3.1%
Cap rate
0.5%
Rent to Value Ratio

Active
$850,000
5
bds
|
3
ba
|
3,092
sqft
|
built
2004
724 Chase Oaks Ct, Winter Garden, FL 34787
$-2,708
Cash flow
-16.6%
Cash-on-Cash Return
2.3%
Cap rate
0.4%
Rent to Value Ratio
Active
$1,195,500
4
bds
|
3
ba
|
2,289
sqft
|
built
1977
7621 Orange Tree Ln, Orlando, FL 32819
$-4,245
Cash flow
-18.5%
Cash-on-Cash Return
1.9%
Cap rate
0.3%
Rent to Value Ratio
Active
$785,000
4
bds
|
2
ba
|
2,540
sqft
|
built
1984
7921 Sebago Ct, Orlando, FL 32835
$-1,814
Cash flow
-12.1%
Cash-on-Cash Return
3.4%
Cap rate
0.6%
Rent to Value Ratio
Active
$1,025,000
5
bds
|
3
ba
|
3,477
sqft
|
built
2021
16975 Wingspread Loop, Winter Garden, FL 34787
$-3,160
Cash flow
-16.1%
Cash-on-Cash Return
2.4%
Cap rate
0.4%
Rent to Value Ratio

Active
$540,000
3
bds
|
2
ba
|
1,524
sqft
|
built
1957
2800 Zephyr Rd, Orlando, FL 32806
$-1,030
Cash flow
-10.0%
Cash-on-Cash Return
3.9%
Cap rate
0.5%
Rent to Value Ratio

Active
$449,000
4
bds
|
3
ba
|
2,278
sqft
|
built
1992
447 Lytton Cir, Orlando, FL 32824
$-1,291
Cash flow
-15.0%
Cash-on-Cash Return
2.7%
Cap rate
0.6%
Rent to Value Ratio
Active
$999,000
4
bds
|
3
ba
|
2,460
sqft
|
built
1940
1112 W New Hampshire St, Orlando, FL 32804
$-3,865
Cash flow
-20.2%
Cash-on-Cash Return
1.5%
Cap rate
0.3%
Rent to Value Ratio
Active
$315,000
4
bds
|
2
ba
|
1,128
sqft
|
built
1954
51 N Linden Dr, Orlando, FL 32807
$-592
Cash flow
-9.8%
Cash-on-Cash Return
3.9%
Cap rate
0.6%
Rent to Value Ratio
Active
$849,999
3
bds
|
3
ba
|
2,437
sqft
|
built
1986
6203 Wynfield Ct, Orlando, FL 32819
$-1,969
Cash flow
-12.1%
Cash-on-Cash Return
3.4%
Cap rate
0.5%
Rent to Value Ratio

Active
$449,900
4
bds
|
3
ba
|
1,923
sqft
|
built
1978
2317 Woodleaf Ct, Orlando, FL 32837
$-749
Cash flow
-8.7%
Cash-on-Cash Return
4.2%
Cap rate
0.6%
Rent to Value Ratio