Orange County Investment Properties for Sale
Browse homes for sale and investment properties in Orange County. Refine your search by price, property type, or more.
Best cash flowing properties in Orange County
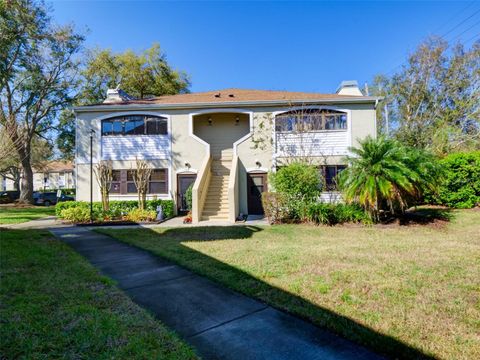
Active
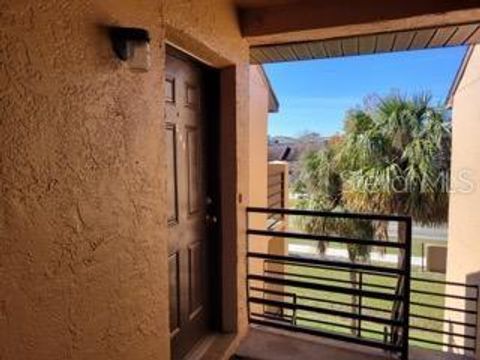
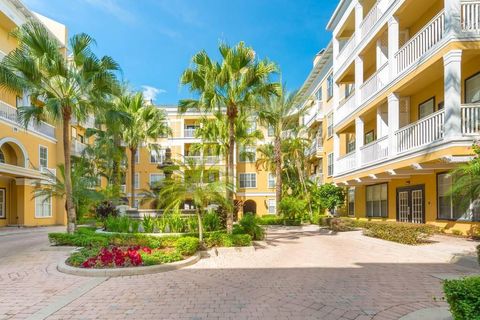
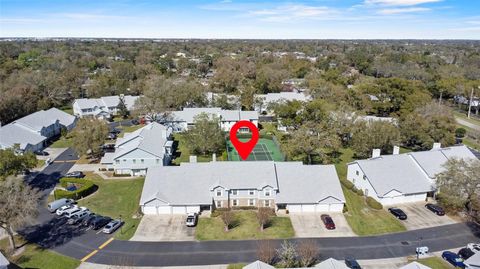
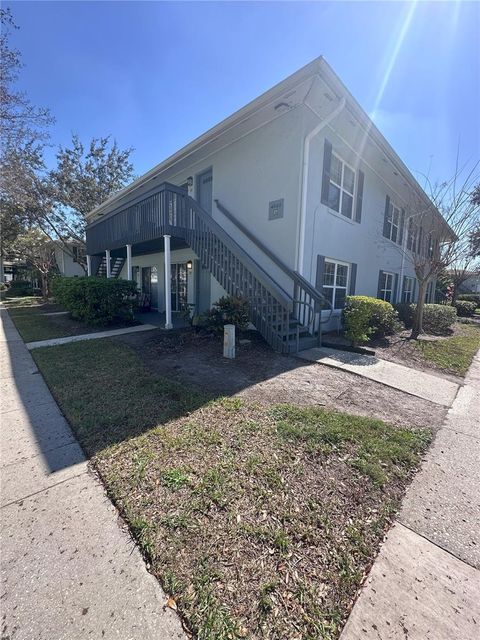
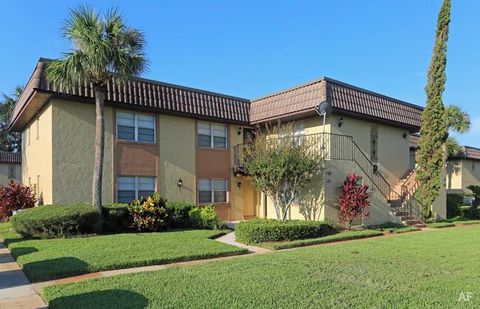
$129,000
2
bds
|
2
ba
|
934
sqft
|
built
1985
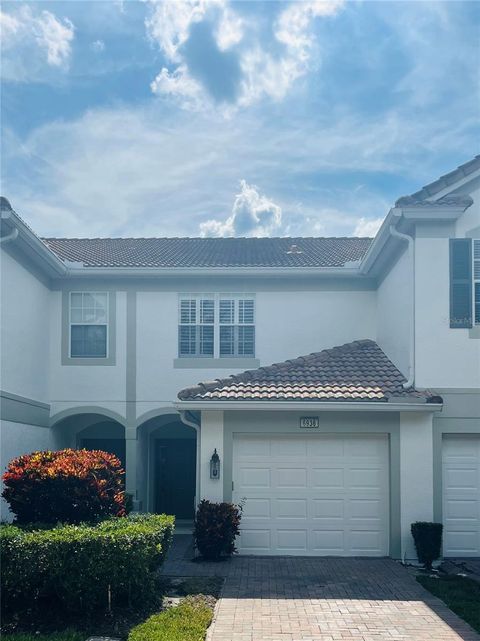
5214 Via Hacienda Cir, Orlando, FL 32839
$351
Cash flow
14.2%
Cash-on-Cash Return
9.4%
Cap rate
1.2%
Rent to Value Ratio
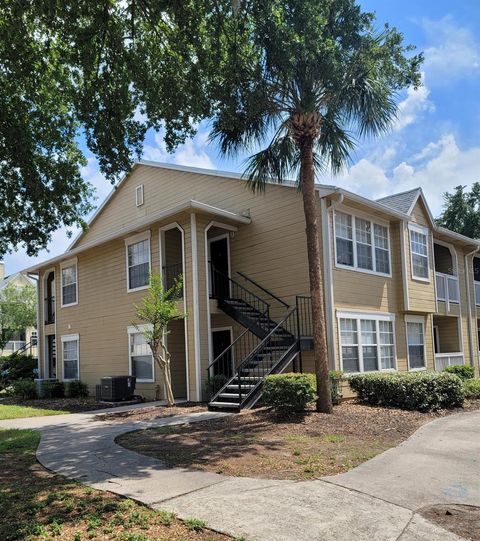
Active
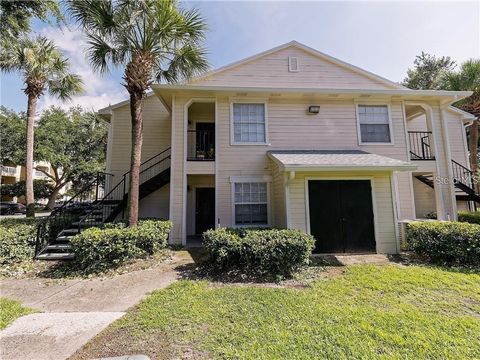
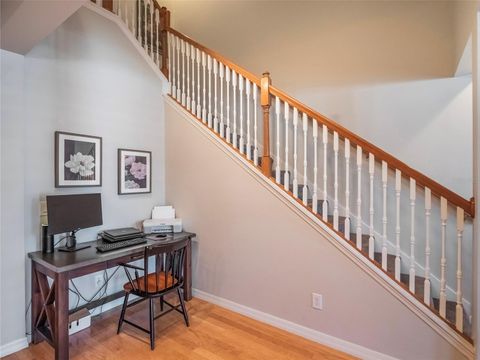
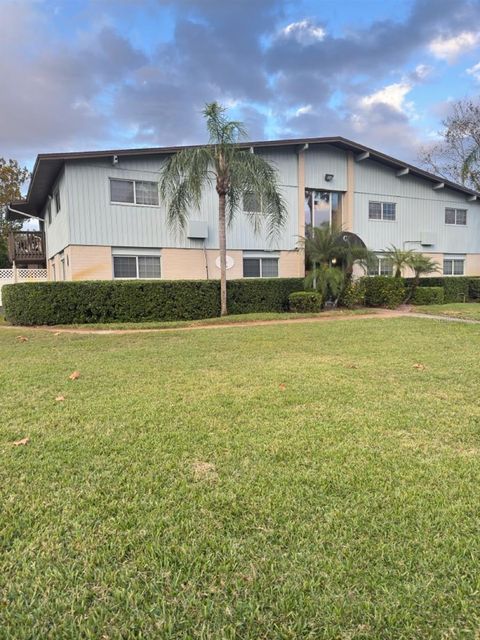
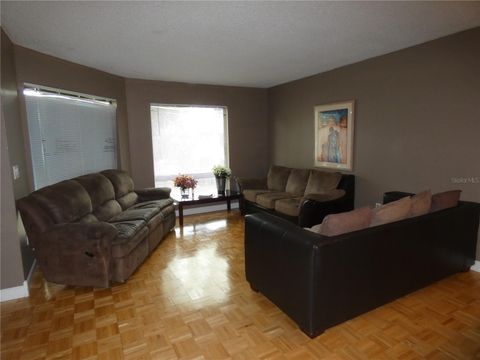
$190,000
2
bds
|
2
ba
|
829
sqft
|
built
1989
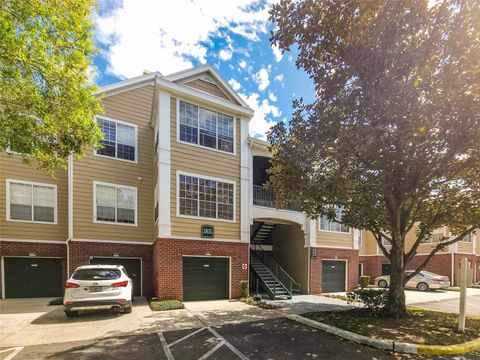
1015 S Hiawassee Rd, Orlando, FL 32835
$164
Cash flow
4.5%
Cash-on-Cash Return
7.2%
Cap rate
0.9%
Rent to Value Ratio
1,903 out of 2,165 properties for sale in Orange County
Limited Results Shown
Create a free account, or log in to reveal all property listings and enjoy the complete experience.
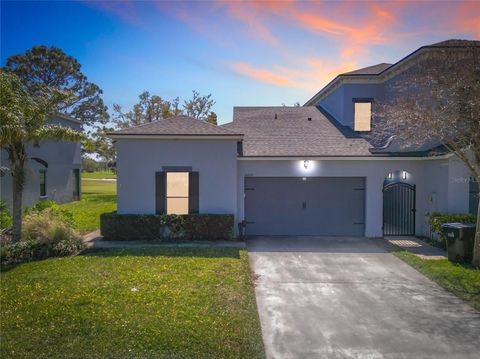
Active
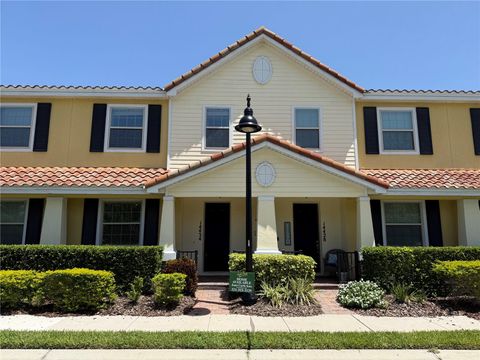
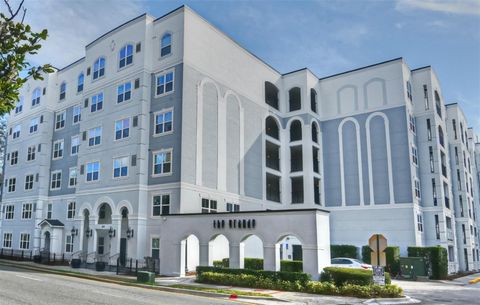
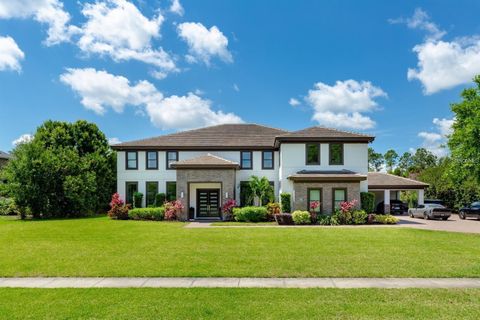
$409,900
2
bds
|
3
ba
|
1,607
sqft
|
built
2018
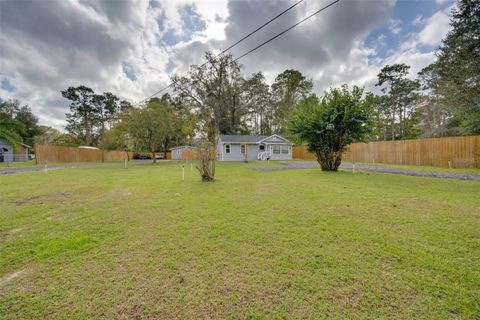
14434 Swanley St, Orlando, FL 32832
$-1,329
Cash flow
-16.9%
Cash-on-Cash Return
2.3%
Cap rate
0.6%
Rent to Value Ratio
Active
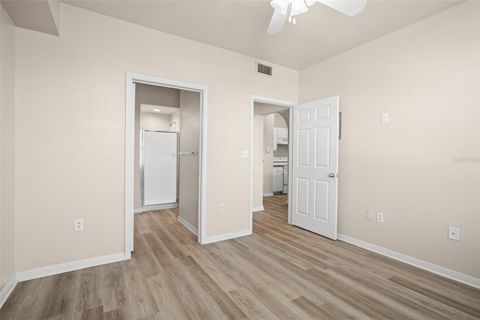
$150,000
1
bds
|
1
ba
|
562
sqft
|
built
2002
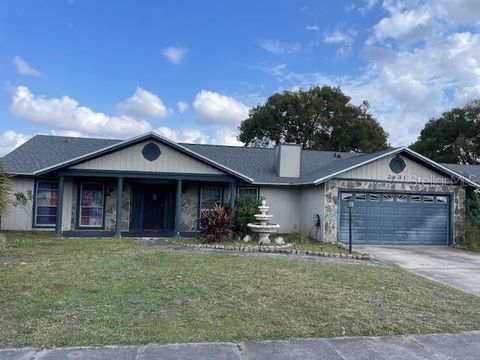
911 N Orange Ave, Orlando, FL 32801
$-1
Cash flow
0.0%
Cash-on-Cash Return
6.1%
Cap rate
0.9%
Rent to Value Ratio
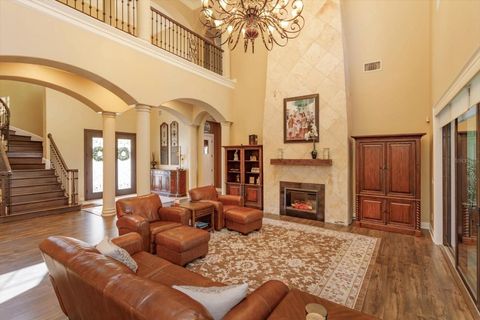
Active
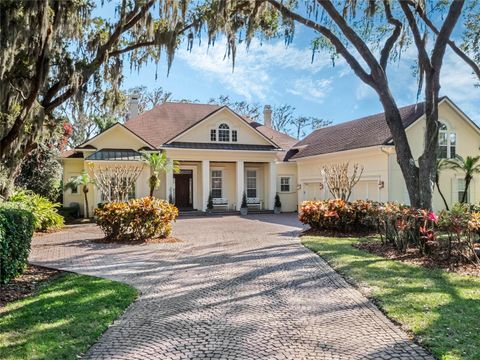
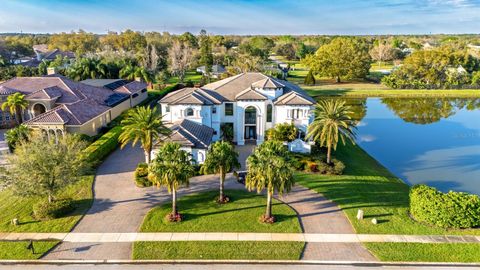
$2,799,000
4
bds
|
5
ba
|
3,636
sqft
|
built
1987
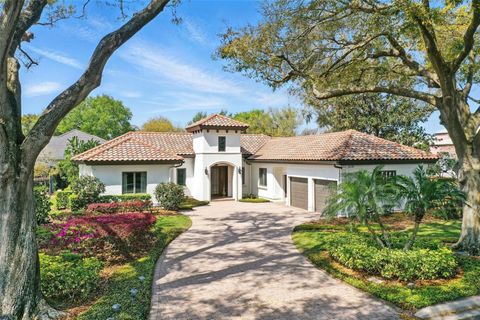
6120 Payne Stewart Dr, Windermere, FL 34786
$-12,415
Cash flow
-23.1%
Cash-on-Cash Return
0.8%
Cap rate
0.2%
Rent to Value Ratio
Active
$325,000
3
bds
|
2
ba
|
1,732
sqft
|
built
2011
20604 Maxim Pkwy, Orlando, FL 32833
$-857
Cash flow
-13.8%
Cash-on-Cash Return
3.0%
Cap rate
0.7%
Rent to Value Ratio
Active
$557,000
4
bds
|
3
ba
|
2,562
sqft
|
built
2013
10942 High Bush Ct, Orlando, FL 32825
$-861
Cash flow
-8.1%
Cash-on-Cash Return
4.3%
Cap rate
0.6%
Rent to Value Ratio
Active
$189,000
2
bds
|
1
ba
|
1,000
sqft
|
built
1970
4376 Lake Underhill Rd, Orlando, FL 32803
$-427
Cash flow
-11.8%
Cash-on-Cash Return
3.4%
Cap rate
1.0%
Rent to Value Ratio
Active
$310,000
2
bds
|
2
ba
|
1,070
sqft
|
built
2000
860 N Orange Ave, Orlando, FL 32801
$-574
Cash flow
-9.7%
Cash-on-Cash Return
3.9%
Cap rate
0.6%
Rent to Value Ratio

Active
$162,500
2
bds
|
2
ba
|
934
sqft
|
built
1989
1021 S Hiawassee Rd, Orlando, FL 32835
$-758
Cash flow
-24.3%
Cash-on-Cash Return
0.5%
Cap rate
0.9%
Rent to Value Ratio
Active
$579,900
2
bds
|
3
ba
|
1,897
sqft
|
built
2005
2979 Upper Park Rd, Orlando, FL 32814
$-1,838
Cash flow
-16.5%
Cash-on-Cash Return
2.3%
Cap rate
0.6%
Rent to Value Ratio
Active
$214,900
1
bds
|
1
ba
|
685
sqft
|
built
2002
206 E South St, Orlando, FL 32801
$-20
Cash flow
-0.5%
Cash-on-Cash Return
6.0%
Cap rate
0.8%
Rent to Value Ratio
Active
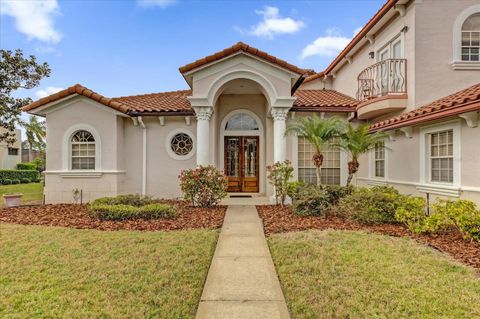
$2,795,000
4
bds
|
5
ba
|
5,370
sqft
|
built
2004
10411 Hart Branch Cir, Orlando, FL 32832
$-13,080
Cash flow
-24.4%
Cash-on-Cash Return
0.5%
Cap rate
0.2%
Rent to Value Ratio
Active
$374,999
2
bds
|
3
ba
|
1,557
sqft
|
built
2006
6936 Hochad Dr, Orlando, FL 32819
$-854
Cash flow
-11.9%
Cash-on-Cash Return
3.4%
Cap rate
0.7%
Rent to Value Ratio
Active
$223,900
2
bds
|
2
ba
|
886
sqft
|
built
1996
13037 Mulberry Park Dr, Orlando, FL 32821
$-734
Cash flow
-17.1%
Cash-on-Cash Return
2.2%
Cap rate
0.7%
Rent to Value Ratio

Active
$180,000
1
bds
|
1
ba
|
481
sqft
|
built
2000
860 N Orange Ave, Orlando, FL 32801
$-289
Cash flow
-8.4%
Cash-on-Cash Return
4.2%
Cap rate
0.7%
Rent to Value Ratio
Active
$650,000
2
bds
|
2
ba
|
1,792
sqft
|
built
1948
224 E Kelly Park Rd, Apopka, FL 32712
$-1,467
Cash flow
-11.8%
Cash-on-Cash Return
3.4%
Cap rate
0.5%
Rent to Value Ratio
Active
$415,000
3
bds
|
2
ba
|
1,955
sqft
|
built
1983
2831 Smu Blvd, Orlando, FL 32817
$-790
Cash flow
-9.9%
Cash-on-Cash Return
3.9%
Cap rate
0.7%
Rent to Value Ratio

Active
$269,900
3
bds
|
2
ba
|
1,387
sqft
|
built
2000
3428 Soho St, Orlando, FL 32835
$-894
Cash flow
-17.3%
Cash-on-Cash Return
2.2%
Cap rate
0.8%
Rent to Value Ratio
Active
$285,000
2
bds
|
1
ba
|
800
sqft
|
built
1969
4202 Mizell St, Orlando, FL 32812
$-360
Cash flow
-6.6%
Cash-on-Cash Return
4.6%
Cap rate
0.6%
Rent to Value Ratio
Active
$645,000
4
bds
|
3
ba
|
2,470
sqft
|
built
2018
16144 Parkwyn St, Winter Garden, FL 34787
$-1,705
Cash flow
-13.8%
Cash-on-Cash Return
3.0%
Cap rate
0.6%
Rent to Value Ratio
Active
$999,000
4
bds
|
4
ba
|
3,890
sqft
|
built
1998
10742 Boca Pointe Dr, Orlando, FL 32836
$-2,677
Cash flow
-14.0%
Cash-on-Cash Return
2.9%
Cap rate
0.6%
Rent to Value Ratio
Active
$880,000
4
bds
|
4
ba
|
3,115
sqft
|
built
2023
11206 Pixie Mandarin Ct, Winter Garden, FL 34787
$-3,088
Cash flow
-18.3%
Cash-on-Cash Return
1.9%
Cap rate
0.4%
Rent to Value Ratio
Active
$288,500
3
bds
|
2
ba
|
1,395
sqft
|
built
1994
5273 Tunbridge Wells Ln, Orlando, FL 32812
$-717
Cash flow
-13.0%
Cash-on-Cash Return
3.2%
Cap rate
0.8%
Rent to Value Ratio
Active
$3,490,000
6
bds
|
8
ba
|
6,930
sqft
|
built
2014
13305 Bellaria Cir, Windermere, FL 34786
$-15,025
Cash flow
-22.5%
Cash-on-Cash Return
1.0%
Cap rate
0.3%
Rent to Value Ratio
Active
$210,000
3
bds
|
2
ba
|
1,149
sqft
|
built
1966
1695 Lee Rd, Winter Park, FL 32789
$127
Cash flow
3.2%
Cash-on-Cash Return
6.9%
Cap rate
1.0%
Rent to Value Ratio
Active
$3,590,000
8
bds
|
8
ba
|
8,203
sqft
|
built
2017
13643 Lake Cawood Dr, Windermere, FL 34786
$-15,516
Cash flow
-22.5%
Cash-on-Cash Return
1.0%
Cap rate
0.2%
Rent to Value Ratio
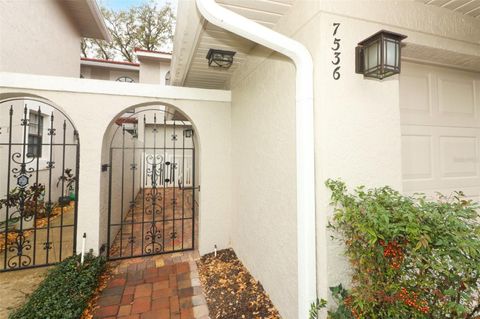
Active
$490,000
3
bds
|
3
ba
|
1,648
sqft
|
built
1989
7536 Fenwick Cove Ln, Orlando, FL 32819
$-1,398
Cash flow
-14.9%
Cash-on-Cash Return
2.7%
Cap rate
0.6%
Rent to Value Ratio
Active
$185,000
2
bds
|
2
ba
|
829
sqft
|
built
1989
1029 S Hiawassee Rd, Orlando, FL 32835
$-626
Cash flow
-17.7%
Cash-on-Cash Return
2.1%
Cap rate
0.9%
Rent to Value Ratio
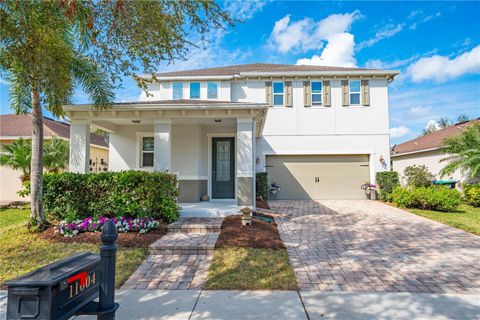
Active
$699,000
3
bds
|
4
ba
|
2,853
sqft
|
built
2014
11604 Acosta Ave, Orlando, FL 32836
$-1,796
Cash flow
-13.4%
Cash-on-Cash Return
3.1%
Cap rate
0.5%
Rent to Value Ratio
Active
$215,000
2
bds
|
2
ba
|
889
sqft
|
built
1990
2956 S Semoran Blvd, Orlando, FL 32822
$-260
Cash flow
-6.3%
Cash-on-Cash Return
4.7%
Cap rate
0.7%
Rent to Value Ratio
Active
$145,000
1
bds
|
1
ba
|
636
sqft
|
built
1973
4822 Conway Rd, Orlando, FL 32812
$138
Cash flow
5.0%
Cash-on-Cash Return
7.3%
Cap rate
0.9%
Rent to Value Ratio
Active
$1,899,900
6
bds
|
6
ba
|
5,731
sqft
|
built
2008
5719 Emerson Pointe Way, Orlando, FL 32819
$-5,060
Cash flow
-13.9%
Cash-on-Cash Return
3.0%
Cap rate
0.5%
Rent to Value Ratio
Active
$105,000
2
bds
|
2
ba
|
976
sqft
|
built
1976
4340 Lakeway Dr, Orlando, FL 32839
$-210
Cash flow
-10.4%
Cash-on-Cash Return
3.7%
Cap rate
1.4%
Rent to Value Ratio
Active
$999,000
5
bds
|
4
ba
|
4,127
sqft
|
built
1997
10616 Emerald Chase Dr, Orlando, FL 32836
$-2,724
Cash flow
-14.2%
Cash-on-Cash Return
2.9%
Cap rate
0.6%
Rent to Value Ratio

Active
$187,500
1
bds
|
1
ba
|
408
sqft
|
built
1986
6165 Carrier Dr, Orlando, FL 32819
$-769
Cash flow
-21.4%
Cash-on-Cash Return
1.2%
Cap rate
0.6%
Rent to Value Ratio

Active
$342,000
2
bds
|
1
ba
|
914
sqft
|
built
1952
636 Coke Ave, Winter Garden, FL 34787
$-486
Cash flow
-7.4%
Cash-on-Cash Return
4.4%
Cap rate
0.6%
Rent to Value Ratio

Active
$245,000
2
bds
|
2
ba
|
1,217
sqft
|
built
2001
12008 Villanova Dr, Orlando, FL 32837
$-692
Cash flow
-14.7%
Cash-on-Cash Return
2.8%
Cap rate
0.9%
Rent to Value Ratio
Active
$238,900
2
bds
|
2
ba
|
918
sqft
|
built
1984
142 Windtree Ln, Winter Garden, FL 34787
$-612
Cash flow
-13.4%
Cash-on-Cash Return
3.1%
Cap rate
0.7%
Rent to Value Ratio

Active
$125,000
1
bds
|
1
ba
|
627
sqft
|
built
1989
1091 S Hiawassee Rd, Orlando, FL 32835
$-336
Cash flow
-14.0%
Cash-on-Cash Return
2.9%
Cap rate
1.0%
Rent to Value Ratio