Pinellas County Investment Properties for Sale
Browse homes for sale and investment properties in Pinellas County. Refine your search by price, property type, or more.
Best cash flowing properties in Pinellas County
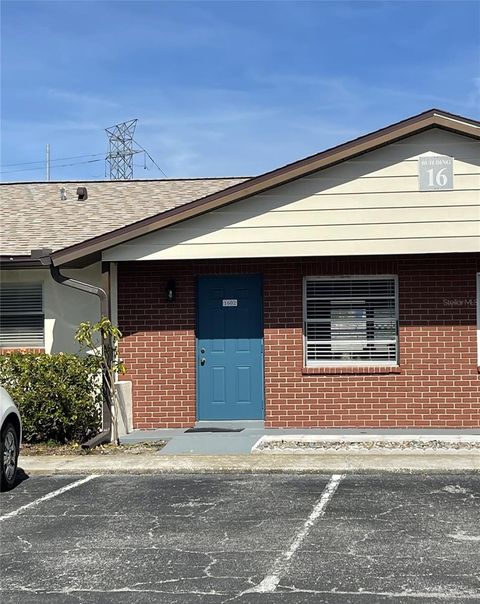
Active
$162,900
1
bds
|
1
ba
|
600
sqft
|
built
1978
24862 US Highway 19 N, Clearwater, FL 33763
$259
Cash flow
8.3%
Cash-on-Cash Return
8.1%
Cap rate
1.0%
Rent to Value Ratio
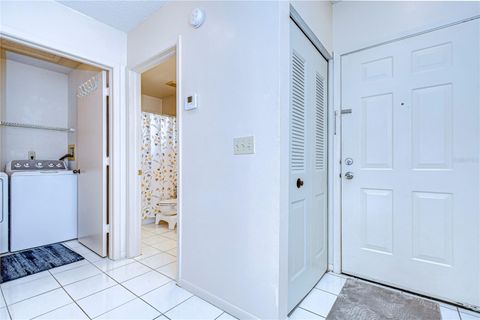
Active
$149,900
1
bds
|
1
ba
|
784
sqft
|
built
1985
1311 Powderpuff Dr, Dunedin, FL 34698
$254
Cash flow
8.8%
Cash-on-Cash Return
8.2%
Cap rate
1.1%
Rent to Value Ratio
1,995 out of 2,636 properties for sale in Pinellas County
Limited Results Shown
Create a free account, or log in to reveal all property listings and enjoy the complete experience.
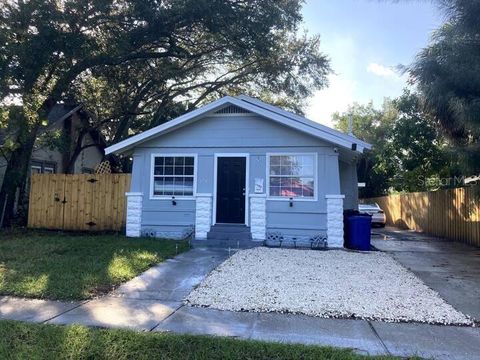
Active
$469,000
5
bds
|
2
ba
|
1,656
sqft
|
built
1925
1743 Yale St S, Saint Petersburg, FL 33712
$-601
Cash flow
-6.7%
Cash-on-Cash Return
4.6%
Cap rate
0.7%
Rent to Value Ratio

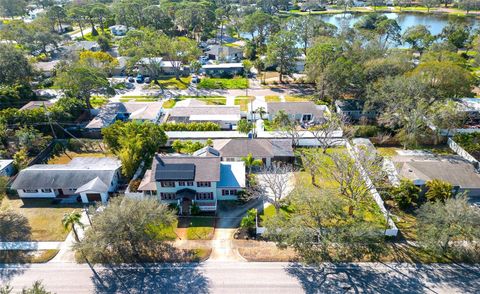
Active
$245,000
2
bds
|
1
ba
|
832
sqft
|
built
1958
1207 Pine Ave NW, Largo, FL 33770
$-44
Cash flow
-0.9%
Cash-on-Cash Return
5.9%
Cap rate
0.7%
Rent to Value Ratio
Active
$1,089,000
5
bds
|
4
ba
|
3,162
sqft
|
built
1926
6342 5th Ave N, Saint Petersburg, FL 33710
$-1,694
Cash flow
-8.1%
Cash-on-Cash Return
4.3%
Cap rate
0.6%
Rent to Value Ratio

Active
$799,999
2
bds
|
1
ba
|
1,062
sqft
|
built
1949
620 Scotland St, Dunedin, FL 34698
$-2,128
Cash flow
-13.9%
Cash-on-Cash Return
3.0%
Cap rate
0.5%
Rent to Value Ratio

Active
$4,390,000
5
bds
|
7
ba
|
5,985
sqft
|
built
2003
26 Sunset Bay Dr, Belleair, FL 33756
$-19,157
Cash flow
-22.8%
Cash-on-Cash Return
0.9%
Cap rate
0.2%
Rent to Value Ratio

Active
$899,000
3
bds
|
2
ba
|
1,553
sqft
|
built
1951
66 Kipling Plz, Clearwater, FL 33767
$-2,321
Cash flow
-13.5%
Cash-on-Cash Return
3.0%
Cap rate
0.6%
Rent to Value Ratio
Active
$399,000
3
bds
|
3
ba
|
1,685
sqft
|
built
1980
440 Lakeview Dr, Palm Harbor, FL 34683
$-1,272
Cash flow
-16.6%
Cash-on-Cash Return
2.3%
Cap rate
0.7%
Rent to Value Ratio
Active
$229,000
2
bds
|
2
ba
|
1,200
sqft
|
built
1969
2623 Seville Blvd, Clearwater, FL 33764
$-186
Cash flow
-4.2%
Cash-on-Cash Return
5.2%
Cap rate
0.8%
Rent to Value Ratio
Active
$1,815,000
4
bds
|
3
ba
|
2,895
sqft
|
built
2015
249 Iron Age St, Safety Harbor, FL 34695
$-4,699
Cash flow
-13.5%
Cash-on-Cash Return
3.0%
Cap rate
0.4%
Rent to Value Ratio

Active
$391,000
3
bds
|
2
ba
|
1,390
sqft
|
built
1986
2567 Bentley Dr, Palm Harbor, FL 34684
$-1,503
Cash flow
-20.1%
Cash-on-Cash Return
1.5%
Cap rate
0.5%
Rent to Value Ratio
Active
$1,299,000
5
bds
|
4
ba
|
3,289
sqft
|
built
1950
614 Maryland Ave, Crystal Beach, FL 34681
$-2,275
Cash flow
-9.1%
Cash-on-Cash Return
4.0%
Cap rate
0.5%
Rent to Value Ratio

Active
$225,500
2
bds
|
2
ba
|
1,115
sqft
|
built
1987
2690 Coral Landings Blvd, Palm Harbor, FL 34684
$-595
Cash flow
-13.8%
Cash-on-Cash Return
3.0%
Cap rate
0.8%
Rent to Value Ratio
Active
$1,280,000
5
bds
|
4
ba
|
2,736
sqft
|
built
1957
11485 1st St E, Treasure Island, FL 33706
$-5,329
Cash flow
-21.7%
Cash-on-Cash Return
1.2%
Cap rate
0.3%
Rent to Value Ratio

Active
$625,000
3
bds
|
2
ba
|
1,345
sqft
|
built
1958
9665 2nd St N, Saint Petersburg, FL 33702
$-1,210
Cash flow
-10.1%
Cash-on-Cash Return
3.8%
Cap rate
0.7%
Rent to Value Ratio

Active
$562,500
3
bds
|
2
ba
|
1,805
sqft
|
built
1958
65 Inness Dr, Tarpon Springs, FL 34689
$-397
Cash flow
-3.7%
Cash-on-Cash Return
5.3%
Cap rate
0.6%
Rent to Value Ratio
Active
$629,900
4
bds
|
2
ba
|
2,017
sqft
|
built
1979
12341 79th Pl, Seminole, FL 33772
$-724
Cash flow
-6.0%
Cash-on-Cash Return
4.8%
Cap rate
0.6%
Rent to Value Ratio

Active
$1,350,000
3
bds
|
2
ba
|
2,108
sqft
|
built
1973
4464 46th Ave S, Saint Petersburg, FL 33711
$-2,044
Cash flow
-7.9%
Cash-on-Cash Return
4.3%
Cap rate
0.6%
Rent to Value Ratio

Active
$360,000
3
bds
|
3
ba
|
1,834
sqft
|
built
2003
102 Brent Cir, Oldsmar, FL 34677
$173
Cash flow
2.5%
Cash-on-Cash Return
6.7%
Cap rate
0.9%
Rent to Value Ratio

Active
$669,000
4
bds
|
3
ba
|
2,270
sqft
|
built
1960
1560 Bel Keene Dr, Clearwater, FL 33756
$-1,132
Cash flow
-8.8%
Cash-on-Cash Return
4.1%
Cap rate
0.6%
Rent to Value Ratio
Active
$249,900
2
bds
|
2
ba
|
1,070
sqft
|
built
1984
3377 Crystal Ct E, Palm Harbor, FL 34685
$-501
Cash flow
-10.5%
Cash-on-Cash Return
3.7%
Cap rate
0.8%
Rent to Value Ratio
Active
$825,000
2
bds
|
2
ba
|
1,100
sqft
|
built
1980
14900 Gulf Blvd, Madeira Beach, FL 33708
$-2,465
Cash flow
-15.6%
Cash-on-Cash Return
2.6%
Cap rate
0.4%
Rent to Value Ratio
Active
$8,995,000
5
bds
|
6
ba
|
6,528
sqft
|
built
2014
15912 Gulf Blvd, Redington Beach, FL 33708
$-46,956
Cash flow
-27.2%
Cash-on-Cash Return
-0.1%
Cap rate
0.1%
Rent to Value Ratio
Active
$380,000
2
bds
|
2
ba
|
1,296
sqft
|
built
1955
1235 45th St N, Saint Petersburg, FL 33713
$-281
Cash flow
-3.9%
Cash-on-Cash Return
5.3%
Cap rate
0.7%
Rent to Value Ratio
Active
$930,000
3
bds
|
2
ba
|
1,568
sqft
|
built
1956
211 Bath Club Blvd N, North Redington Beach, FL 33708
$-1,468
Cash flow
-8.2%
Cash-on-Cash Return
4.3%
Cap rate
0.6%
Rent to Value Ratio

Active
$499,900
2
bds
|
3
ba
|
1,510
sqft
|
built
1967
1613 Druid Rd E, Clearwater, FL 33756
$-922
Cash flow
-9.6%
Cash-on-Cash Return
3.9%
Cap rate
0.6%
Rent to Value Ratio

Active
$999,999
3
bds
|
2
ba
|
1,800
sqft
|
built
1971
430 173rd Ave E, North Redington Beach, FL 33708
$-2,365
Cash flow
-12.3%
Cash-on-Cash Return
3.3%
Cap rate
0.4%
Rent to Value Ratio
Active
$519,500
3
bds
|
2
ba
|
1,541
sqft
|
built
1970
9893 111th St, Seminole, FL 33772
$-584
Cash flow
-5.9%
Cash-on-Cash Return
4.8%
Cap rate
0.7%
Rent to Value Ratio
Active
$799,000
2
bds
|
2
ba
|
1,220
sqft
|
built
1981
17980 Gulf Blvd, Redington Shores, FL 33708
$-1,201
Cash flow
-7.8%
Cash-on-Cash Return
4.3%
Cap rate
0.6%
Rent to Value Ratio
Active
$560,000
3
bds
|
2
ba
|
2,067
sqft
|
built
1987
1016 Teal Pointe, Tarpon Springs, FL 34689
$-1,172
Cash flow
-10.9%
Cash-on-Cash Return
3.6%
Cap rate
0.7%
Rent to Value Ratio

Active
$279,000
2
bds
|
2
ba
|
1,335
sqft
|
built
1972
644 Island Way, Clearwater, FL 33767
$54
Cash flow
1.0%
Cash-on-Cash Return
6.4%
Cap rate
1.0%
Rent to Value Ratio
Active
$521,000
3
bds
|
3
ba
|
2,102
sqft
|
built
2013
1314 Riserva Ln, Palm Harbor, FL 34683
$-1,256
Cash flow
-12.6%
Cash-on-Cash Return
3.3%
Cap rate
0.6%
Rent to Value Ratio
Active
$660,000
2
bds
|
1
ba
|
1,112
sqft
|
built
1981
2406 Gulf Blvd, Indian Rocks Beach, FL 33785
$-1,841
Cash flow
-14.6%
Cash-on-Cash Return
2.8%
Cap rate
0.5%
Rent to Value Ratio
Active
$1,350,000
6
bds
|
4
ba
|
3,000
sqft
|
built
1995
108 20th Ave, Indian Rocks Beach, FL 33785
$-5,273
Cash flow
-20.4%
Cash-on-Cash Return
1.5%
Cap rate
0.3%
Rent to Value Ratio
Active
$2,590,000
4
bds
|
3
ba
|
2,420
sqft
|
built
1959
1818 Dolphin Blvd S, Saint Petersburg, FL 33707
$-8,424
Cash flow
-17.0%
Cash-on-Cash Return
2.2%
Cap rate
0.3%
Rent to Value Ratio

Active
$279,000
1
bds
|
1
ba
|
865
sqft
|
built
1963
10355 Paradise Blvd, Treasure Island, FL 33706
$-51
Cash flow
-1.0%
Cash-on-Cash Return
5.9%
Cap rate
0.9%
Rent to Value Ratio
Active
$459,000
3
bds
|
2
ba
|
1,572
sqft
|
built
1979
7711 Innis Ct, Saint Petersburg, FL 33709
$-226
Cash flow
-2.6%
Cash-on-Cash Return
5.6%
Cap rate
0.7%
Rent to Value Ratio
Active
$492,900
2
bds
|
2
ba
|
1,185
sqft
|
built
1983
2700 Bayshore Blvd, Dunedin, FL 34698
$-870
Cash flow
-9.2%
Cash-on-Cash Return
4.0%
Cap rate
0.6%
Rent to Value Ratio

Active
$175,000
2
bds
|
2
ba
|
900
sqft
|
built
1973
2700 Bayshore Blvd, Dunedin, FL 34698
$238
Cash flow
7.1%
Cash-on-Cash Return
7.8%
Cap rate
1.1%
Rent to Value Ratio