Pinellas County Investment Properties for Sale
Browse homes for sale and investment properties in Pinellas County. Refine your search by price, property type, or more.
Best cash flowing properties in Pinellas County
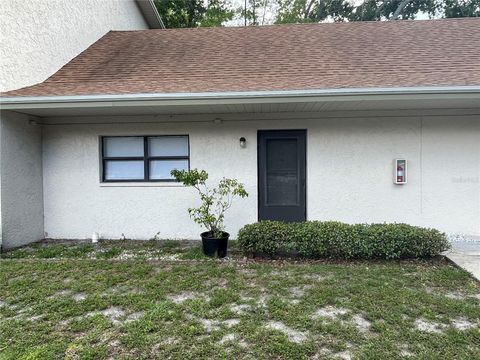
Active
$134,900
2
bds
|
1
ba
|
687
sqft
|
built
1986
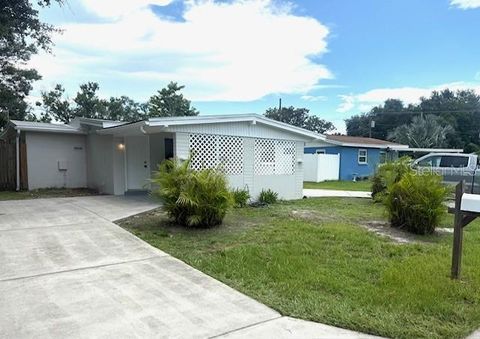
2142 Bradford St, Clearwater, FL 33760
$157
Cash flow
6.1%
Cash-on-Cash Return
7.5%
Cap rate
1.0%
Rent to Value Ratio
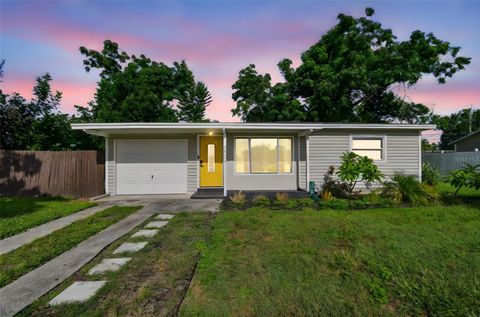
Active
$275,000
2
bds
|
1
ba
|
720
sqft
|
built
1955
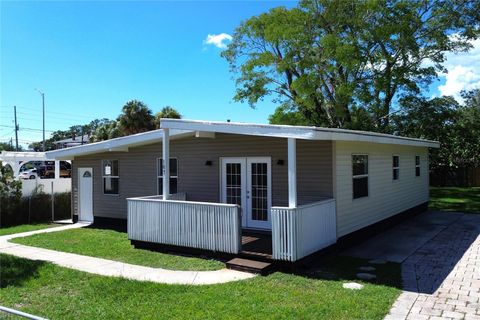
6524 14th St N, Saint Petersburg, FL 33702
$69
Cash flow
1.3%
Cash-on-Cash Return
6.4%
Cap rate
0.8%
Rent to Value Ratio
2,066 out of 2,732 properties for sale in Pinellas County
Limited Results Shown
Create a free account, or log in to reveal all property listings and enjoy the complete experience.
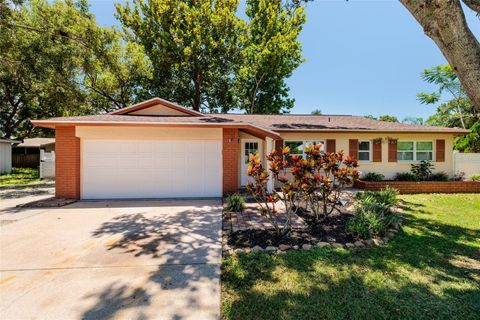
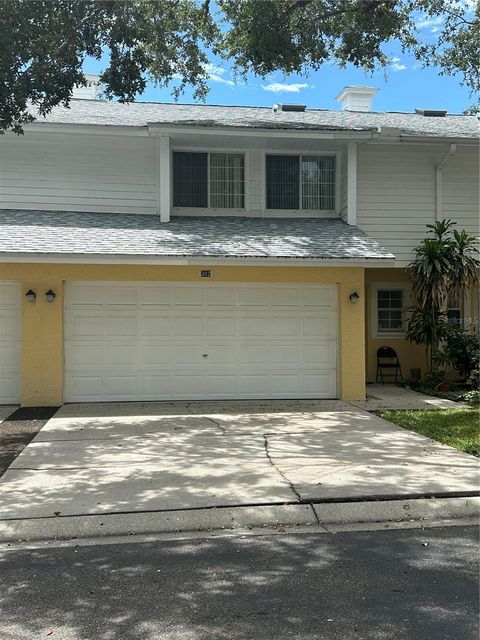
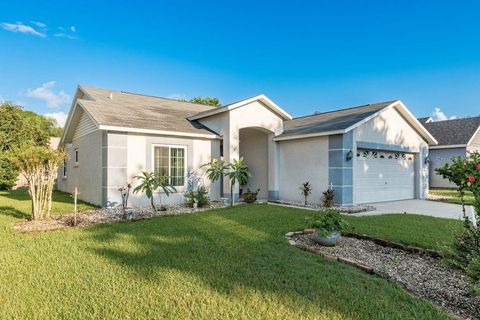
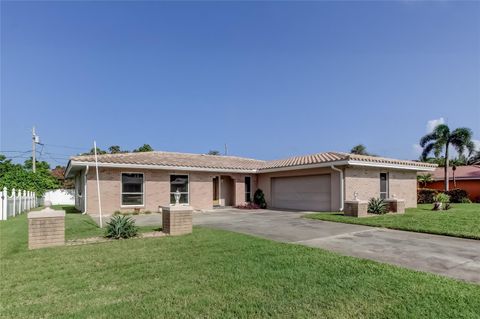
Active
$425,000
3
bds
|
2
ba
|
1,352
sqft
|
built
1982
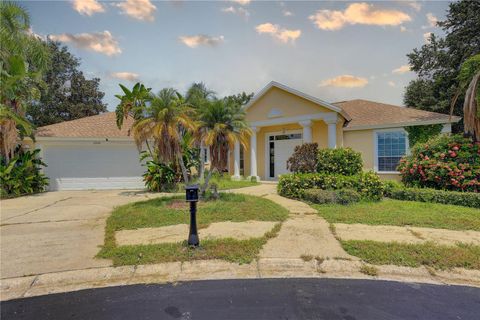
2314 Landon Ter, Palm Harbor, FL 34683
$-728
Cash flow
-8.9%
Cash-on-Cash Return
4.1%
Cap rate
0.7%
Rent to Value Ratio
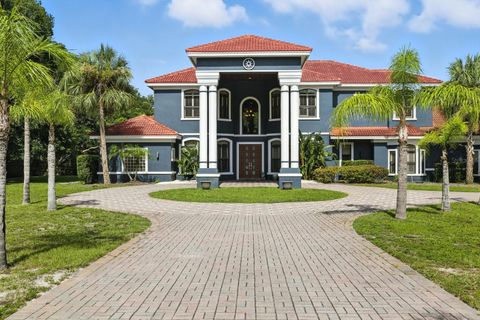
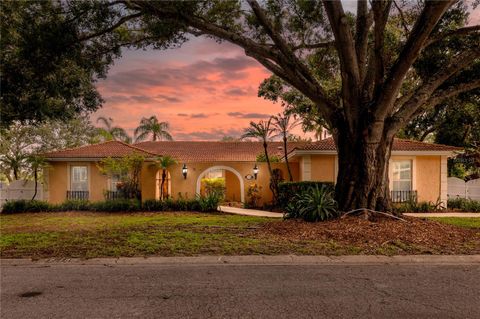
Active
$1,900,000
5
bds
|
7
ba
|
5,082
sqft
|
built
2009
2555 Bryan Ln, Tarpon Springs, FL 34688
$-4,873
Cash flow
-13.4%
Cash-on-Cash Return
3.1%
Cap rate
0.5%
Rent to Value Ratio
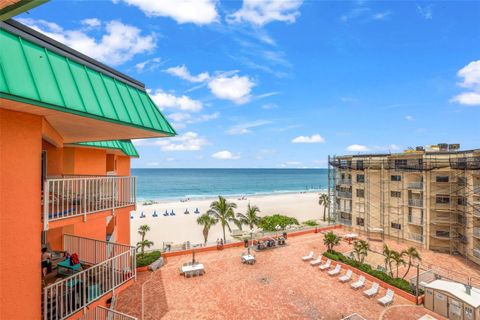
Active
$2,300,000
3
bds
|
2
ba
|
2,227
sqft
|
built
2000
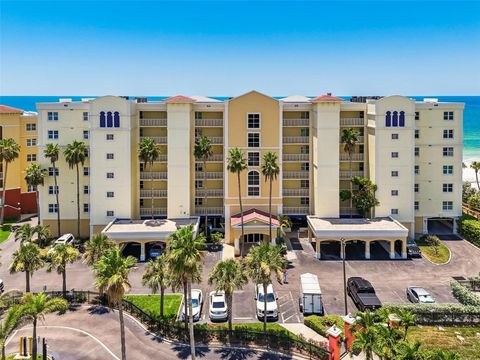
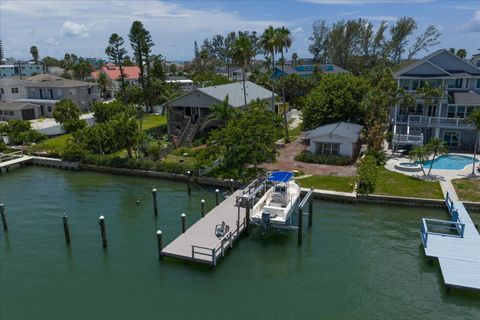
16750 Gulf Blvd, North Redington Beach, FL 33708
$-11,152
Cash flow
-25.3%
Cash-on-Cash Return
0.3%
Cap rate
0.2%
Rent to Value Ratio
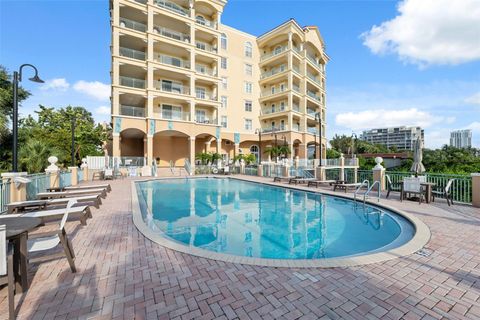
Active
$680,000
2
bds
|
2
ba
|
1,593
sqft
|
built
2004
700 N Osceola Ave, Clearwater, FL 33755
$-2,038
Cash flow
-15.6%
Cash-on-Cash Return
2.6%
Cap rate
0.5%
Rent to Value Ratio
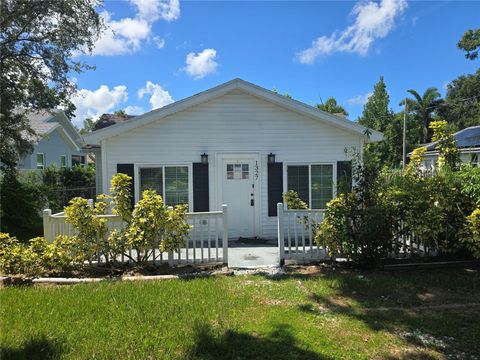
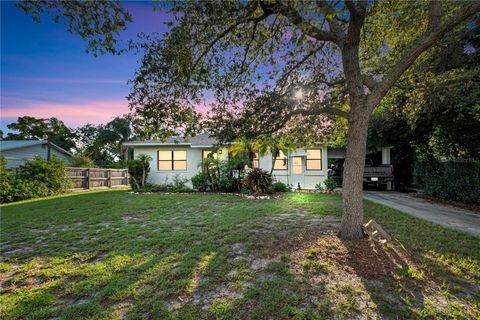
Active
$345,000
3
bds
|
2
ba
|
1,312
sqft
|
built
1925
1327 Georgia Ave, Dunedin, FL 34698
$-272
Cash flow
-4.1%
Cash-on-Cash Return
5.2%
Cap rate
0.8%
Rent to Value Ratio
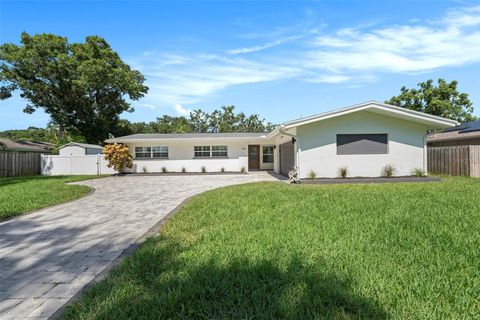
Active
$535,000
4
bds
|
3
ba
|
1,805
sqft
|
built
1959
1316 Dorothy Dr, Clearwater, FL 33764
$-611
Cash flow
-6.0%
Cash-on-Cash Return
4.8%
Cap rate
0.7%
Rent to Value Ratio
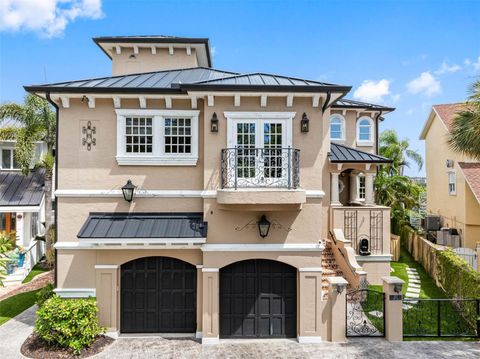
Active
$2,100,000
4
bds
|
4
ba
|
2,990
sqft
|
built
2003
511 Seaview Dr, Tarpon Springs, FL 34689
$-8,304
Cash flow
-20.6%
Cash-on-Cash Return
1.4%
Cap rate
0.3%
Rent to Value Ratio
Active
$610,000
3
bds
|
2
ba
|
1,836
sqft
|
built
2020
960 Starkey Rd, Largo, FL 33771
$-1,669
Cash flow
-14.3%
Cash-on-Cash Return
2.9%
Cap rate
0.6%
Rent to Value Ratio
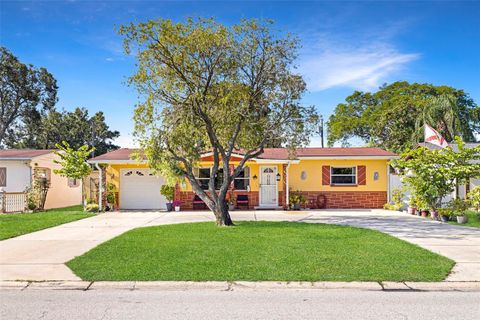
Active
$265,000
2
bds
|
1
ba
|
848
sqft
|
built
1928
711 Smith St, Clearwater, FL 33756
$-206
Cash flow
-4.1%
Cash-on-Cash Return
5.2%
Cap rate
0.8%
Rent to Value Ratio
Active
$425,000
2
bds
|
1
ba
|
825
sqft
|
built
1979
5266 Beach Dr SE, Saint Petersburg, FL 33705
$-747
Cash flow
-9.2%
Cash-on-Cash Return
4.0%
Cap rate
0.7%
Rent to Value Ratio
Active
$4,500,000
5
bds
|
0
ba
|
3,090
sqft
|
built
1932
516 Gulf Blvd, Indian Rocks Beach, FL 33785
$-22,666
Cash flow
-26.3%
Cash-on-Cash Return
0.1%
Cap rate
0.1%
Rent to Value Ratio
Active
$549,900
5
bds
|
4
ba
|
2,669
sqft
|
built
1979
624 Baynard Dr, Tarpon Springs, FL 34689
$-888
Cash flow
-8.4%
Cash-on-Cash Return
4.2%
Cap rate
0.6%
Rent to Value Ratio
Active
$355,000
3
bds
|
1
ba
|
852
sqft
|
built
1954
608 Edenville Ave, Clearwater, FL 33764
$-508
Cash flow
-7.5%
Cash-on-Cash Return
4.4%
Cap rate
0.7%
Rent to Value Ratio
Active
$569,900
3
bds
|
2
ba
|
2,128
sqft
|
built
1980
828 Lakeside Ter, Palm Harbor, FL 34683
$-1,016
Cash flow
-9.3%
Cash-on-Cash Return
4.0%
Cap rate
0.6%
Rent to Value Ratio
Active
$389,900
3
bds
|
3
ba
|
1,596
sqft
|
built
2005
1124 Sunset Point Rd, Clearwater, FL 33755
$-1,117
Cash flow
-14.9%
Cash-on-Cash Return
2.7%
Cap rate
0.7%
Rent to Value Ratio
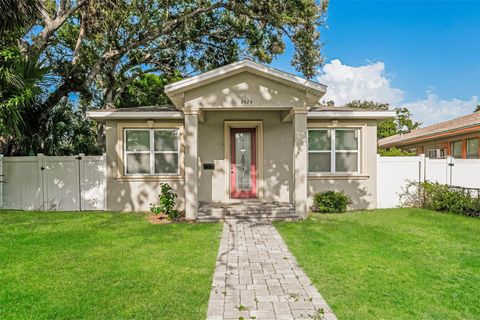
Active
$407,000
3
bds
|
2
ba
|
1,800
sqft
|
built
2019
2424 12th St S, Saint Petersburg, FL 33705
$-540
Cash flow
-6.9%
Cash-on-Cash Return
4.6%
Cap rate
0.8%
Rent to Value Ratio
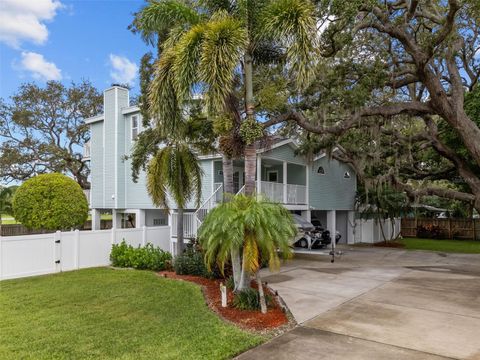
Active
$939,000
3
bds
|
4
ba
|
2,686
sqft
|
built
1983
405 Charleston Ave, Crystal Beach, FL 34681
$-1,901
Cash flow
-10.6%
Cash-on-Cash Return
3.7%
Cap rate
0.5%
Rent to Value Ratio
Active
$499,000
2
bds
|
1
ba
|
2,036
sqft
|
built
1964
563 Gershwin Dr, Largo, FL 33771
$-1,207
Cash flow
-12.6%
Cash-on-Cash Return
3.2%
Cap rate
0.4%
Rent to Value Ratio
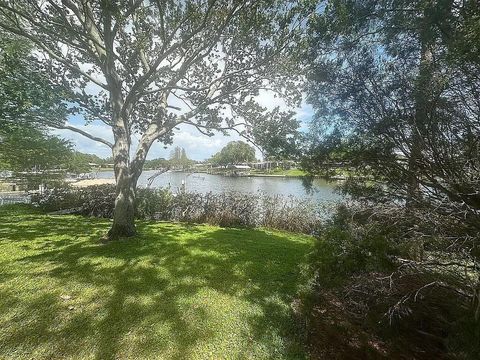
Active
$380,000
3
bds
|
2
ba
|
1,342
sqft
|
built
1997
1489 Ridge Shore Dr, Tarpon Springs, FL 34689
$-535
Cash flow
-7.3%
Cash-on-Cash Return
4.5%
Cap rate
0.7%
Rent to Value Ratio
Active
$748,000
4
bds
|
2
ba
|
2,166
sqft
|
built
1974
2370 Weymouth Dr, Clearwater, FL 33764
$-1,716
Cash flow
-12.0%
Cash-on-Cash Return
3.4%
Cap rate
0.5%
Rent to Value Ratio
Active
$800,000
2
bds
|
2
ba
|
1,400
sqft
|
built
1982
18400 Gulf Blvd, Indian Shores, FL 33785
$-2,547
Cash flow
-16.6%
Cash-on-Cash Return
2.3%
Cap rate
0.4%
Rent to Value Ratio
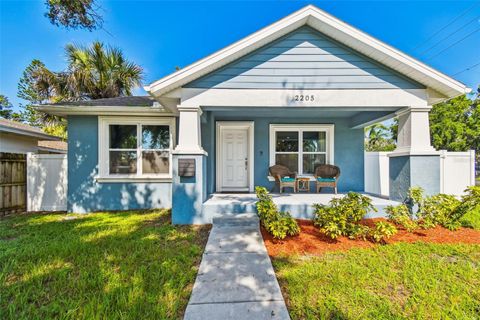
Active
$485,000
3
bds
|
2
ba
|
1,536
sqft
|
built
2022
2205 Quincy St S, Saint Petersburg, FL 33711
$-792
Cash flow
-8.5%
Cash-on-Cash Return
4.2%
Cap rate
0.7%
Rent to Value Ratio
Active
$645,000
4
bds
|
3
ba
|
2,294
sqft
|
built
1970
10440 Monarch Dr, Largo, FL 33774
$-1,216
Cash flow
-9.8%
Cash-on-Cash Return
3.9%
Cap rate
0.5%
Rent to Value Ratio
Active
$399,900
2
bds
|
2
ba
|
1,296
sqft
|
built
1950
553 Jefferson St, Palm Harbor, FL 34683
$-471
Cash flow
-6.1%
Cash-on-Cash Return
4.7%
Cap rate
0.6%
Rent to Value Ratio
Active
$2,650,000
5
bds
|
5
ba
|
3,355
sqft
|
built
2004
357 12th Ave, Indian Rocks Beach, FL 33785
$-9,723
Cash flow
-19.1%
Cash-on-Cash Return
1.7%
Cap rate
0.4%
Rent to Value Ratio
Active
$345,000
2
bds
|
1
ba
|
850
sqft
|
built
1961
4360 82nd Ave N, Pinellas Park, FL 33781
$-336
Cash flow
-5.1%
Cash-on-Cash Return
5.0%
Cap rate
0.6%
Rent to Value Ratio
Active
$580,000
3
bds
|
2
ba
|
1,728
sqft
|
built
1974
1437 Cottonwood Ter, Dunedin, FL 34698
$-1,070
Cash flow
-9.6%
Cash-on-Cash Return
3.9%
Cap rate
0.6%
Rent to Value Ratio
Active
$725,000
3
bds
|
2
ba
|
2,069
sqft
|
built
1971
3063 Rosemary Dr, Largo, FL 33770
$-1,897
Cash flow
-13.7%
Cash-on-Cash Return
3.0%
Cap rate
0.4%
Rent to Value Ratio
Active
$529,900
3
bds
|
2
ba
|
1,662
sqft
|
built
1971
2390 66th Ave S, Saint Petersburg, FL 33712
$-816
Cash flow
-8.0%
Cash-on-Cash Return
4.3%
Cap rate
0.7%
Rent to Value Ratio
Active
$289,900
3
bds
|
1
ba
|
902
sqft
|
built
1956
1593 76th Ave N, Saint Petersburg, FL 33702
$-231
Cash flow
-4.2%
Cash-on-Cash Return
5.2%
Cap rate
0.8%
Rent to Value Ratio
Active
$1,480,000
3
bds
|
3
ba
|
1,556
sqft
|
built
1941
8405 Bayshore Dr, Treasure Island, FL 33706
$-5,579
Cash flow
-19.7%
Cash-on-Cash Return
1.6%
Cap rate
0.2%
Rent to Value Ratio
Active
$300,000
3
bds
|
2
ba
|
1,140
sqft
|
built
1956
10980 106th Way, Largo, FL 33773
$-453
Cash flow
-7.9%
Cash-on-Cash Return
4.3%
Cap rate
0.6%
Rent to Value Ratio
Active
$300,000
3
bds
|
2
ba
|
1,102
sqft
|
built
1959
107 E Spruce St, Tarpon Springs, FL 34689
$-169
Cash flow
-2.9%
Cash-on-Cash Return
5.5%
Cap rate
0.8%
Rent to Value Ratio
Active
$985,000
4
bds
|
4
ba
|
3,365
sqft
|
built
1990
2208 Hampstead Ct, Safety Harbor, FL 34695
$-3,022
Cash flow
-16.0%
Cash-on-Cash Return
2.5%
Cap rate
0.5%
Rent to Value Ratio
Active
$690,000
3
bds
|
2
ba
|
1,141
sqft
|
built
1955
572 Baywood Dr N, Dunedin, FL 34698
$-1,726
Cash flow
-13.1%
Cash-on-Cash Return
3.1%
Cap rate
0.5%
Rent to Value Ratio
Active
$1,200,000
2
bds
|
2
ba
|
1,165
sqft
|
built
1980
17900 Gulf Blvd, Redington Shores, FL 33708
$-3,789
Cash flow
-16.5%
Cash-on-Cash Return
2.4%
Cap rate
0.4%
Rent to Value Ratio
Active
$369,000
3
bds
|
2
ba
|
1,365
sqft
|
built
1961
2233 Terrace Dr N, Clearwater, FL 33765
$-752
Cash flow
-10.6%
Cash-on-Cash Return
3.7%
Cap rate
0.5%
Rent to Value Ratio
Active
$364,900
3
bds
|
2
ba
|
1,522
sqft
|
built
1958
10701 Village Green Ave, Seminole, FL 33772
$-46
Cash flow
-0.7%
Cash-on-Cash Return
6.0%
Cap rate
0.8%
Rent to Value Ratio