Frankfort, IL Investment Properties for Sale
Browse homes for sale and investment properties in Frankfort, IL. Refine your search by price, property type, or more.
Best cash flowing properties in Frankfort, IL
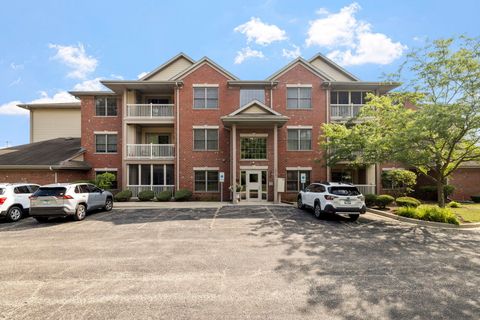
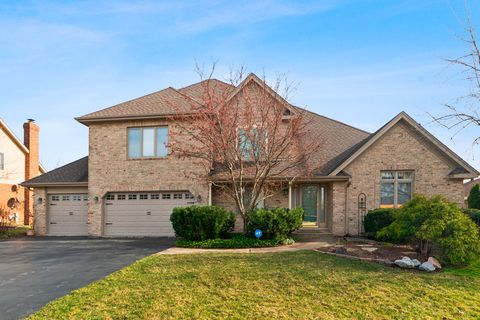
Active
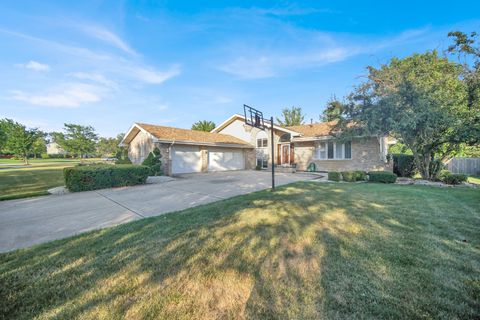
$269,000
3
bds
|
2
ba
|
1,402
sqft
|
built
2005
20301 S Pine Hill Rd, Frankfort, IL 60423
$-61
Cash flow
-1.2%
Cash-on-Cash Return
5.4%
Cap rate
0.9%
Rent to Value Ratio
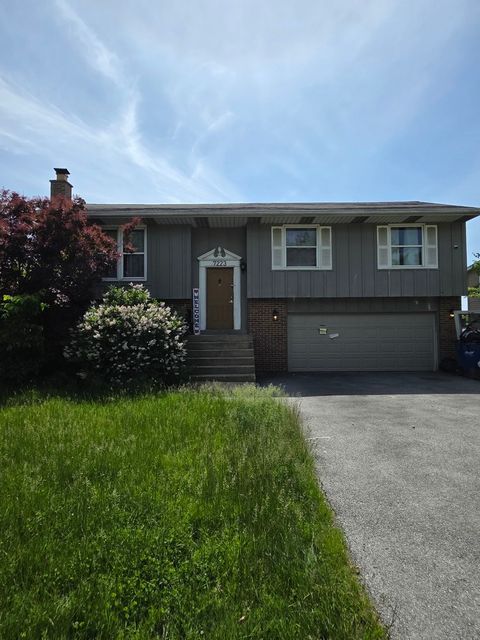
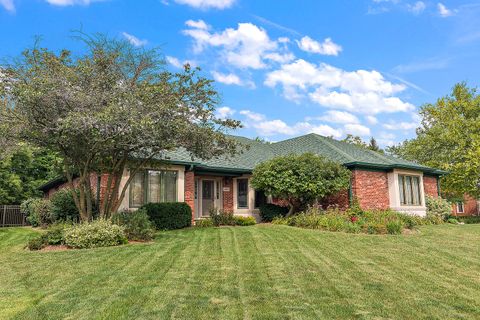
Active
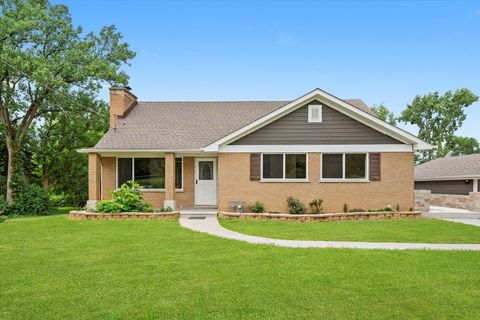
$310,000
4
bds
|
2
ba
|
1,480
sqft
|
built
1986
7223 W Mathews Dr, Frankfort, IL 60423
$-106
Cash flow
-1.8%
Cash-on-Cash Return
5.3%
Cap rate
0.9%
Rent to Value Ratio
18 out of 22 properties for sale in Frankfort, IL
Limited Results Shown
Create a free account, or log in to reveal all property listings and enjoy the complete experience.
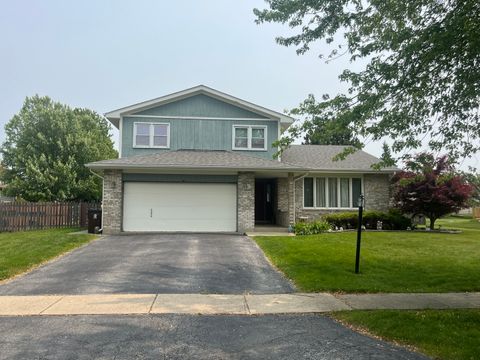
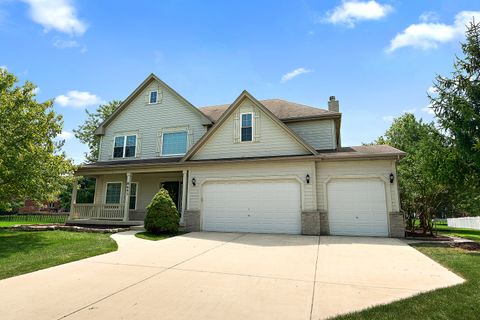
Active
$399,000
3
bds
|
3
ba
|
2,068
sqft
|
built
1991
20347 S Grand Prairie Ln, Frankfort, IL 60423
$-527
Cash flow
-6.9%
Cash-on-Cash Return
4.1%
Cap rate
0.8%
Rent to Value Ratio
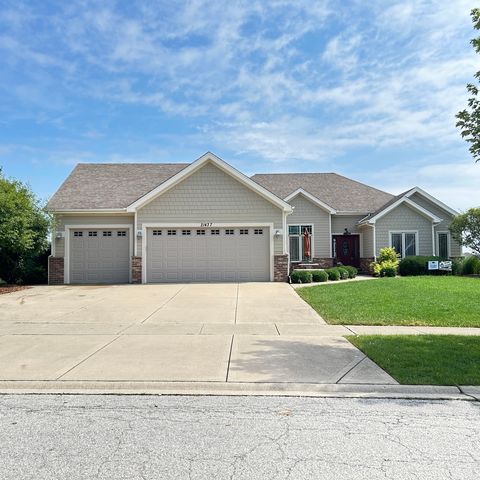
Active
$724,900
6
bds
|
3
ba
|
2,305
sqft
|
built
2008
21437 Breton Rd, Frankfort, IL 60423
$-1,884
Cash flow
-13.6%
Cash-on-Cash Return
2.6%
Cap rate
0.5%
Rent to Value Ratio
Active
$559,900
4
bds
|
4
ba
|
2,830
sqft
|
built
1996
8899 Charrington Dr, Frankfort, IL 60423
$-1,095
Cash flow
-10.2%
Cash-on-Cash Return
3.3%
Cap rate
0.7%
Rent to Value Ratio

Active
$499,900
3
bds
|
3
ba
|
2,553
sqft
|
built
1996
8905 Brown Dr, Frankfort, IL 60423
$-860
Cash flow
-9.0%
Cash-on-Cash Return
3.6%
Cap rate
0.8%
Rent to Value Ratio

Active
$585,000
5
bds
|
4
ba
|
3,736
sqft
|
built
1993
21331 Georgetown Rd, Frankfort, IL 60423
$-753
Cash flow
-6.7%
Cash-on-Cash Return
4.1%
Cap rate
0.8%
Rent to Value Ratio
Active
$739,900
3
bds
|
4
ba
|
2,652
sqft
|
built
1999
10993 Pioneer Trl, Frankfort, IL 60423
$-2,063
Cash flow
-14.5%
Cash-on-Cash Return
2.3%
Cap rate
0.5%
Rent to Value Ratio

Active
$769,900
5
bds
|
4
ba
|
4,000
sqft
|
built
2006
20350 Port Washington Ct, Frankfort, IL 60423
$-1,250
Cash flow
-8.5%
Cash-on-Cash Return
3.7%
Cap rate
0.8%
Rent to Value Ratio

Active
$950,000
4
bds
|
5
ba
|
5,133
sqft
|
built
2022
22664 Oakfield Dr, Frankfort, IL 60423
$-2,665
Cash flow
-14.6%
Cash-on-Cash Return
2.3%
Cap rate
0.6%
Rent to Value Ratio

Active
$924,900
4
bds
|
4
ba
|
3,636
sqft
|
built
1999
22454 Hinspeter Dr, Frankfort, IL 60423
$-2,531
Cash flow
-14.3%
Cash-on-Cash Return
2.4%
Cap rate
0.5%
Rent to Value Ratio
Active
$574,900
4
bds
|
3
ba
|
2,780
sqft
|
built
2004
8643 Shire Ct, Frankfort, IL 60423
$-1,451
Cash flow
-13.2%
Cash-on-Cash Return
2.7%
Cap rate
0.6%
Rent to Value Ratio

Active
$850,000
5
bds
|
4
ba
|
4,013
sqft
|
built
2006
11392 Mc Kenna Dr, Frankfort, IL 60423
$-1,545
Cash flow
-9.5%
Cash-on-Cash Return
3.5%
Cap rate
0.6%
Rent to Value Ratio
Active
$344,000
3
bds
|
2
ba
|
1,480
sqft
|
built
2003
8310 Auburn Ln, Frankfort, IL 60423
$-491
Cash flow
-7.4%
Cash-on-Cash Return
4.0%
Cap rate
0.8%
Rent to Value Ratio
Active
$490,000
3
bds
|
3
ba
|
2,946
sqft
|
built
1991
21375 Georgetown Rd, Frankfort, IL 60423
$-702
Cash flow
-7.5%
Cash-on-Cash Return
4.0%
Cap rate
0.7%
Rent to Value Ratio

Active
$875,000
3
bds
|
3
ba
|
3,300
sqft
|
built
2015
20042 Brendan St, Frankfort, IL 60423
$-3,148
Cash flow
-18.8%
Cash-on-Cash Return
1.4%
Cap rate
0.4%
Rent to Value Ratio
Active
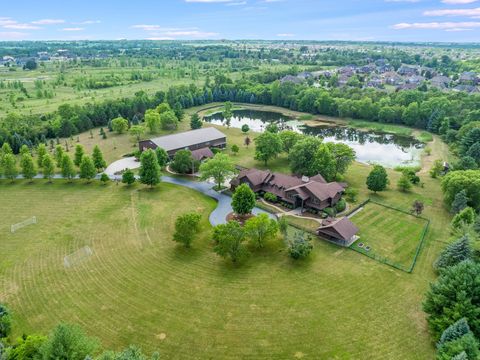
$3,100,000
8
bds
|
7
ba
|
6,990
sqft
|
built
1992
22660 S Harlem Ave, Frankfort, IL 60423
$-11,294
Cash flow
-19.0%
Cash-on-Cash Return
1.3%
Cap rate
0.3%
Rent to Value Ratio
Active
$540,000
3
bds
|
3
ba
|
2,202
sqft
|
built
1930
21122 S Hillside Rd, Frankfort, IL 60423
$-746
Cash flow
-7.2%
Cash-on-Cash Return
4.0%
Cap rate
0.6%
Rent to Value Ratio