Frankfort, IL Investment Properties for Sale
Browse homes for sale and investment properties in Frankfort, IL. Refine your search by price, property type, or more.
Best cash flowing properties in Frankfort, IL
Active
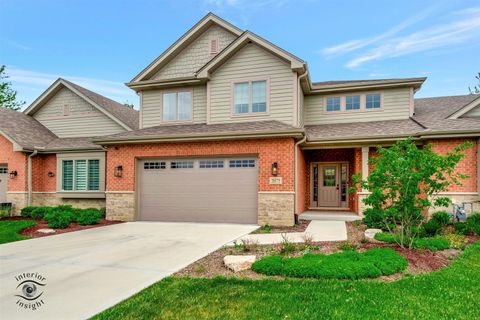
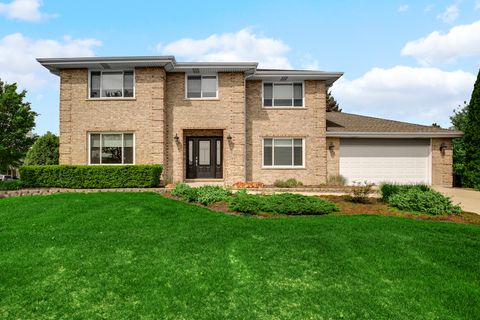
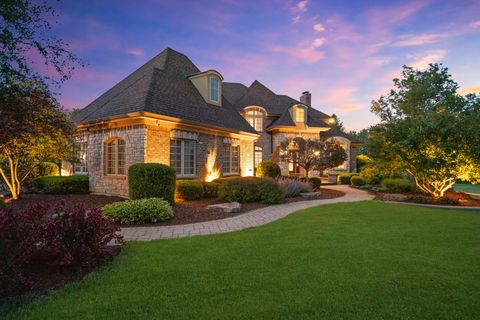
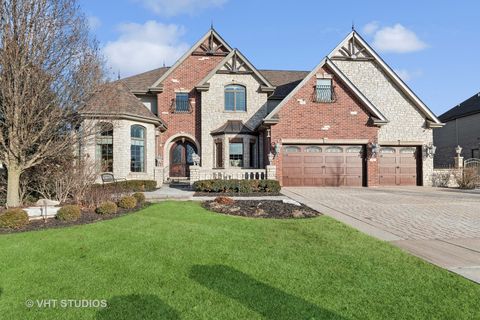
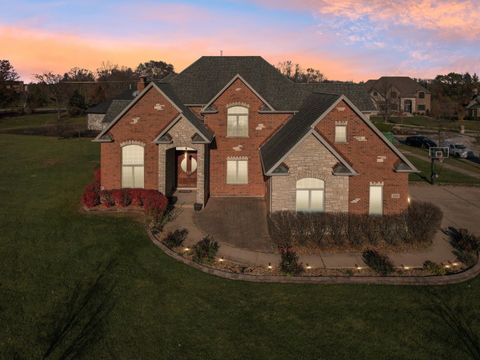
$609,900
3
bds
|
3
ba
|
2,615
sqft
|
built
2023
20375 Grosse Point Dr, Frankfort, IL 60423
$-53
Cash flow
-0.5%
Cash-on-Cash Return
5.6%
Cap rate
0.7%
Rent to Value Ratio
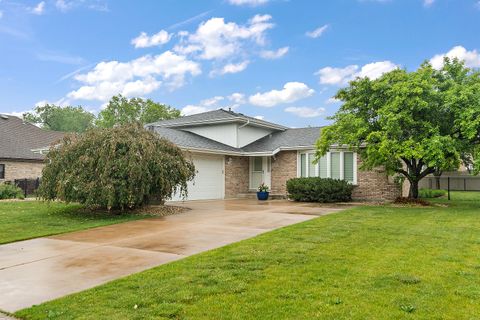
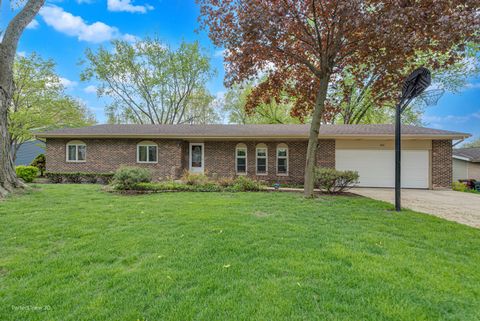
Active
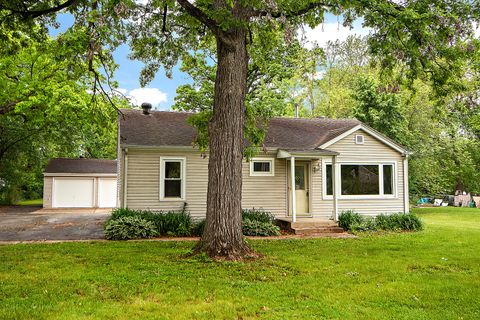
$339,000
3
bds
|
1
ba
|
1,156
sqft
|
built
1952
21402 S 79th Ave, Frankfort, IL 60423
$-371
Cash flow
-5.7%
Cash-on-Cash Return
4.4%
Cap rate
0.8%
Rent to Value Ratio
23 out of 42 properties for sale in Frankfort, IL
Limited Results Shown
Create a free account, or log in to reveal all property listings and enjoy the complete experience.
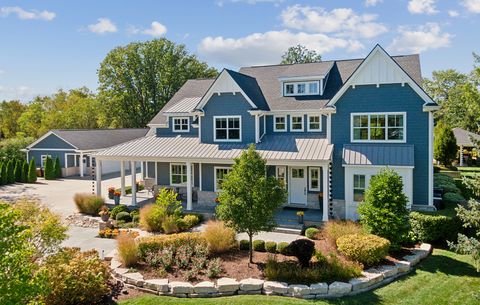
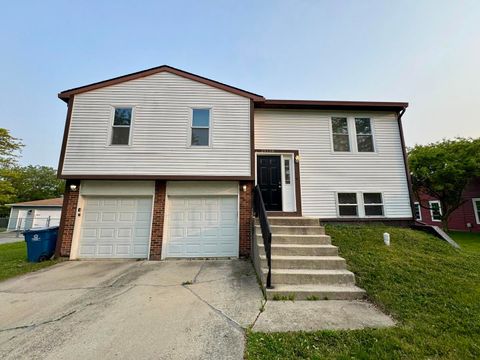
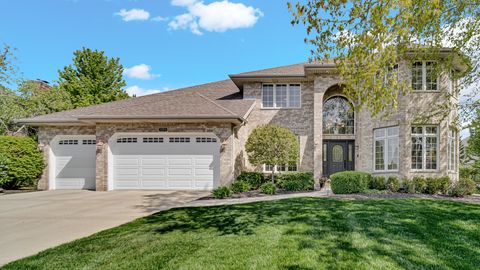
Active
$575,000
3
bds
|
3
ba
|
2,784
sqft
|
built
2003
22314 Jeanette Ct, Frankfort, IL 60423
$-1,299
Cash flow
-11.8%
Cash-on-Cash Return
3.6%
Cap rate
0.7%
Rent to Value Ratio

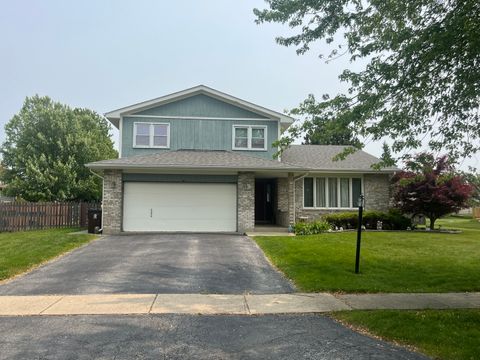
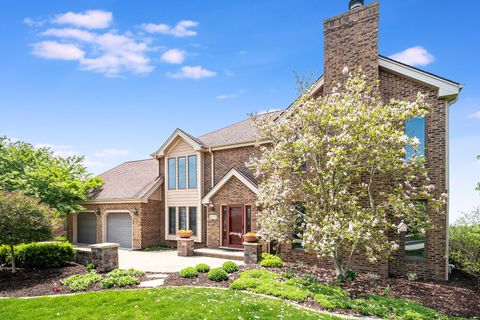
Active
$584,900
4
bds
|
4
ba
|
4,000
sqft
|
built
1990
172 Hamilton Ave, Frankfort, IL 60423
$-1,036
Cash flow
-9.2%
Cash-on-Cash Return
3.6%
Cap rate
0.7%
Rent to Value Ratio
Active
$3,375,000
4
bds
|
7
ba
|
6,500
sqft
|
built
2019
320 N 95th Ave, Frankfort, IL 60423
$-16,553
Cash flow
-25.6%
Cash-on-Cash Return
-0.2%
Cap rate
0.1%
Rent to Value Ratio
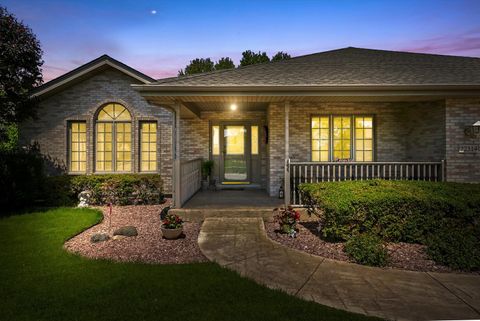
Active
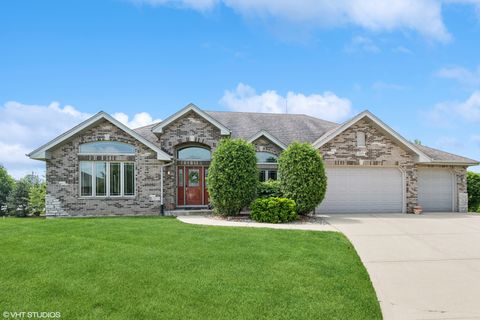
$549,900
4
bds
|
3
ba
|
2,870
sqft
|
built
1993
22250 Heritage Dr, Frankfort, IL 60423
$-978
Cash flow
-9.3%
Cash-on-Cash Return
3.5%
Cap rate
0.7%
Rent to Value Ratio
Active
$429,900
3
bds
|
2
ba
|
2,000
sqft
|
built
1989
20427 S White Fence Ct, Frankfort, IL 60423
$-561
Cash flow
-6.8%
Cash-on-Cash Return
4.1%
Cap rate
0.7%
Rent to Value Ratio
Active
$360,000
4
bds
|
2
ba
|
1,150
sqft
|
built
1989
20158 S Rosewood Dr, Frankfort, IL 60423
$-401
Cash flow
-5.8%
Cash-on-Cash Return
4.3%
Cap rate
0.8%
Rent to Value Ratio
Active
$447,999
3
bds
|
3
ba
|
2,068
sqft
|
built
1991
20347 S Grand Prairie Ln, Frankfort, IL 60423
$-730
Cash flow
-8.5%
Cash-on-Cash Return
3.7%
Cap rate
0.7%
Rent to Value Ratio
Active
$1,250,000
4
bds
|
6
ba
|
6,675
sqft
|
built
2009
24355 S Arranmore Way, Frankfort, IL 60423
$-2,090
Cash flow
-8.7%
Cash-on-Cash Return
3.7%
Cap rate
0.6%
Rent to Value Ratio
Active
$975,000
5
bds
|
5
ba
|
6,683
sqft
|
built
2006
22844 Lakeview Estates Blvd, Frankfort, IL 60423
$-1,102
Cash flow
-5.9%
Cash-on-Cash Return
4.3%
Cap rate
0.7%
Rent to Value Ratio
Active
$724,900
4
bds
|
4
ba
|
6,200
sqft
|
built
2008
9265 Maura Ct, Frankfort, IL 60423
$-1,863
Cash flow
-13.4%
Cash-on-Cash Return
2.6%
Cap rate
0.6%
Rent to Value Ratio
Active
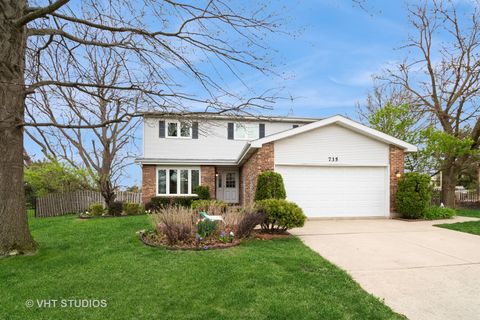
$445,000
4
bds
|
3
ba
|
2,173
sqft
|
built
1987
735 Vermont Rd W, Frankfort, IL 60423
$-558
Cash flow
-6.5%
Cash-on-Cash Return
4.2%
Cap rate
0.7%
Rent to Value Ratio
Active
$1,325,000
4
bds
|
5
ba
|
5,180
sqft
|
built
2012
22957 Devonshire Ln, Frankfort, IL 60423
$-2,930
Cash flow
-11.5%
Cash-on-Cash Return
3.0%
Cap rate
0.6%
Rent to Value Ratio
Active
$339,000
3
bds
|
1
ba
|
1,156
sqft
|
built
1952
21402 S 79th Ave, Frankfort, IL 60423
$-371
Cash flow
-5.7%
Cash-on-Cash Return
4.4%
Cap rate
0.8%
Rent to Value Ratio
Active
$699,000
4
bds
|
4
ba
|
4,714
sqft
|
built
2001
11764 Azure Dr, Frankfort, IL 60423
$-1,633
Cash flow
-12.2%
Cash-on-Cash Return
2.9%
Cap rate
0.6%
Rent to Value Ratio
Active
$450,000
3
bds
|
3
ba
|
1,896
sqft
|
built
1973
400 Illinois Rd, Frankfort, IL 60423
$-571
Cash flow
-6.6%
Cash-on-Cash Return
4.2%
Cap rate
0.7%
Rent to Value Ratio
Active
$598,000
4
bds
|
4
ba
|
4,204
sqft
|
built
1991
21978 Princeton Cir, Frankfort, IL 60423
$-389
Cash flow
-3.4%
Cash-on-Cash Return
4.9%
Cap rate
0.8%
Rent to Value Ratio
Active
$409,900
5
bds
|
2
ba
|
0
sqft
|
built
1972
20216 S Greenfield Ln, Frankfort, IL 60423
$-692
Cash flow
-8.8%
Cash-on-Cash Return
3.7%
Cap rate
0.7%
Rent to Value Ratio
Active
$346,000
3
bds
|
2
ba
|
1,488
sqft
|
built
1975
20513 S Acorn Ridge Dr, Frankfort, IL 60423
$-516
Cash flow
-7.8%
Cash-on-Cash Return
3.9%
Cap rate
0.7%
Rent to Value Ratio
Active
$670,000
3
bds
|
4
ba
|
3,559
sqft
|
built
2004
20187 Waterview Trl, Frankfort, IL 60423
$-1,624
Cash flow
-12.6%
Cash-on-Cash Return
2.8%
Cap rate
0.7%
Rent to Value Ratio
Active
$625,000
3
bds
|
4
ba
|
3,952
sqft
|
built
1999
10164 Frankfort Main, Frankfort, IL 60423
$-812
Cash flow
-6.8%
Cash-on-Cash Return
4.1%
Cap rate
0.8%
Rent to Value Ratio

Active
$1,850,000
7
bds
|
9
ba
|
10,701
sqft
|
built
2000
20659 Abbey Dr, Frankfort, IL 60423
$-5,053
Cash flow
-14.3%
Cash-on-Cash Return
2.4%
Cap rate
0.5%
Rent to Value Ratio
Active
$609,900
3
bds
|
3
ba
|
2,615
sqft
|
built
2023
20375 Grosse Point Dr, Frankfort, IL 60423
$-53
Cash flow
-0.5%
Cash-on-Cash Return
5.6%
Cap rate
0.7%
Rent to Value Ratio
Active
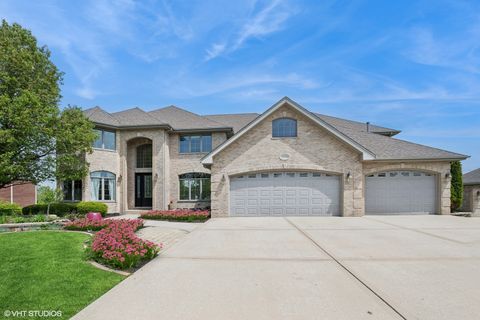
$849,900
5
bds
|
4
ba
|
4,000
sqft
|
built
2006
20350 Port Washington Ct, Frankfort, IL 60423
$-1,629
Cash flow
-10.0%
Cash-on-Cash Return
3.4%
Cap rate
0.7%
Rent to Value Ratio