Bibb County Investment Properties for Sale
Browse homes for sale and investment properties in Bibb County. Refine your search by price, property type, or more.
Best cash flowing properties in Bibb County
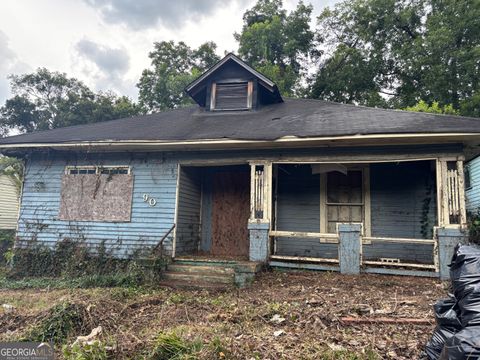
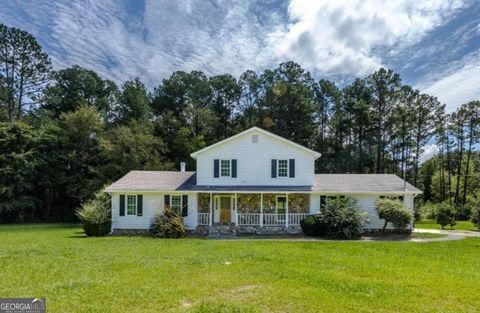
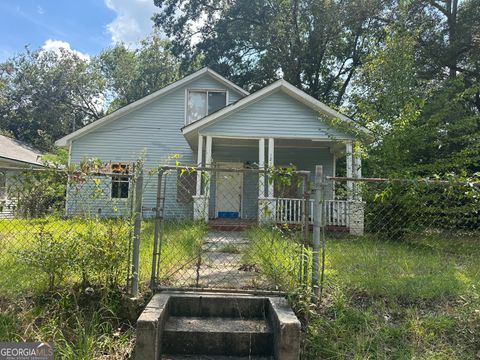
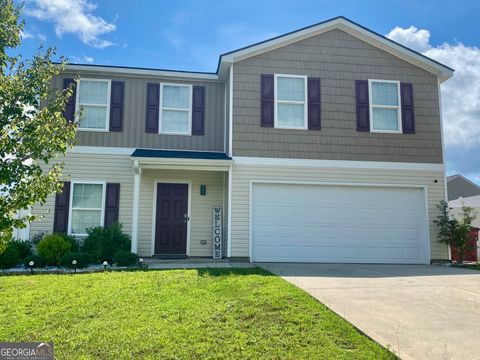
Active
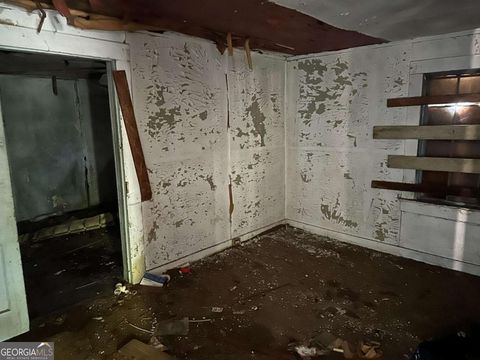
$25,000
3
bds
|
1
ba
|
1,761
sqft
|
built
1912
290 Spikes St, Macon, GA 31206
$951
Cash flow
44.3%
Cash-on-Cash Return
45.6%
Cap rate
5.6%
Rent to Value Ratio
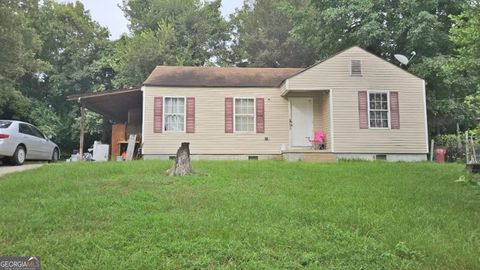
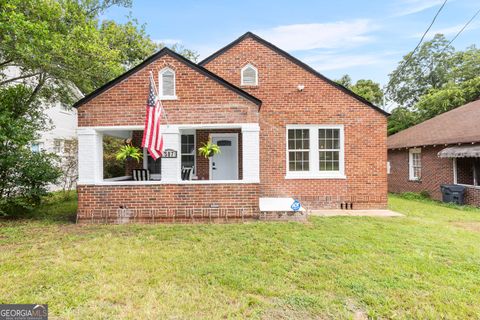
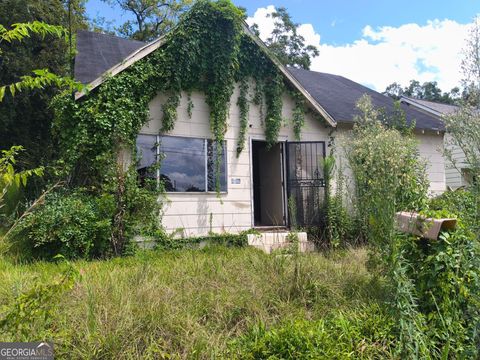
Active
$74,900
4
bds
|
2
ba
|
1,300
sqft
|
built
1946
993 Perdue St, Macon, GA 31206
$853
Cash flow
13.3%
Cash-on-Cash Return
13.7%
Cap rate
1.7%
Rent to Value Ratio
420 out of 447 properties for sale in Bibb County
Limited Results Shown
Create a free account, or log in to reveal all property listings and enjoy the complete experience.

Active
$224,900
3
bds
|
2
ba
|
1,541
sqft
|
built
1983
933 Chisholm Trl, Macon, GA 31220
$-233
Cash flow
-5.4%
Cash-on-Cash Return
4.9%
Cap rate
0.7%
Rent to Value Ratio
Active
$179,900
3
bds
|
2
ba
|
1,232
sqft
|
built
1988
2268 Unaliyi Trl, Macon, GA 31220
$74
Cash flow
2.1%
Cash-on-Cash Return
6.6%
Cap rate
0.9%
Rent to Value Ratio
Active
$79,000
2
bds
|
1
ba
|
852
sqft
|
built
1953
3759 Travis Blvd, Macon, GA 31206
$231
Cash flow
15.3%
Cash-on-Cash Return
9.7%
Cap rate
1.3%
Rent to Value Ratio
Active
$329,000
4
bds
|
3
ba
|
2,240
sqft
|
built
1984
1220 Beaver Oaks Dr, Macon, GA 31220
$-502
Cash flow
-8.0%
Cash-on-Cash Return
4.3%
Cap rate
0.6%
Rent to Value Ratio
Active
$160,000
3
bds
|
2
ba
|
1,466
sqft
|
built
1935
587 Robert Henry St, Macon, GA 31206
$56
Cash flow
1.8%
Cash-on-Cash Return
6.6%
Cap rate
0.8%
Rent to Value Ratio
Active
$139,000
3
bds
|
2
ba
|
1,205
sqft
|
built
1988
981 Santa Fe Trl, Macon, GA 31220
$222
Cash flow
8.3%
Cash-on-Cash Return
8.1%
Cap rate
1.2%
Rent to Value Ratio
Active
$110,000
3
bds
|
2
ba
|
1,203
sqft
|
built
1958
3402 Glynn Ave, Macon, GA 31204
$146
Cash flow
6.9%
Cash-on-Cash Return
7.7%
Cap rate
1.0%
Rent to Value Ratio
Active
$275,000
4
bds
|
2.5
ba
|
2,086
sqft
|
built
1988
149 Hudson Way, Macon, GA 31216
$-204
Cash flow
-3.9%
Cash-on-Cash Return
5.3%
Cap rate
0.7%
Rent to Value Ratio
Active
$550,000
5
bds
|
5.5
ba
|
3,747
sqft
|
built
2002
182 Audubon Pl, Macon, GA 31210
$-1,328
Cash flow
-12.6%
Cash-on-Cash Return
3.2%
Cap rate
0.5%
Rent to Value Ratio
Active
$245,000
4
bds
|
2.5
ba
|
2,040
sqft
|
built
2021
466 Kildare Way, Macon, GA 31216
$-99
Cash flow
-2.1%
Cash-on-Cash Return
5.7%
Cap rate
0.8%
Rent to Value Ratio
Active
$850,000
4
bds
|
3.5
ba
|
3,584
sqft
|
built
1977
973 Fieldstone Dr, Macon, GA 31210
$-2,739
Cash flow
-16.8%
Cash-on-Cash Return
2.3%
Cap rate
0.3%
Rent to Value Ratio
Active
$18,900
3
bds
|
1
ba
|
1,312
sqft
|
built
1920
4360 Mumford Rd, Macon, GA 31204
$818
Cash flow
50.4%
Cash-on-Cash Return
51.9%
Cap rate
6.9%
Rent to Value Ratio

Active
$225,000
8
bds
|
4
ba
|
3,531
sqft
|
built
1950
3771 Vineville Ave, Macon, GA 31204
$-148
Cash flow
-3.4%
Cash-on-Cash Return
5.4%
Cap rate
0.8%
Rent to Value Ratio
Active
$225,000
4
bds
|
2.5
ba
|
1,976
sqft
|
built
2006
621 Ivy Brook Way, Macon, GA 31210
$-62
Cash flow
-1.4%
Cash-on-Cash Return
5.8%
Cap rate
0.9%
Rent to Value Ratio
Active
$55,000
2
bds
|
1
ba
|
0
sqft
|
built
1950
1508 Wellworth Ave, Macon, GA 31204
$712
Cash flow
15.1%
Cash-on-Cash Return
15.5%
Cap rate
2.0%
Rent to Value Ratio
Active
$150,000
3
bds
|
2
ba
|
1,408
sqft
|
built
1924
863 Richmond St, Macon, GA 31206
$2
Cash flow
0.1%
Cash-on-Cash Return
6.2%
Cap rate
0.8%
Rent to Value Ratio
Active
$165,000
3
bds
|
2
ba
|
1,999
sqft
|
built
1942
250 Crumps Park Ave, Macon, GA 31204
$177
Cash flow
5.6%
Cash-on-Cash Return
7.4%
Cap rate
1.0%
Rent to Value Ratio
Active
$95,000
2
bds
|
1
ba
|
1,305
sqft
|
built
1950
2724 Herbert Smart Airport Rd, Macon, GA 31217
$413
Cash flow
22.7%
Cash-on-Cash Return
11.4%
Cap rate
1.5%
Rent to Value Ratio
Active
$230,000
3
bds
|
2
ba
|
1,536
sqft
|
built
1952
2749 Northwoods Dr S, Macon, GA 31204
$-111
Cash flow
-2.5%
Cash-on-Cash Return
5.6%
Cap rate
0.7%
Rent to Value Ratio
Active
$42,000
1
bds
|
1
ba
|
704
sqft
|
built
1910
917 Fort Hill St, Macon, GA 31217
$539
Cash flow
15.0%
Cash-on-Cash Return
15.4%
Cap rate
1.9%
Rent to Value Ratio
Active
$249,990
3
bds
|
2
ba
|
1,454
sqft
|
built
2022
7241 Winterberry Cir, Macon, GA 31216
$-334
Cash flow
-7.0%
Cash-on-Cash Return
4.5%
Cap rate
0.7%
Rent to Value Ratio
Active
$255,000
2
bds
|
2
ba
|
1,542
sqft
|
built
1950
2428 Darden Dr, Macon, GA 31204
$-308
Cash flow
-6.3%
Cash-on-Cash Return
4.7%
Cap rate
0.6%
Rent to Value Ratio
Active
$55,000
3
bds
|
1
ba
|
1,440
sqft
|
built
1928
1216 Buena Vista Ave, Macon, GA 31206
$850
Cash flow
18.0%
Cash-on-Cash Return
18.5%
Cap rate
2.4%
Rent to Value Ratio
Active
$58,900
3
bds
|
1
ba
|
1,168
sqft
|
built
1914
3821 Melrose St, Macon, GA 31204
$736
Cash flow
14.6%
Cash-on-Cash Return
15.0%
Cap rate
1.9%
Rent to Value Ratio
Active
$685,000
3
bds
|
2
ba
|
3,903
sqft
|
built
1921
324 Buford Pl, Macon, GA 31204
$-1,607
Cash flow
-12.2%
Cash-on-Cash Return
3.3%
Cap rate
0.5%
Rent to Value Ratio
Active
$50,000
3
bds
|
1
ba
|
1,104
sqft
|
built
1942
1334 Dewey St, Macon, GA 31206
$724
Cash flow
16.9%
Cash-on-Cash Return
17.4%
Cap rate
2.2%
Rent to Value Ratio
Active
$629,900
5
bds
|
4.5
ba
|
5,052
sqft
|
built
1974
1177 Lucky Debonair Dr, Macon, GA 31210
$-1,605
Cash flow
-13.3%
Cash-on-Cash Return
3.1%
Cap rate
0.4%
Rent to Value Ratio
Active
$145,000
3
bds
|
3
ba
|
1,314
sqft
|
built
1973
648 Willow Creek Dr, Macon, GA 31204
$43
Cash flow
1.5%
Cash-on-Cash Return
6.5%
Cap rate
0.9%
Rent to Value Ratio
Active
$499,900
4
bds
|
3.5
ba
|
3,020
sqft
|
built
2000
104 Palmer Dr, Macon, GA 31210
$-754
Cash flow
-7.9%
Cash-on-Cash Return
4.3%
Cap rate
0.6%
Rent to Value Ratio
Active
$45,000
2
bds
|
1
ba
|
672
sqft
|
built
1955
1960 Kitchens Rd, Macon, GA 31211
$668
Cash flow
17.3%
Cash-on-Cash Return
17.8%
Cap rate
2.2%
Rent to Value Ratio
Active
$245,000
4
bds
|
2.5
ba
|
2,040
sqft
|
built
2020
155 Kinsale Dr, Macon, GA 31216
$-250
Cash flow
-5.3%
Cash-on-Cash Return
4.9%
Cap rate
0.7%
Rent to Value Ratio
Active
$224,900
5
bds
|
3
ba
|
1,648
sqft
|
built
1974
1156 Ahwenasa Trl, Macon, GA 31220
$-99
Cash flow
-2.3%
Cash-on-Cash Return
5.6%
Cap rate
0.8%
Rent to Value Ratio
Active
$65,000
3
bds
|
1
ba
|
1,200
sqft
|
built
1951
3860 Lindwood Dr, Macon, GA 31206
$833
Cash flow
14.9%
Cash-on-Cash Return
15.4%
Cap rate
2.0%
Rent to Value Ratio
Active
$139,900
3
bds
|
2
ba
|
1,512
sqft
|
built
2003
153 Alview Dr, Macon, GA 31206
$184
Cash flow
6.9%
Cash-on-Cash Return
7.7%
Cap rate
1.0%
Rent to Value Ratio
Active
$344,000
3
bds
|
2.5
ba
|
2,870
sqft
|
built
1995
355 Old Oak Rd, Macon, GA 31216
$-641
Cash flow
-9.7%
Cash-on-Cash Return
3.9%
Cap rate
0.6%
Rent to Value Ratio
Active
$95,000
3
bds
|
1
ba
|
851
sqft
|
built
1956
3446 Tamplin Ter, Macon, GA 31206
$158
Cash flow
8.7%
Cash-on-Cash Return
8.1%
Cap rate
1.1%
Rent to Value Ratio
Active
$225,000
3
bds
|
2
ba
|
0
sqft
|
built
1909
2676 Cherokee Ave, Macon, GA 31204
$-311
Cash flow
-7.2%
Cash-on-Cash Return
4.5%
Cap rate
0.6%
Rent to Value Ratio
Active
$375,000
4
bds
|
4
ba
|
2,918
sqft
|
built
1982
311 Castlegate Rd, Macon, GA 31210
$-622
Cash flow
-8.7%
Cash-on-Cash Return
4.2%
Cap rate
0.6%
Rent to Value Ratio