Fulton County Investment Properties for Sale
Browse homes for sale and investment properties in Fulton County. Refine your search by price, property type, or more.
Best cash flowing properties in Fulton County
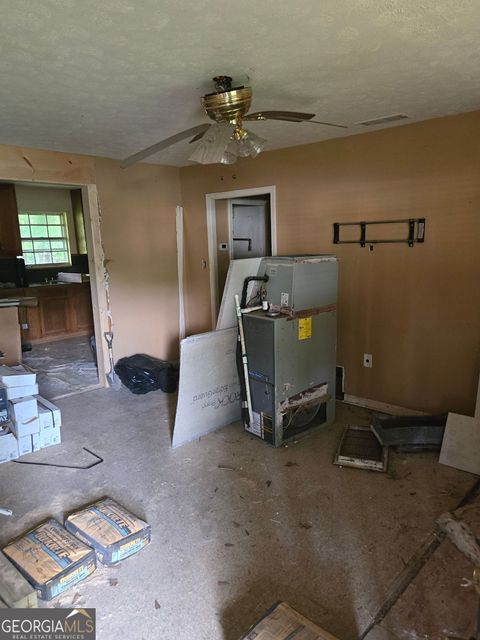
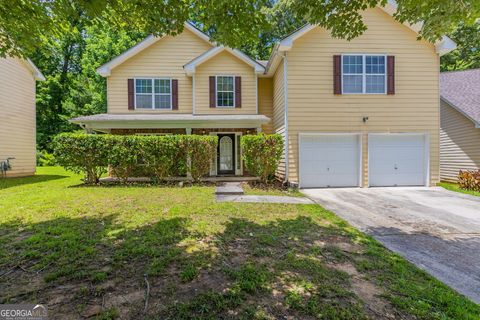
Active
$150,000
3
bds
|
0
ba
|
0
sqft
|
built
1974
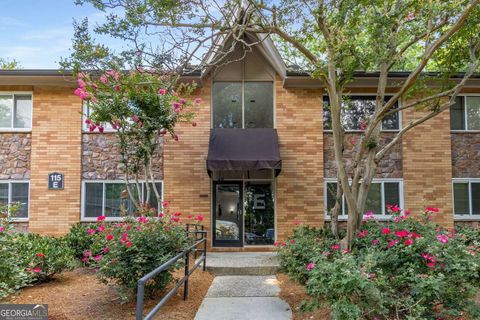
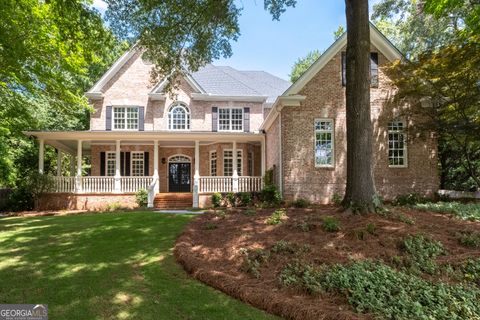
715 Plainville Dr SW, Atlanta, GA 30331
$136
Cash flow
4.7%
Cash-on-Cash Return
7.4%
Cap rate
1.1%
Rent to Value Ratio
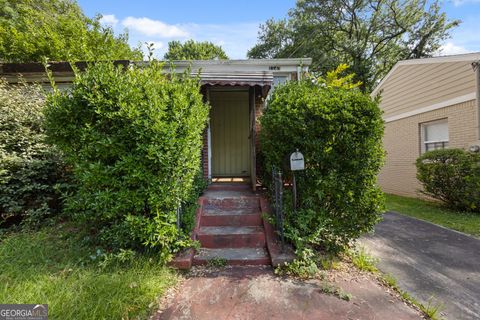
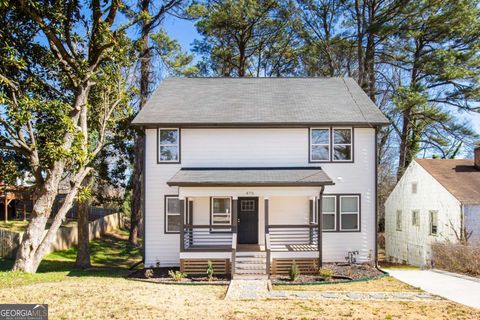
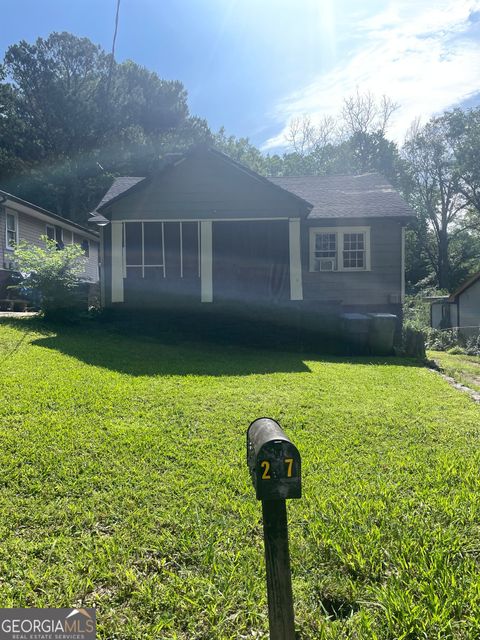
Active
$166,000
2
bds
|
0
ba
|
1,051
sqft
|
built
1945
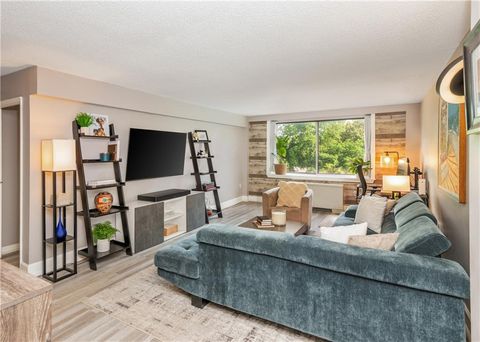
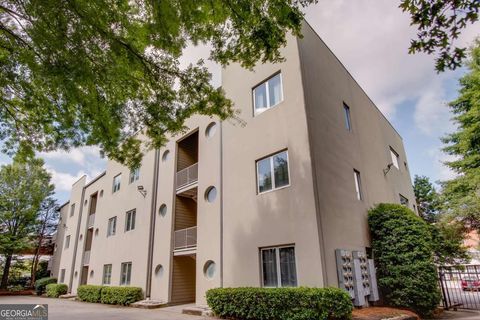
1143 Westview Dr SW, Atlanta, GA 30310
$-63
Cash flow
-2.0%
Cash-on-Cash Return
5.8%
Cap rate
1.0%
Rent to Value Ratio
4,641 out of 5,611 properties for sale in Fulton County
Limited Results Shown
Create a free account, or log in to reveal all property listings and enjoy the complete experience.
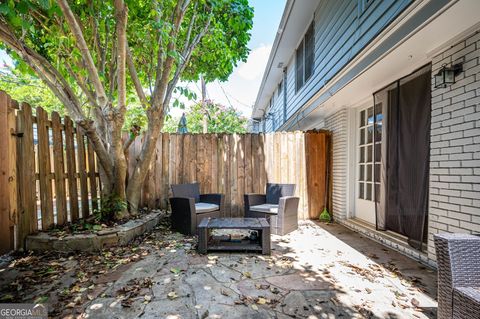
Active
$324,900
2
bds
|
0
ba
|
1,108
sqft
|
built
1975
136 Peachtree Memorial Dr NW, Atlanta, GA 30309
$-632
Cash flow
-10.1%
Cash-on-Cash Return
3.9%
Cap rate
0.8%
Rent to Value Ratio
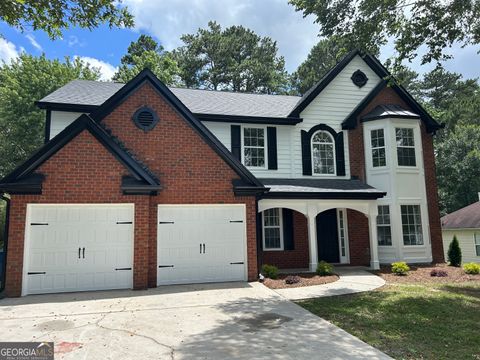
Active
$383,777
4
bds
|
0
ba
|
2,662
sqft
|
built
2000
160 Magnolia Walk Ln, Atlanta, GA 30349
$-1,005
Cash flow
-13.7%
Cash-on-Cash Return
3.1%
Cap rate
0.6%
Rent to Value Ratio

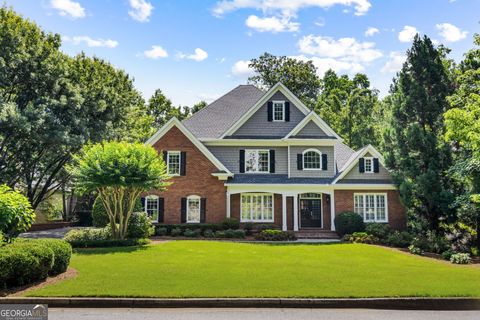
Active
$515,000
3
bds
|
0
ba
|
2,740
sqft
|
built
2018
1954 Summit Trce NW, Atlanta, GA 30318
$-1,076
Cash flow
-10.9%
Cash-on-Cash Return
3.8%
Cap rate
0.7%
Rent to Value Ratio

Active
$565,000
2
bds
|
0
ba
|
1,450
sqft
|
built
1920
1026 Saint Charles Ave NE, Atlanta, GA 30306
$-1,384
Cash flow
-12.8%
Cash-on-Cash Return
3.3%
Cap rate
0.6%
Rent to Value Ratio
Active
$285,000
3
bds
|
0
ba
|
1,300
sqft
|
built
1964
115 Biscayne Dr NW, Atlanta, GA 30309
$-987
Cash flow
-18.1%
Cash-on-Cash Return
2.1%
Cap rate
0.8%
Rent to Value Ratio
Active
$180,000
1
bds
|
1
ba
|
837
sqft
|
built
1967
2479 Peachtree Rd NE, Atlanta, GA 30305
$-772
Cash flow
-22.4%
Cash-on-Cash Return
1.1%
Cap rate
1.0%
Rent to Value Ratio
Active
$329,000
3
bds
|
0
ba
|
1,183
sqft
|
built
1947
345 Adelle St SE, Atlanta, GA 30315
$-403
Cash flow
-6.4%
Cash-on-Cash Return
4.8%
Cap rate
0.8%
Rent to Value Ratio
Active
$750,000
4
bds
|
0
ba
|
2,536
sqft
|
built
1997
740 Orchard Ct, Sandy Springs, GA 30328
$-1,665
Cash flow
-11.6%
Cash-on-Cash Return
3.6%
Cap rate
0.5%
Rent to Value Ratio
Active
$1,425,000
6
bds
|
0
ba
|
5,526
sqft
|
built
2001
125 Franklin Pl, Sandy Springs, GA 30342
$-4,189
Cash flow
-15.3%
Cash-on-Cash Return
2.7%
Cap rate
0.5%
Rent to Value Ratio
Active
$475,000
4
bds
|
0
ba
|
3,254
sqft
|
built
2018
870 Gaston St SW, Atlanta, GA 30310
$-1,431
Cash flow
-15.7%
Cash-on-Cash Return
2.5%
Cap rate
0.5%
Rent to Value Ratio
Active
$324,900
3
bds
|
0
ba
|
1,228
sqft
|
built
1964
1400 North Ave NW, Atlanta, GA 30318
$-403
Cash flow
-6.5%
Cash-on-Cash Return
4.8%
Cap rate
0.6%
Rent to Value Ratio

Active
$345,000
2
bds
|
0
ba
|
1,030
sqft
|
built
2004
2255 Peachtree Rd NE, Atlanta, GA 30309
$-1,299
Cash flow
-19.6%
Cash-on-Cash Return
1.7%
Cap rate
0.7%
Rent to Value Ratio

Active
$599,999
3
bds
|
2
ba
|
2,200
sqft
|
built
1916
1232 Lucile Ave SW, Atlanta, GA 30310
$-1,765
Cash flow
-15.3%
Cash-on-Cash Return
2.7%
Cap rate
0.5%
Rent to Value Ratio
Active
$475,000
5
bds
|
0
ba
|
3,833
sqft
|
built
1969
3332 Saint John Dr, East Point, GA 30344
$-1,021
Cash flow
-11.2%
Cash-on-Cash Return
3.6%
Cap rate
0.5%
Rent to Value Ratio

Active
$259,900
2
bds
|
0
ba
|
1,224
sqft
|
built
1980
24317 Plantation Dr NE, Atlanta, GA 30324
$-958
Cash flow
-19.2%
Cash-on-Cash Return
1.7%
Cap rate
0.8%
Rent to Value Ratio
Active
$1,700,000
7
bds
|
5
ba
|
6,708
sqft
|
built
1972
8316 Hewlett Rd, Sandy Springs, GA 30350
$-3,544
Cash flow
-10.9%
Cash-on-Cash Return
3.6%
Cap rate
0.5%
Rent to Value Ratio
Active
$299,500
2
bds
|
0
ba
|
1,200
sqft
|
built
1968
37 La Rue Pl NW, Atlanta, GA 30327
$-903
Cash flow
-15.7%
Cash-on-Cash Return
2.6%
Cap rate
0.8%
Rent to Value Ratio

Active
$210,000
3
bds
|
0
ba
|
1,008
sqft
|
built
1960
1079 Stonewall Dr SE, Atlanta, GA 30315
$-190
Cash flow
-4.7%
Cash-on-Cash Return
5.2%
Cap rate
0.8%
Rent to Value Ratio
Active
$1,800,000
3
bds
|
3
ba
|
0
sqft
|
built
1974
650 Moores Mill Rd NW, Atlanta, GA 30327
$-7,776
Cash flow
-22.5%
Cash-on-Cash Return
1.1%
Cap rate
0.3%
Rent to Value Ratio
Active
$264,900
1
bds
|
0
ba
|
1,134
sqft
|
built
2006
1195 Milton Ter SE, Atlanta, GA 30315
$-537
Cash flow
-10.6%
Cash-on-Cash Return
3.8%
Cap rate
0.7%
Rent to Value Ratio
Active
$360,000
4
bds
|
0
ba
|
2,672
sqft
|
built
2006
260 Redding Rdg, Atlanta, GA 30349
$-906
Cash flow
-13.1%
Cash-on-Cash Return
3.2%
Cap rate
0.6%
Rent to Value Ratio
Active
$160,000
2
bds
|
0
ba
|
1,118
sqft
|
built
1952
297 Anderson Ave NW, Atlanta, GA 30314
$-4,622
Cash flow
-150.7%
Cash-on-Cash Return
-28.4%
Cap rate
1.3%
Rent to Value Ratio
Active
$724,900
2
bds
|
2
ba
|
1,116
sqft
|
built
1940
796 Piedmont Way NE, Atlanta, GA 30324
$-1,992
Cash flow
-14.3%
Cash-on-Cash Return
3.0%
Cap rate
0.5%
Rent to Value Ratio

Active
$255,000
3
bds
|
0
ba
|
1,852
sqft
|
built
2017
6945 Merrywood Dr, Fairburn, GA 30213
$-219
Cash flow
-4.5%
Cash-on-Cash Return
5.1%
Cap rate
0.7%
Rent to Value Ratio

Active
$1,095,000
2
bds
|
0
ba
|
2,403
sqft
|
built
1987
2660 Peachtree Rd NW, Atlanta, GA 30305
$-4,598
Cash flow
-21.9%
Cash-on-Cash Return
1.1%
Cap rate
0.5%
Rent to Value Ratio
Active
$255,000
3
bds
|
0
ba
|
1,189
sqft
|
built
1940
3198 Oakdale Rd, Atlanta, GA 30354
$-152
Cash flow
-3.1%
Cash-on-Cash Return
5.4%
Cap rate
0.8%
Rent to Value Ratio
Active
$945,000
3
bds
|
0
ba
|
2,932
sqft
|
built
1985
80 Stratford Pl NE, Atlanta, GA 30342
$-2,019
Cash flow
-11.1%
Cash-on-Cash Return
3.7%
Cap rate
0.7%
Rent to Value Ratio
Active
$195,000
3
bds
|
0
ba
|
860
sqft
|
built
1962
4610 Wilson James Rd SW, Atlanta, GA 30331
$-323
Cash flow
-8.6%
Cash-on-Cash Return
4.3%
Cap rate
0.7%
Rent to Value Ratio
Active
$227,000
1
bds
|
0
ba
|
813
sqft
|
built
1989
1280 W Peachtree St NW, Atlanta, GA 30309
$-285
Cash flow
-6.6%
Cash-on-Cash Return
4.8%
Cap rate
0.8%
Rent to Value Ratio

Active
$1,299,000
3
bds
|
5
ba
|
0
sqft
|
built
2018
6399 Lucent Ln, Atlanta, GA 30328
$-5,235
Cash flow
-21.0%
Cash-on-Cash Return
1.4%
Cap rate
0.3%
Rent to Value Ratio
Active
$150,000
3
bds
|
0
ba
|
0
sqft
|
built
1974
715 Plainville Dr SW, Atlanta, GA 30331
$136
Cash flow
4.7%
Cash-on-Cash Return
7.4%
Cap rate
1.1%
Rent to Value Ratio
Active
$300,000
3
bds
|
0
ba
|
1,200
sqft
|
built
1920
2148 Martin Luther King Jr Dr SW, Atlanta, GA 30310
$-805
Cash flow
-14.0%
Cash-on-Cash Return
3.0%
Cap rate
0.5%
Rent to Value Ratio

Active
$485,000
3
bds
|
0
ba
|
0
sqft
|
built
1996
13440 Avensong Xing, Alpharetta, GA 30004
$-964
Cash flow
-10.4%
Cash-on-Cash Return
3.9%
Cap rate
0.5%
Rent to Value Ratio
Active
$1,475,000
5
bds
|
0
ba
|
5,723
sqft
|
built
1998
1650 Harvest Ln, Alpharetta, GA 30004
$-3,232
Cash flow
-11.4%
Cash-on-Cash Return
3.6%
Cap rate
0.5%
Rent to Value Ratio
Active
$415,000
1
bds
|
0
ba
|
1,032
sqft
|
built
2001
15 Waddell St NE, Atlanta, GA 30307
$-1,056
Cash flow
-13.3%
Cash-on-Cash Return
3.2%
Cap rate
0.6%
Rent to Value Ratio
Active
$859,000
5
bds
|
0
ba
|
4,545
sqft
|
built
1995
1620 Silverleaf Way, Alpharetta, GA 30005
$-1,834
Cash flow
-11.1%
Cash-on-Cash Return
3.6%
Cap rate
0.5%
Rent to Value Ratio
Active
$459,000
2
bds
|
0
ba
|
1,223
sqft
|
built
2005
3324 Peachtree Rd NE, Atlanta, GA 30326
$-442
Cash flow
-5.0%
Cash-on-Cash Return
5.0%
Cap rate
0.8%
Rent to Value Ratio
Active
$166,000
2
bds
|
0
ba
|
1,051
sqft
|
built
1945
1143 Westview Dr SW, Atlanta, GA 30310
$-63
Cash flow
-2.0%
Cash-on-Cash Return
5.8%
Cap rate
1.0%
Rent to Value Ratio

Active
$2,295,000
6
bds
|
8
ba
|
7,269
sqft
|
built
2012
821 Camden Park Ct NE, Atlanta, GA 30342
$-10,244
Cash flow
-23.3%
Cash-on-Cash Return
0.8%
Cap rate
0.3%
Rent to Value Ratio

Active
$350,000
3
bds
|
0
ba
|
1,364
sqft
|
built
1936
1104 Victory Dr SW, Atlanta, GA 30310
$-362
Cash flow
-5.4%
Cash-on-Cash Return
4.9%
Cap rate
0.7%
Rent to Value Ratio