Fulton County Investment Properties for Sale
Browse homes for sale and investment properties in Fulton County. Refine your search by price, property type, or more.
Best cash flowing properties in Fulton County

Active
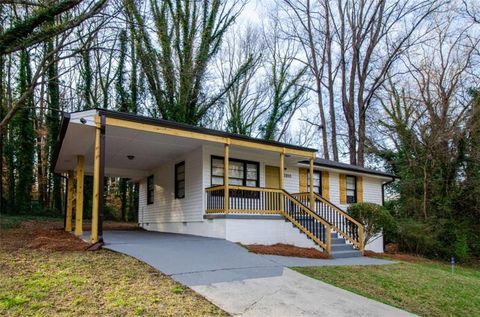
$125,000
3
bds
|
0
ba
|
1,466
sqft
|
built
1990
2511 Pine Tree Trl, Atlanta, GA 30349
$345
Cash flow
14.4%
Cash-on-Cash Return
9.5%
Cap rate
1.3%
Rent to Value Ratio
Active
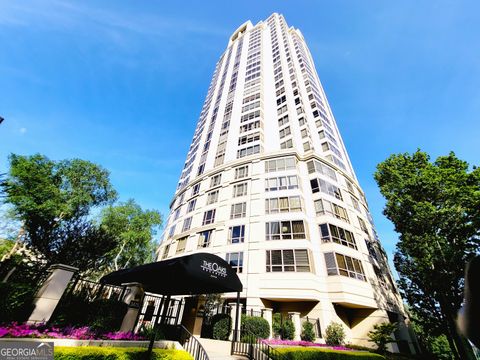
$159,900
1
bds
|
0
ba
|
0
sqft
|
built
1965
620 Peachtree St NE, Atlanta, GA 30308
$224
Cash flow
7.3%
Cash-on-Cash Return
7.9%
Cap rate
1.1%
Rent to Value Ratio
4,641 out of 5,611 properties for sale in Fulton County
Limited Results Shown
Create a free account, or log in to reveal all property listings and enjoy the complete experience.
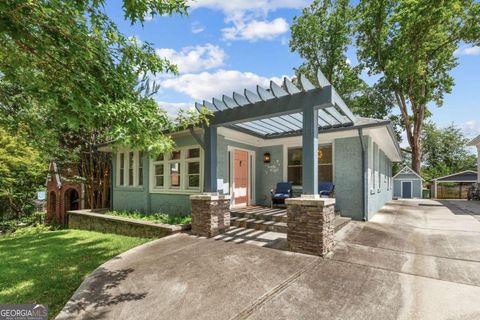
Active
$265,000
2
bds
|
0
ba
|
1,225
sqft
|
built
1978
603 Brighton Pt, Sandy Springs, GA 30328
$-471
Cash flow
-9.3%
Cash-on-Cash Return
4.1%
Cap rate
0.8%
Rent to Value Ratio

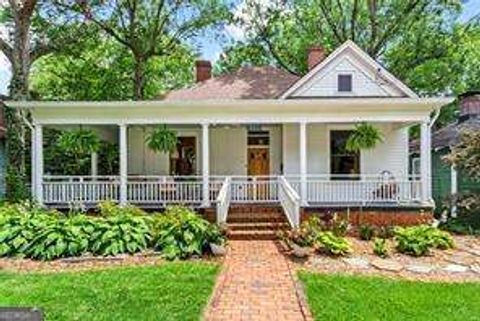
Active
$525,000
2
bds
|
0
ba
|
1,216
sqft
|
built
1930
1148 Hardee St NE, Atlanta, GA 30307
$-1,335
Cash flow
-13.3%
Cash-on-Cash Return
3.2%
Cap rate
0.5%
Rent to Value Ratio
Active
$950,000
3
bds
|
0
ba
|
0
sqft
|
built
1940
3072 Dale Dr NE, Atlanta, GA 30305
$-2,103
Cash flow
-11.5%
Cash-on-Cash Return
3.6%
Cap rate
0.6%
Rent to Value Ratio

Active
$199,000
3
bds
|
0
ba
|
1,075
sqft
|
built
1976
4020 Ester Dr SW, Atlanta, GA 30331
$59
Cash flow
1.5%
Cash-on-Cash Return
6.6%
Cap rate
0.8%
Rent to Value Ratio
Active
$319,900
4
bds
|
0
ba
|
1,690
sqft
|
built
1952
644 Albert St NW, Atlanta, GA 30318
$-399
Cash flow
-6.5%
Cash-on-Cash Return
4.8%
Cap rate
0.8%
Rent to Value Ratio
Active
$469,999
3
bds
|
0
ba
|
0
sqft
|
built
1996
2680 Pine Tree Rd NE, Atlanta, GA 30324
$-1,526
Cash flow
-16.9%
Cash-on-Cash Return
2.4%
Cap rate
0.6%
Rent to Value Ratio
Active
$1,850,000
5
bds
|
4
ba
|
0
sqft
|
built
1959
4095 N Broadland Rd NW, Atlanta, GA 30342
$-5,765
Cash flow
-16.3%
Cash-on-Cash Return
2.5%
Cap rate
0.5%
Rent to Value Ratio
Active
$324,999
3
bds
|
2
ba
|
0
sqft
|
built
1949
1914 North Ave NW, Atlanta, GA 30318
$-601
Cash flow
-9.6%
Cash-on-Cash Return
4.0%
Cap rate
0.6%
Rent to Value Ratio
Active
$360,000
2
bds
|
0
ba
|
0
sqft
|
built
1997
1024 Whitshire Way, Alpharetta, GA 30004
$-847
Cash flow
-12.3%
Cash-on-Cash Return
3.4%
Cap rate
0.6%
Rent to Value Ratio

Active
$549,900
4
bds
|
0
ba
|
1,810
sqft
|
built
1994
1805 Millstone Ct, Alpharetta, GA 30004
$-1,229
Cash flow
-11.7%
Cash-on-Cash Return
3.6%
Cap rate
0.5%
Rent to Value Ratio
Active
$633,000
2
bds
|
0
ba
|
2,042
sqft
|
built
1992
3475 Oak Valley Rd NE, Atlanta, GA 30326
$-2,168
Cash flow
-17.9%
Cash-on-Cash Return
2.2%
Cap rate
0.6%
Rent to Value Ratio

Active
$400,000
3
bds
|
0
ba
|
2,744
sqft
|
built
1920
1053 Metropolitan Pkwy SW, Atlanta, GA 30310
$-1,515
Cash flow
-19.8%
Cash-on-Cash Return
1.7%
Cap rate
0.4%
Rent to Value Ratio

Active
$400,000
2
bds
|
0
ba
|
1,318
sqft
|
built
1927
320 Martin Luther King Jr Dr SE, Atlanta, GA 30312
$-936
Cash flow
-12.2%
Cash-on-Cash Return
3.5%
Cap rate
0.7%
Rent to Value Ratio
Active
$228,000
3
bds
|
1
ba
|
912
sqft
|
built
1958
2895 Akron St, Atlanta, GA 30344
$-71
Cash flow
-1.6%
Cash-on-Cash Return
5.8%
Cap rate
0.8%
Rent to Value Ratio

Active
$242,500
3
bds
|
0
ba
|
1,066
sqft
|
built
1996
114 Howell Dr SW, Atlanta, GA 30331
$-417
Cash flow
-9.0%
Cash-on-Cash Return
4.1%
Cap rate
0.7%
Rent to Value Ratio

Active
$285,000
4
bds
|
0
ba
|
1,340
sqft
|
built
1960
2334 Leila Ln SE, Atlanta, GA 30315
$-143
Cash flow
-2.6%
Cash-on-Cash Return
5.5%
Cap rate
0.7%
Rent to Value Ratio
Active
$775,000
2
bds
|
0
ba
|
2,050
sqft
|
built
1930
28 Peachtree Hills Ave NE, Atlanta, GA 30305
$-1,642
Cash flow
-11.1%
Cash-on-Cash Return
3.6%
Cap rate
0.6%
Rent to Value Ratio

Active
$575,000
2
bds
|
3
ba
|
1,709
sqft
|
built
2010
1820 Peachtree St NW, Atlanta, GA 30309
$-1,782
Cash flow
-16.2%
Cash-on-Cash Return
2.4%
Cap rate
0.8%
Rent to Value Ratio
Active
$765,000
2
bds
|
0
ba
|
2,030
sqft
|
built
1909
261 Ormond St SE, Atlanta, GA 30315
$-2,112
Cash flow
-14.4%
Cash-on-Cash Return
3.0%
Cap rate
0.5%
Rent to Value Ratio

Active
$499,000
4
bds
|
0
ba
|
0
sqft
|
built
2020
629 Windsor St SW, Atlanta, GA 30312
$-1,462
Cash flow
-15.3%
Cash-on-Cash Return
2.7%
Cap rate
0.5%
Rent to Value Ratio
Active
$159,900
1
bds
|
0
ba
|
0
sqft
|
built
1965
620 Peachtree St NE, Atlanta, GA 30308
$224
Cash flow
7.3%
Cash-on-Cash Return
7.9%
Cap rate
1.1%
Rent to Value Ratio
Active
$421,000
3
bds
|
3
ba
|
0
sqft
|
built
1987
5030 N Bridges Dr, Alpharetta, GA 30022
$-702
Cash flow
-8.7%
Cash-on-Cash Return
4.3%
Cap rate
0.6%
Rent to Value Ratio
Active
$565,000
5
bds
|
0
ba
|
0
sqft
|
built
2013
5896 Cliftondale Dr, Atlanta, GA 30349
$-1,338
Cash flow
-12.4%
Cash-on-Cash Return
3.4%
Cap rate
0.5%
Rent to Value Ratio

Active
$270,655
4
bds
|
0
ba
|
0
sqft
|
built
1966
6421 Raymond Ter, Union City, GA 30291
$-833
Cash flow
-16.1%
Cash-on-Cash Return
2.5%
Cap rate
0.4%
Rent to Value Ratio

Active
$329,900
2
bds
|
0
ba
|
1,418
sqft
|
built
1995
719 Mc Gill Park Ave NE, Atlanta, GA 30312
$-631
Cash flow
-10.0%
Cash-on-Cash Return
4.0%
Cap rate
0.8%
Rent to Value Ratio
Active
$199,000
4
bds
|
0
ba
|
0
sqft
|
built
1970
732 Neal St NW, Atlanta, GA 30318
$-153
Cash flow
-4.0%
Cash-on-Cash Return
5.3%
Cap rate
0.8%
Rent to Value Ratio

Active
$575,000
3
bds
|
0
ba
|
2,192
sqft
|
built
1986
10980 Pinehigh Dr, Alpharetta, GA 30022
$-1,045
Cash flow
-9.5%
Cash-on-Cash Return
4.1%
Cap rate
0.5%
Rent to Value Ratio

Active
$2,195,000
6
bds
|
0
ba
|
8,439
sqft
|
built
2008
560 Arcaro Dr, Alpharetta, GA 30004
$-8,318
Cash flow
-19.8%
Cash-on-Cash Return
1.7%
Cap rate
0.3%
Rent to Value Ratio
Active
$430,000
4
bds
|
0
ba
|
1,500
sqft
|
built
2001
13495 Spring View Dr, Alpharetta, GA 30004
$-891
Cash flow
-10.8%
Cash-on-Cash Return
3.8%
Cap rate
0.6%
Rent to Value Ratio
Active
$1,450,000
5
bds
|
0
ba
|
4,107
sqft
|
built
1967
6175 Weatherly Dr, Sandy Springs, GA 30328
$-2,252
Cash flow
-8.1%
Cash-on-Cash Return
4.4%
Cap rate
0.6%
Rent to Value Ratio

Active
$368,900
3
bds
|
0
ba
|
1,326
sqft
|
built
2009
1753 Liberty Pkwy NW, Atlanta, GA 30318
$-866
Cash flow
-12.2%
Cash-on-Cash Return
3.4%
Cap rate
0.7%
Rent to Value Ratio
Active
$525,000
4
bds
|
0
ba
|
2,143
sqft
|
built
2022
569 Middle St SW, Atlanta, GA 30310
$-405
Cash flow
-4.0%
Cash-on-Cash Return
5.3%
Cap rate
0.7%
Rent to Value Ratio
Active
$125,000
3
bds
|
0
ba
|
1,466
sqft
|
built
1990
2511 Pine Tree Trl, Atlanta, GA 30349
$345
Cash flow
14.4%
Cash-on-Cash Return
9.5%
Cap rate
1.3%
Rent to Value Ratio

Active
$989,000
3
bds
|
0
ba
|
5,615
sqft
|
built
1981
3030 Spalding Dr, Sandy Springs, GA 30350
$-2,153
Cash flow
-11.4%
Cash-on-Cash Return
3.5%
Cap rate
0.5%
Rent to Value Ratio

Active
$355,000
2
bds
|
0
ba
|
0
sqft
|
built
1955
1452 Mercer Ave, College Park, GA 30337
$-1,038
Cash flow
-15.3%
Cash-on-Cash Return
2.6%
Cap rate
0.5%
Rent to Value Ratio

Active
$400,000
3
bds
|
0
ba
|
1,536
sqft
|
built
1950
1092 Donnelly Ave SW, Atlanta, GA 30310
$-225
Cash flow
-2.9%
Cash-on-Cash Return
5.5%
Cap rate
0.8%
Rent to Value Ratio

Active
$499,900
2
bds
|
0
ba
|
1,270
sqft
|
built
2004
3338 Peachtree Rd NE, Atlanta, GA 30326
$-1,458
Cash flow
-15.2%
Cash-on-Cash Return
2.8%
Cap rate
0.6%
Rent to Value Ratio
Active
$720,000
2
bds
|
0
ba
|
1,664
sqft
|
built
2021
698 Eustace St SE, Atlanta, GA 30315
$-1,843
Cash flow
-13.4%
Cash-on-Cash Return
3.2%
Cap rate
0.6%
Rent to Value Ratio
Active
$314,900
1
bds
|
0
ba
|
0
sqft
|
built
2005
3324 Peachtree Rd NE, Atlanta, GA 30326
$-953
Cash flow
-15.8%
Cash-on-Cash Return
2.6%
Cap rate
0.7%
Rent to Value Ratio
Active
$150,000
2
bds
|
0
ba
|
1,105
sqft
|
built
2006
898 Oak St SW, Atlanta, GA 30310
$36
Cash flow
1.3%
Cash-on-Cash Return
6.6%
Cap rate
1.1%
Rent to Value Ratio