Fulton County Investment Properties for Sale
Browse homes for sale and investment properties in Fulton County. Refine your search by price, property type, or more.
Best cash flowing properties in Fulton County
Active
$263,000
2
bds
|
0
ba
|
975
sqft
|
built
1990
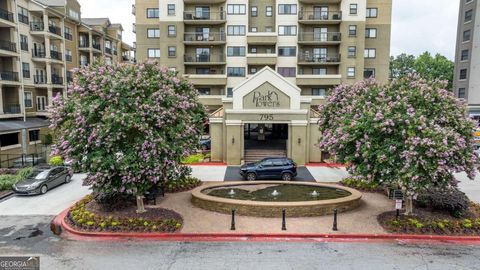
795 Hammond Dr, Atlanta, GA 30328
$214
Cash flow
4.2%
Cash-on-Cash Return
7.2%
Cap rate
0.9%
Rent to Value Ratio
Active
$150,000
3
bds
|
0
ba
|
0
sqft
|
built
1974
715 Plainville Dr SW, Atlanta, GA 30331
$136
Cash flow
4.7%
Cash-on-Cash Return
7.4%
Cap rate
1.1%
Rent to Value Ratio
4,727 out of 5,601 properties for sale in Fulton County
Limited Results Shown
Create a free account, or log in to reveal all property listings and enjoy the complete experience.

Active
$255,000
3
bds
|
0
ba
|
1,852
sqft
|
built
2017
6945 Merrywood Dr, Fairburn, GA 30213
$-219
Cash flow
-4.5%
Cash-on-Cash Return
5.1%
Cap rate
0.7%
Rent to Value Ratio

Active
$1,095,000
2
bds
|
0
ba
|
2,403
sqft
|
built
1987
2660 Peachtree Rd NW, Atlanta, GA 30305
$-4,598
Cash flow
-21.9%
Cash-on-Cash Return
1.1%
Cap rate
0.5%
Rent to Value Ratio
Active
$255,000
3
bds
|
0
ba
|
1,189
sqft
|
built
1940
3198 Oakdale Rd, Atlanta, GA 30354
$-152
Cash flow
-3.1%
Cash-on-Cash Return
5.4%
Cap rate
0.8%
Rent to Value Ratio
Active
$945,000
3
bds
|
0
ba
|
2,932
sqft
|
built
1985
80 Stratford Pl NE, Atlanta, GA 30342
$-2,019
Cash flow
-11.1%
Cash-on-Cash Return
3.7%
Cap rate
0.7%
Rent to Value Ratio
Active
$195,000
3
bds
|
0
ba
|
860
sqft
|
built
1962
4610 Wilson James Rd SW, Atlanta, GA 30331
$-323
Cash flow
-8.6%
Cash-on-Cash Return
4.3%
Cap rate
0.7%
Rent to Value Ratio
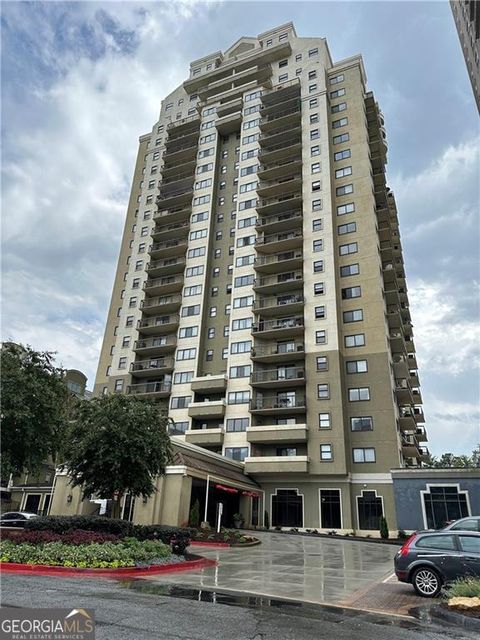
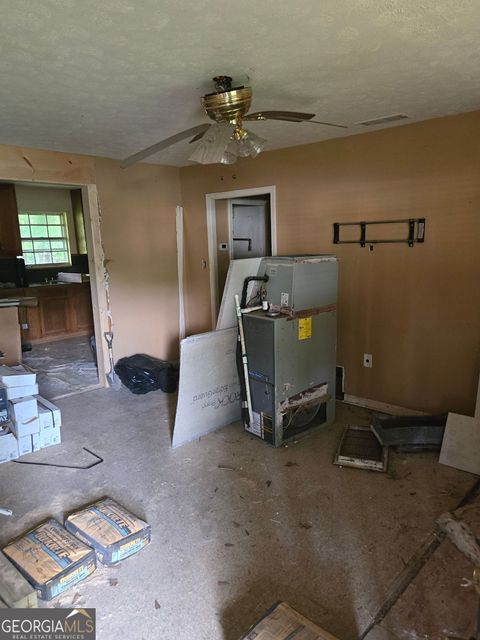
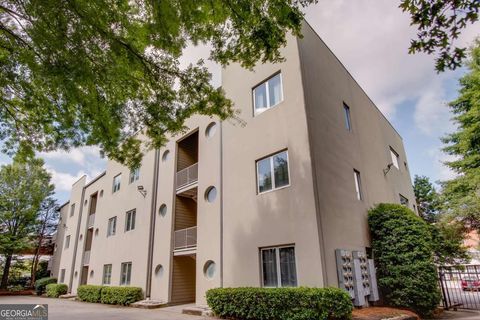
Active
$227,000
1
bds
|
0
ba
|
813
sqft
|
built
1989
1280 W Peachtree St NW, Atlanta, GA 30309
$-285
Cash flow
-6.6%
Cash-on-Cash Return
4.8%
Cap rate
0.8%
Rent to Value Ratio

Active
$1,299,000
3
bds
|
5
ba
|
0
sqft
|
built
2018
6399 Lucent Ln, Atlanta, GA 30328
$-5,235
Cash flow
-21.0%
Cash-on-Cash Return
1.4%
Cap rate
0.3%
Rent to Value Ratio
Active
$150,000
3
bds
|
0
ba
|
0
sqft
|
built
1974
715 Plainville Dr SW, Atlanta, GA 30331
$136
Cash flow
4.7%
Cash-on-Cash Return
7.4%
Cap rate
1.1%
Rent to Value Ratio
Active
$300,000
3
bds
|
0
ba
|
1,200
sqft
|
built
1920
2148 Martin Luther King Jr Dr SW, Atlanta, GA 30310
$-805
Cash flow
-14.0%
Cash-on-Cash Return
3.0%
Cap rate
0.5%
Rent to Value Ratio

Active
$485,000
3
bds
|
0
ba
|
0
sqft
|
built
1996
13440 Avensong Xing, Alpharetta, GA 30004
$-964
Cash flow
-10.4%
Cash-on-Cash Return
3.9%
Cap rate
0.5%
Rent to Value Ratio
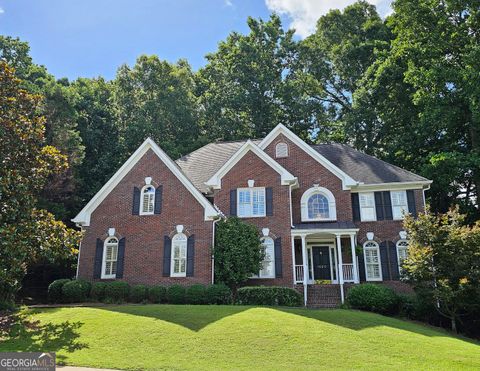
Active
$1,475,000
5
bds
|
0
ba
|
5,723
sqft
|
built
1998
1650 Harvest Ln, Alpharetta, GA 30004
$-3,232
Cash flow
-11.4%
Cash-on-Cash Return
3.6%
Cap rate
0.5%
Rent to Value Ratio
Active
$415,000
1
bds
|
0
ba
|
1,032
sqft
|
built
2001
15 Waddell St NE, Atlanta, GA 30307
$-1,056
Cash flow
-13.3%
Cash-on-Cash Return
3.2%
Cap rate
0.6%
Rent to Value Ratio
Active
$859,000
5
bds
|
0
ba
|
4,545
sqft
|
built
1995
1620 Silverleaf Way, Alpharetta, GA 30005
$-1,834
Cash flow
-11.1%
Cash-on-Cash Return
3.6%
Cap rate
0.5%
Rent to Value Ratio
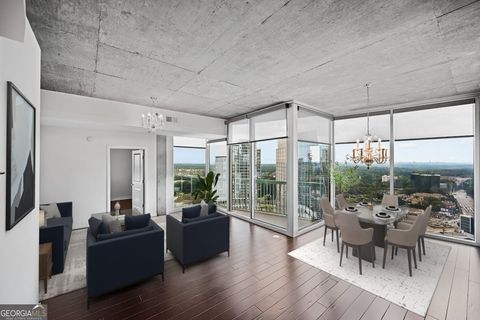
Active
$459,000
2
bds
|
0
ba
|
1,223
sqft
|
built
2005
3324 Peachtree Rd NE, Atlanta, GA 30326
$-442
Cash flow
-5.0%
Cash-on-Cash Return
5.0%
Cap rate
0.8%
Rent to Value Ratio
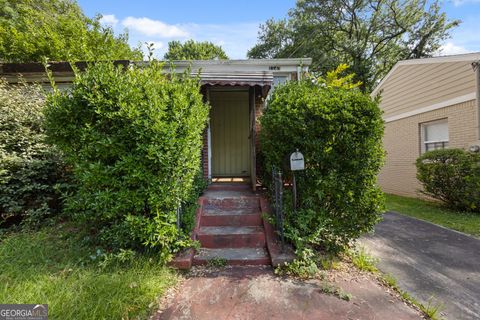
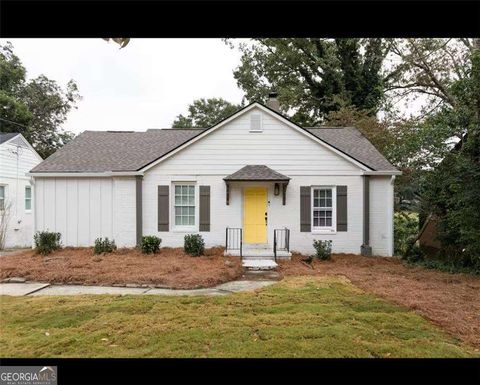
Active
$166,000
2
bds
|
0
ba
|
1,051
sqft
|
built
1945
1143 Westview Dr SW, Atlanta, GA 30310
$-63
Cash flow
-2.0%
Cash-on-Cash Return
5.8%
Cap rate
1.0%
Rent to Value Ratio
Active
$219,900
3
bds
|
0
ba
|
1,413
sqft
|
built
1985
5856 Rock Rd, Union City, GA 30291
$-138
Cash flow
-3.3%
Cash-on-Cash Return
5.5%
Cap rate
0.8%
Rent to Value Ratio
Active
$430,000
2
bds
|
0
ba
|
1,646
sqft
|
built
1991
320 Harden St SE, Atlanta, GA 30312
$-1,084
Cash flow
-13.2%
Cash-on-Cash Return
3.1%
Cap rate
0.6%
Rent to Value Ratio

Active
$2,295,000
6
bds
|
8
ba
|
7,269
sqft
|
built
2012
821 Camden Park Ct NE, Atlanta, GA 30342
$-10,244
Cash flow
-23.3%
Cash-on-Cash Return
0.8%
Cap rate
0.3%
Rent to Value Ratio

Active
$350,000
3
bds
|
0
ba
|
1,364
sqft
|
built
1936
1104 Victory Dr SW, Atlanta, GA 30310
$-362
Cash flow
-5.4%
Cash-on-Cash Return
4.9%
Cap rate
0.7%
Rent to Value Ratio
Active
$263,000
2
bds
|
0
ba
|
975
sqft
|
built
1990
795 Hammond Dr, Atlanta, GA 30328
$214
Cash flow
4.2%
Cash-on-Cash Return
7.2%
Cap rate
0.9%
Rent to Value Ratio
Active
$280,000
3
bds
|
0
ba
|
0
sqft
|
built
1970
4945 Campbellton Rd SW, Atlanta, GA 30331
$-520
Cash flow
-9.7%
Cash-on-Cash Return
4.0%
Cap rate
0.6%
Rent to Value Ratio
Active
$258,000
3
bds
|
0
ba
|
1,176
sqft
|
built
1960
190 Judy Ln SW, Atlanta, GA 30315
$-246
Cash flow
-5.0%
Cash-on-Cash Return
5.1%
Cap rate
0.8%
Rent to Value Ratio
Active
$239,900
3
bds
|
0
ba
|
1,536
sqft
|
built
2020
5696 Union Pointe Dr, Union City, GA 30291
$-319
Cash flow
-6.9%
Cash-on-Cash Return
4.7%
Cap rate
0.8%
Rent to Value Ratio
Active
$190,000
1
bds
|
0
ba
|
688
sqft
|
built
1990
795 Hammond Dr, Atlanta, GA 30328
$-463
Cash flow
-12.7%
Cash-on-Cash Return
3.2%
Cap rate
0.8%
Rent to Value Ratio
Active
$500,000
2
bds
|
0
ba
|
0
sqft
|
built
2002
2828 Peachtree Rd NW, Atlanta, GA 30305
$-1,674
Cash flow
-17.5%
Cash-on-Cash Return
2.1%
Cap rate
0.7%
Rent to Value Ratio
Active
$320,000
4
bds
|
0
ba
|
2,030
sqft
|
built
1920
635 Queen St SW, Atlanta, GA 30310
$-440
Cash flow
-7.2%
Cash-on-Cash Return
4.5%
Cap rate
0.6%
Rent to Value Ratio
Active
$309,000
2
bds
|
0
ba
|
1,060
sqft
|
built
1975
1445 Monroe Dr NE, Atlanta, GA 30324
$-562
Cash flow
-9.5%
Cash-on-Cash Return
4.1%
Cap rate
0.6%
Rent to Value Ratio
Active
$1,295,000
3
bds
|
0
ba
|
3,028
sqft
|
built
2003
1260 Monroe Dr NE, Atlanta, GA 30306
$-3,445
Cash flow
-13.9%
Cash-on-Cash Return
3.1%
Cap rate
0.5%
Rent to Value Ratio
Active
$1,700,000
7
bds
|
8
ba
|
12,026
sqft
|
built
1985
5435 Chelsen Wood Dr, Duluth, GA 30097
$-6,507
Cash flow
-20.0%
Cash-on-Cash Return
1.7%
Cap rate
0.4%
Rent to Value Ratio
Active
$299,900
1
bds
|
1
ba
|
0
sqft
|
built
1974
145 15th St NE, Atlanta, GA 30309
$-1,130
Cash flow
-19.7%
Cash-on-Cash Return
1.6%
Cap rate
0.8%
Rent to Value Ratio
Active
$170,000
3
bds
|
0
ba
|
0
sqft
|
built
2004
3609 Ginnis Rd SW, Atlanta, GA 30331
$117
Cash flow
3.6%
Cash-on-Cash Return
7.1%
Cap rate
1.0%
Rent to Value Ratio

Active
$219,900
2
bds
|
0
ba
|
1,533
sqft
|
built
1950
879 Sylvan Pl SW, Atlanta, GA 30310
$52
Cash flow
1.2%
Cash-on-Cash Return
6.5%
Cap rate
1.0%
Rent to Value Ratio
Active
$275,000
3
bds
|
2
ba
|
0
sqft
|
built
1968
3206 Pyrite Cir SW, Atlanta, GA 30331
$-59
Cash flow
-1.1%
Cash-on-Cash Return
6.0%
Cap rate
0.8%
Rent to Value Ratio
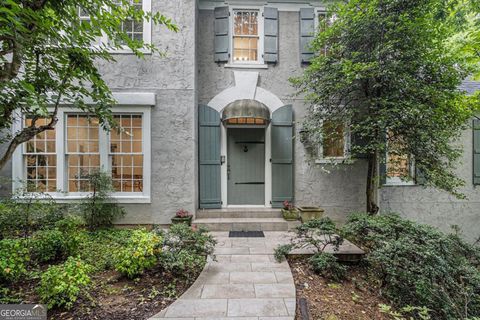
Active
$499,900
3
bds
|
0
ba
|
1,508
sqft
|
built
1925
1045 Moreland Ave SE, Atlanta, GA 30316
$-975
Cash flow
-10.2%
Cash-on-Cash Return
3.8%
Cap rate
0.6%
Rent to Value Ratio
Active
$389,000
1
bds
|
0
ba
|
762
sqft
|
built
2006
905 Juniper St NE, Atlanta, GA 30309
$-881
Cash flow
-11.8%
Cash-on-Cash Return
3.5%
Cap rate
0.6%
Rent to Value Ratio
Active
$350,000
3
bds
|
0
ba
|
1,459
sqft
|
built
1930
1585 Olympian Cir SW, Atlanta, GA 30310
$-129
Cash flow
-1.9%
Cash-on-Cash Return
5.8%
Cap rate
0.8%
Rent to Value Ratio

Active
$650,000
3
bds
|
0
ba
|
2,010
sqft
|
built
2003
1376 Parkview Ln NE, Atlanta, GA 30324
$-1,463
Cash flow
-11.7%
Cash-on-Cash Return
3.6%
Cap rate
0.7%
Rent to Value Ratio
Active
$209,900
4
bds
|
0
ba
|
3,059
sqft
|
built
1998
2355 Burdett Ridge Dr, Atlanta, GA 30349
$15
Cash flow
0.4%
Cash-on-Cash Return
6.4%
Cap rate
1.0%
Rent to Value Ratio
Active
$399,900
2
bds
|
0
ba
|
1,354
sqft
|
built
2008
3635 E Paces Cir NE, Atlanta, GA 30326
$-1,221
Cash flow
-15.9%
Cash-on-Cash Return
2.5%
Cap rate
0.7%
Rent to Value Ratio

Active
$435,000
4
bds
|
0
ba
|
1,750
sqft
|
built
1939
469 Mellview Ave SW, Atlanta, GA 30310
$-1,006
Cash flow
-12.1%
Cash-on-Cash Return
3.5%
Cap rate
0.6%
Rent to Value Ratio