Glenwood, IL Investment Properties for Sale
Browse homes for sale and investment properties in Glenwood, IL. Refine your search by price, property type, or more.
Best cash flowing properties in Glenwood, IL
Active
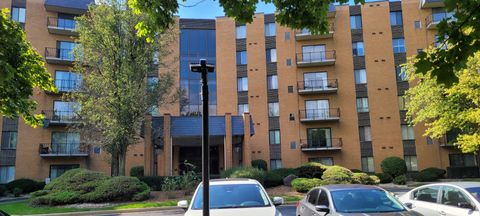
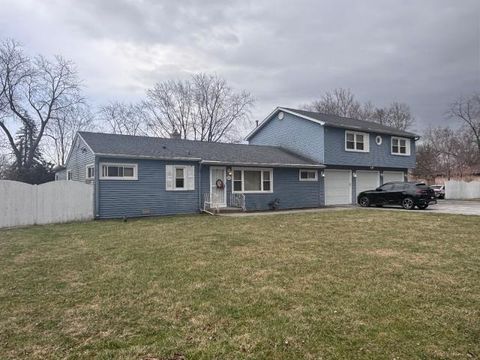
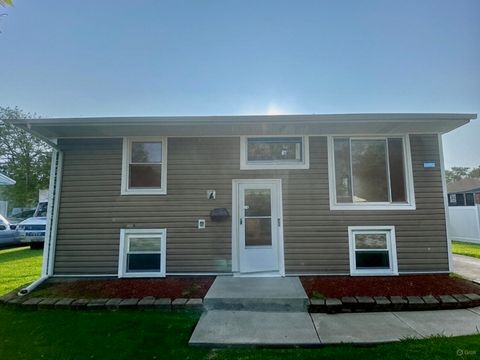
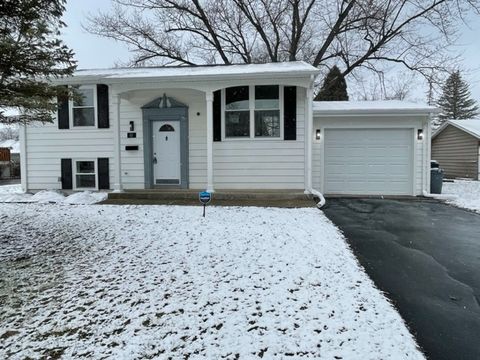
$155,000
2
bds
|
2
ba
|
1,200
sqft
|
built
1971
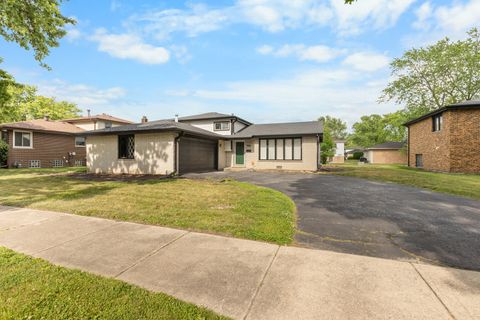
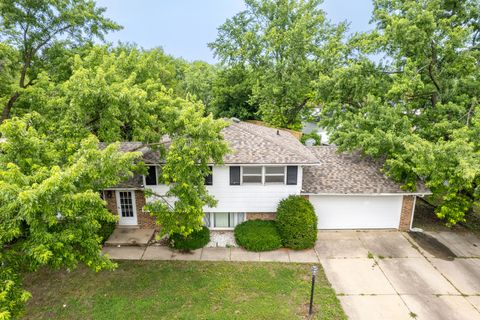
700 N Bruce Ln, Glenwood, IL 60425
$510
Cash flow
17.2%
Cash-on-Cash Return
9.6%
Cap rate
1.3%
Rent to Value Ratio
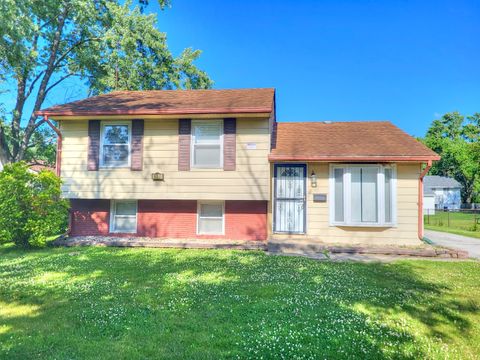
Active
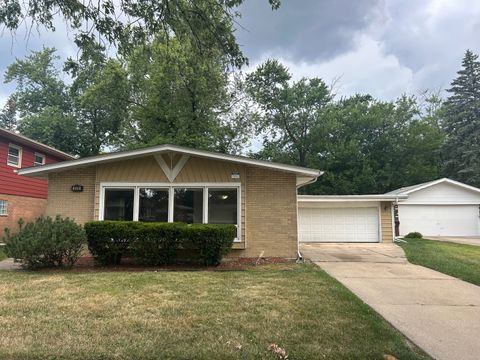
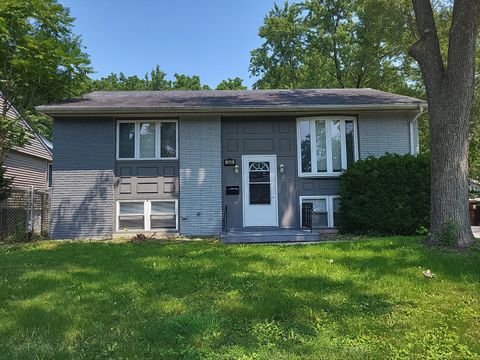
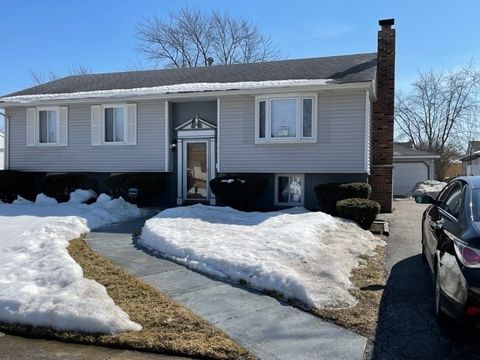
$202,000
4
bds
|
2
ba
|
1,500
sqft
|
built
1970
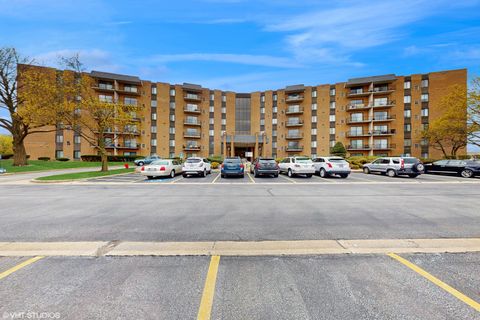
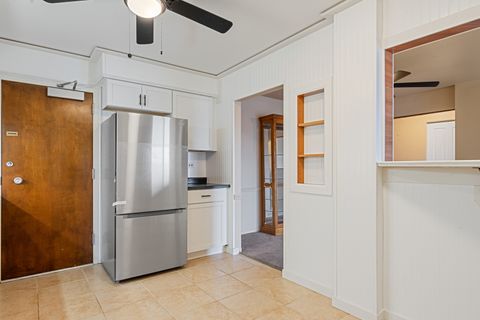
127 N Cedar Ln, Glenwood, IL 60425
$500
Cash flow
12.9%
Cash-on-Cash Return
8.6%
Cap rate
1.4%
Rent to Value Ratio
26 out of 27 properties for sale in Glenwood, IL
Limited Results Shown
Create a free account, or log in to reveal all property listings and enjoy the complete experience.
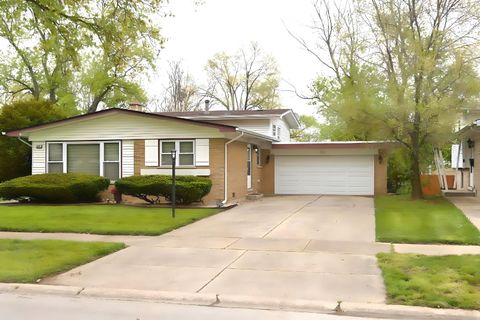
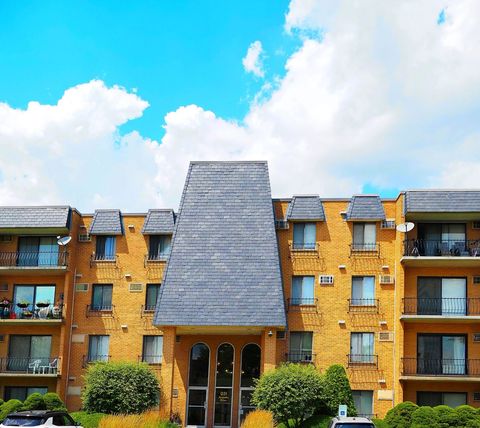
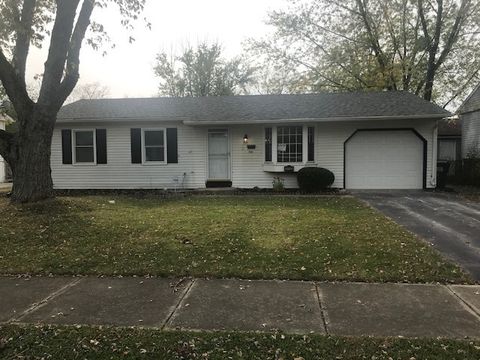
Active
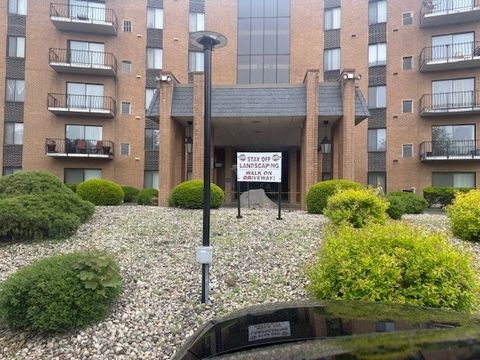
$275,000
3
bds
|
2
ba
|
1,500
sqft
|
built
1962
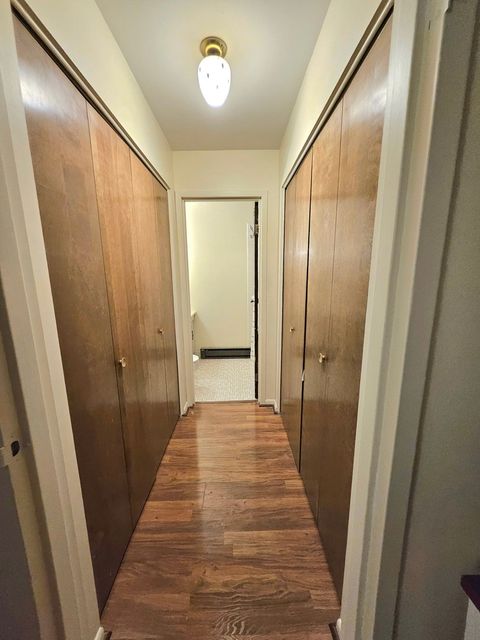
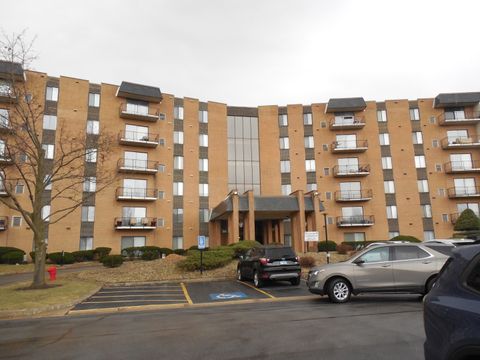
223 W Rainbow Dr, Glenwood, IL 60425
$181
Cash flow
3.4%
Cash-on-Cash Return
6.5%
Cap rate
1.0%
Rent to Value Ratio
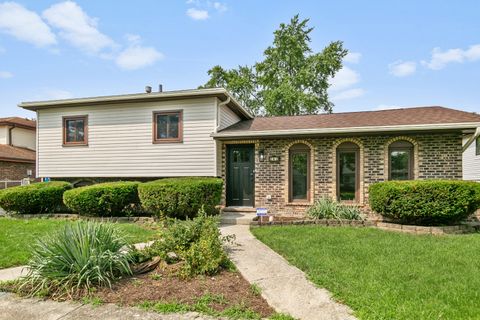
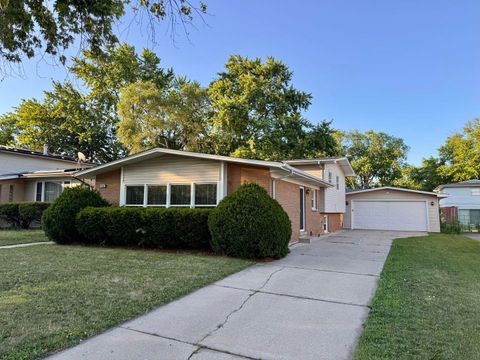
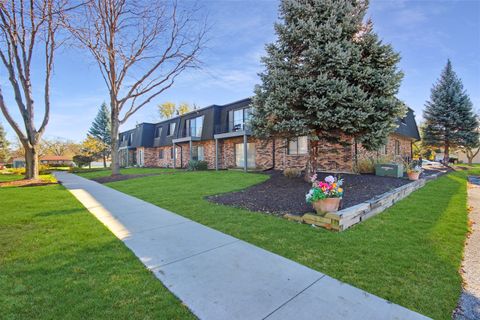
Active
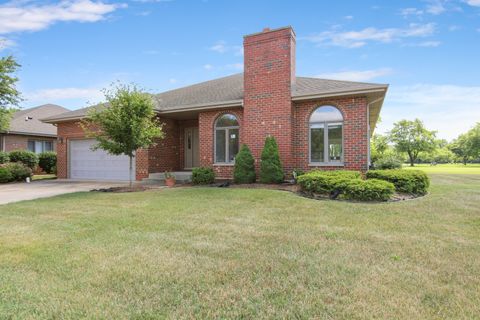
$334,700
3
bds
|
2
ba
|
1,476
sqft
|
built
1976
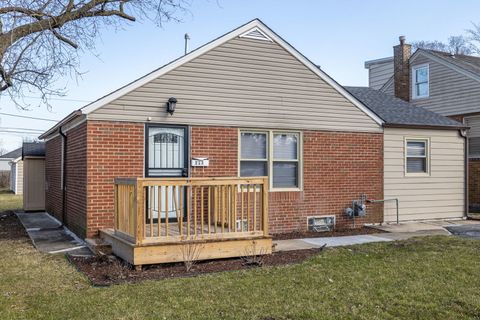
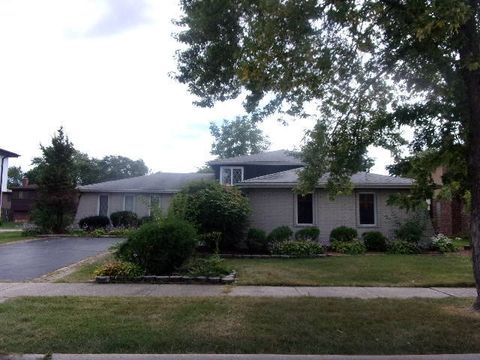
242 S Harper Ave, Glenwood, IL 60425
$-354
Cash flow
-5.5%
Cash-on-Cash Return
4.4%
Cap rate
0.8%
Rent to Value Ratio
Active
$269,000
4
bds
|
3
ba
|
2,494
sqft
|
built
1954
19119 S Saint Lawrence Ave, Glenwood, IL 60425
$330
Cash flow
6.4%
Cash-on-Cash Return
7.2%
Cap rate
1.2%
Rent to Value Ratio
Active
$245,000
3
bds
|
2
ba
|
1,269
sqft
|
built
1964
330 W Holly Ct, Glenwood, IL 60425
$230
Cash flow
4.9%
Cash-on-Cash Return
6.8%
Cap rate
1.3%
Rent to Value Ratio
Active
$155,000
2
bds
|
2
ba
|
955
sqft
|
built
1972
900 W Sunset Dr, Glenwood, IL 60425
$45
Cash flow
1.5%
Cash-on-Cash Return
6.0%
Cap rate
1.3%
Rent to Value Ratio
Active
$429,900
2
bds
|
2
ba
|
2,193
sqft
|
built
2004
417 S Glenwoodie Dr, Glenwood, IL 60425
$-932
Cash flow
-11.3%
Cash-on-Cash Return
3.1%
Cap rate
0.7%
Rent to Value Ratio
Active
$223,000
4
bds
|
2
ba
|
1,675
sqft
|
built
1973
130 N Oak Ln, Glenwood, IL 60425
$436
Cash flow
10.2%
Cash-on-Cash Return
8.0%
Cap rate
1.3%
Rent to Value Ratio
Active
$241,000
4
bds
|
2
ba
|
1,650
sqft
|
built
1968
349 E Maple Dr, Glenwood, IL 60425
$311
Cash flow
6.7%
Cash-on-Cash Return
7.2%
Cap rate
1.2%
Rent to Value Ratio
Active
$165,000
2
bds
|
2
ba
|
900
sqft
|
built
1978
931 W Arquilla Dr, Glenwood, IL 60425
$263
Cash flow
8.3%
Cash-on-Cash Return
7.6%
Cap rate
1.2%
Rent to Value Ratio
Active
$247,000
3
bds
|
2
ba
|
1,269
sqft
|
built
1965
900 W Strieff Ln, Glenwood, IL 60425
$0
Cash flow
0.0%
Cash-on-Cash Return
5.7%
Cap rate
1.1%
Rent to Value Ratio
Active
$249,900
3
bds
|
2
ba
|
1,500
sqft
|
built
1970
225 S Willow St, Glenwood, IL 60425
$183
Cash flow
3.8%
Cash-on-Cash Return
6.6%
Cap rate
1.1%
Rent to Value Ratio
Active
$134,900
2
bds
|
2
ba
|
1,000
sqft
|
built
1974
900 W Sunset Dr, Glenwood, IL 60425
$267
Cash flow
10.3%
Cash-on-Cash Return
8.1%
Cap rate
1.5%
Rent to Value Ratio
Active
$160,000
3
bds
|
2
ba
|
1,200
sqft
|
built
1970
931 W Arquilla Dr, Glenwood, IL 60425
$79
Cash flow
2.6%
Cash-on-Cash Return
6.3%
Cap rate
1.6%
Rent to Value Ratio
Active
$209,000
3
bds
|
2
ba
|
964
sqft
|
built
1956
113 N Rebecca St, Glenwood, IL 60425
$-48
Cash flow
-1.2%
Cash-on-Cash Return
5.4%
Cap rate
1.1%
Rent to Value Ratio
Active
$200,000
3
bds
|
2
ba
|
1,378
sqft
|
built
1969
555 N Cherry Dr, Glenwood, IL 60425
$119
Cash flow
3.1%
Cash-on-Cash Return
6.4%
Cap rate
1.3%
Rent to Value Ratio

Active
$220,000
3
bds
|
1
ba
|
1,416
sqft
|
built
1923
22 W Main St, Glenwood, IL 60425
$175
Cash flow
4.2%
Cash-on-Cash Return
6.6%
Cap rate
1.2%
Rent to Value Ratio

Active
$218,000
4
bds
|
2
ba
|
1,690
sqft
|
built
1972
436 N Pleasant Dr, Glenwood, IL 60425
$120
Cash flow
2.9%
Cash-on-Cash Return
6.3%
Cap rate
1.3%
Rent to Value Ratio
Active
$155,000
2
bds
|
2
ba
|
1,200
sqft
|
built
1971
700 N Bruce Ln, Glenwood, IL 60425
$118
Cash flow
4.0%
Cash-on-Cash Return
6.6%
Cap rate
1.3%
Rent to Value Ratio
Active
$119,000
2
bds
|
2
ba
|
1,100
sqft
|
built
1974
900 W Sunset Dr, Glenwood, IL 60425
$101
Cash flow
4.4%
Cash-on-Cash Return
6.7%
Cap rate
1.7%
Rent to Value Ratio
Active
$250,000
3
bds
|
3
ba
|
2,008
sqft
|
built
1975
951 E 193rd St, Glenwood, IL 60425
$392
Cash flow
8.2%
Cash-on-Cash Return
7.6%
Cap rate
1.3%
Rent to Value Ratio
Active
$229,000
2
bds
|
2
ba
|
763
sqft
|
built
1967
40 N Sycamore Ln, Glenwood, IL 60425
$234
Cash flow
5.3%
Cash-on-Cash Return
6.9%
Cap rate
1.1%
Rent to Value Ratio
Active
$235,000
4
bds
|
2
ba
|
1,800
sqft
|
built
1970
304 E Birch Dr, Glenwood, IL 60425
$235
Cash flow
5.2%
Cash-on-Cash Return
6.9%
Cap rate
1.1%
Rent to Value Ratio
Active
$195,000
3
bds
|
1
ba
|
950
sqft
|
built
1971
110 N Oak St, Glenwood, IL 60425
$120
Cash flow
3.2%
Cash-on-Cash Return
6.4%
Cap rate
1.1%
Rent to Value Ratio
Active
$120,700
2
bds
|
1
ba
|
809
sqft
|
built
1954
830 E 191st Pl, Glenwood, IL 60425
$301
Cash flow
13.0%
Cash-on-Cash Return
8.7%
Cap rate
1.7%
Rent to Value Ratio