Glenwood, IL Investment Properties for Sale
Browse homes for sale and investment properties in Glenwood, IL. Refine your search by price, property type, or more.
Best cash flowing properties in Glenwood, IL
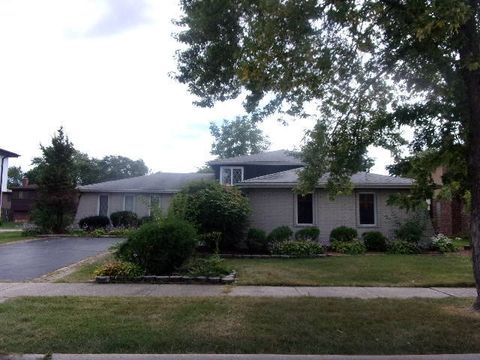
Active
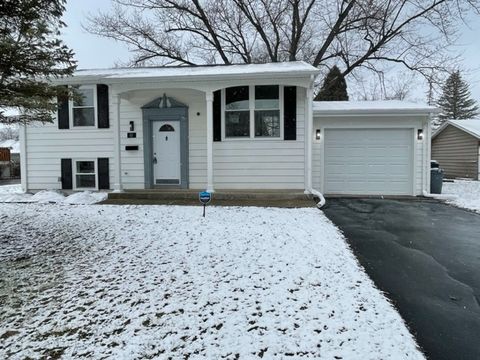
$250,000
3
bds
|
3
ba
|
2,008
sqft
|
built
1975
951 E 193rd St, Glenwood, IL 60425
$392
Cash flow
8.2%
Cash-on-Cash Return
7.6%
Cap rate
1.3%
Rent to Value Ratio
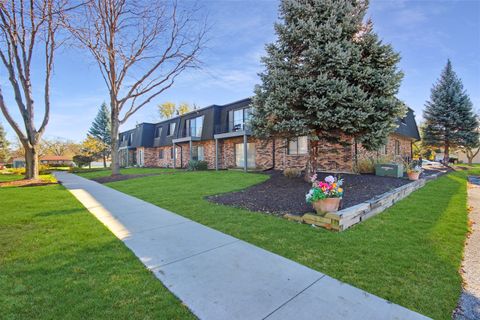
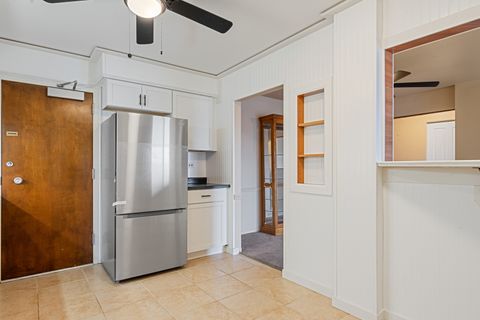
Active
$120,700
2
bds
|
1
ba
|
809
sqft
|
built
1954
830 E 191st Pl, Glenwood, IL 60425
$301
Cash flow
13.0%
Cash-on-Cash Return
8.7%
Cap rate
1.7%
Rent to Value Ratio
16 out of 33 properties for sale in Glenwood, IL
Limited Results Shown
Create a free account, or log in to reveal all property listings and enjoy the complete experience.
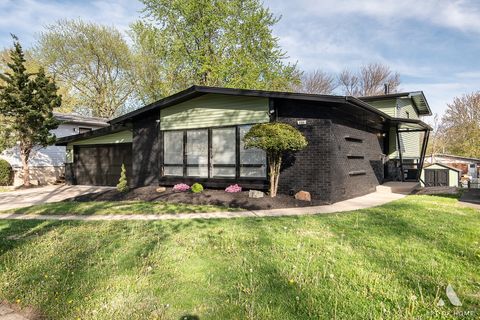
Active
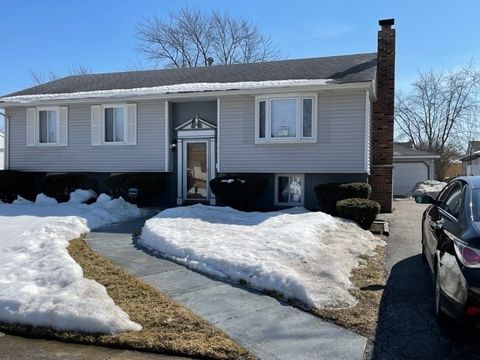
$329,900
3
bds
|
2
ba
|
1,400
sqft
|
built
1963
251 N Pleasant Dr, Glenwood, IL 60425
$-385
Cash flow
-6.1%
Cash-on-Cash Return
4.3%
Cap rate
0.8%
Rent to Value Ratio
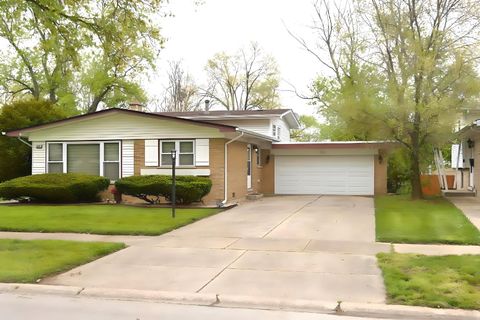
Active
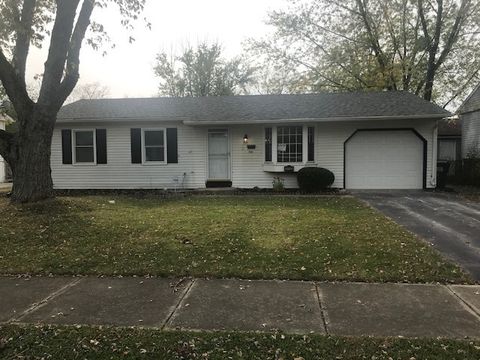
$275,000
3
bds
|
2
ba
|
1,500
sqft
|
built
1962
223 W Rainbow Dr, Glenwood, IL 60425
$181
Cash flow
3.4%
Cash-on-Cash Return
6.5%
Cap rate
1.0%
Rent to Value Ratio
Active
$134,900
2
bds
|
2
ba
|
1,000
sqft
|
built
1974
900 W Sunset Dr, Glenwood, IL 60425
$267
Cash flow
10.3%
Cash-on-Cash Return
8.1%
Cap rate
1.5%
Rent to Value Ratio
Active
$209,000
3
bds
|
2
ba
|
964
sqft
|
built
1956
113 N Rebecca St, Glenwood, IL 60425
$-48
Cash flow
-1.2%
Cash-on-Cash Return
5.4%
Cap rate
1.1%
Rent to Value Ratio

Active
$294,700
3
bds
|
2
ba
|
1,088
sqft
|
built
1963
214 N Gay Ct, Glenwood, IL 60425
$-475
Cash flow
-8.4%
Cash-on-Cash Return
3.7%
Cap rate
0.8%
Rent to Value Ratio

Active
$220,000
3
bds
|
1
ba
|
1,416
sqft
|
built
1923
22 W Main St, Glenwood, IL 60425
$175
Cash flow
4.2%
Cash-on-Cash Return
6.6%
Cap rate
1.2%
Rent to Value Ratio

Active
$284,900
3
bds
|
2
ba
|
1,164
sqft
|
built
1976
710 E 194th St, Glenwood, IL 60425
$226
Cash flow
4.1%
Cash-on-Cash Return
6.6%
Cap rate
1.1%
Rent to Value Ratio

Active
$218,000
4
bds
|
2
ba
|
1,690
sqft
|
built
1972
436 N Pleasant Dr, Glenwood, IL 60425
$120
Cash flow
2.9%
Cash-on-Cash Return
6.3%
Cap rate
1.3%
Rent to Value Ratio
Active
$155,000
2
bds
|
2
ba
|
1,200
sqft
|
built
1971
700 N Bruce Ln, Glenwood, IL 60425
$118
Cash flow
4.0%
Cash-on-Cash Return
6.6%
Cap rate
1.3%
Rent to Value Ratio

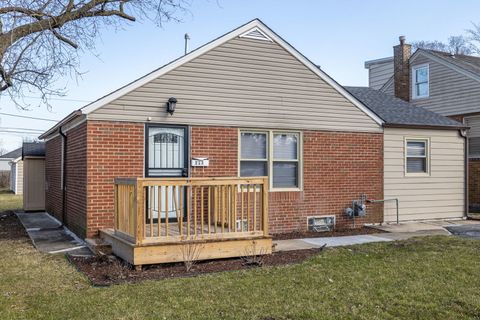
Active
$120,000
2
bds
|
1
ba
|
700
sqft
|
built
1972
830 E 191st Pl, Glenwood, IL 60425
$96
Cash flow
4.2%
Cash-on-Cash Return
6.6%
Cap rate
1.4%
Rent to Value Ratio
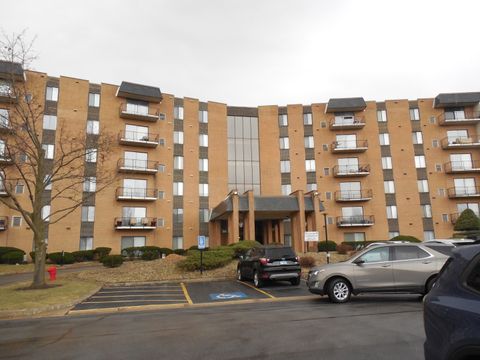
Active
$119,000
2
bds
|
2
ba
|
1,100
sqft
|
built
1974
900 W Sunset Dr, Glenwood, IL 60425
$101
Cash flow
4.4%
Cash-on-Cash Return
6.7%
Cap rate
1.7%
Rent to Value Ratio
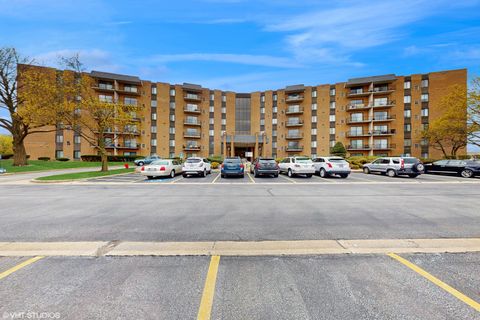
Active
$229,000
2
bds
|
2
ba
|
763
sqft
|
built
1967
40 N Sycamore Ln, Glenwood, IL 60425
$234
Cash flow
5.3%
Cash-on-Cash Return
6.9%
Cap rate
1.1%
Rent to Value Ratio
Active
$235,000
4
bds
|
2
ba
|
1,800
sqft
|
built
1970
304 E Birch Dr, Glenwood, IL 60425
$235
Cash flow
5.2%
Cash-on-Cash Return
6.9%
Cap rate
1.1%
Rent to Value Ratio
Active
$195,000
3
bds
|
1
ba
|
950
sqft
|
built
1971
110 N Oak St, Glenwood, IL 60425
$120
Cash flow
3.2%
Cash-on-Cash Return
6.4%
Cap rate
1.1%
Rent to Value Ratio