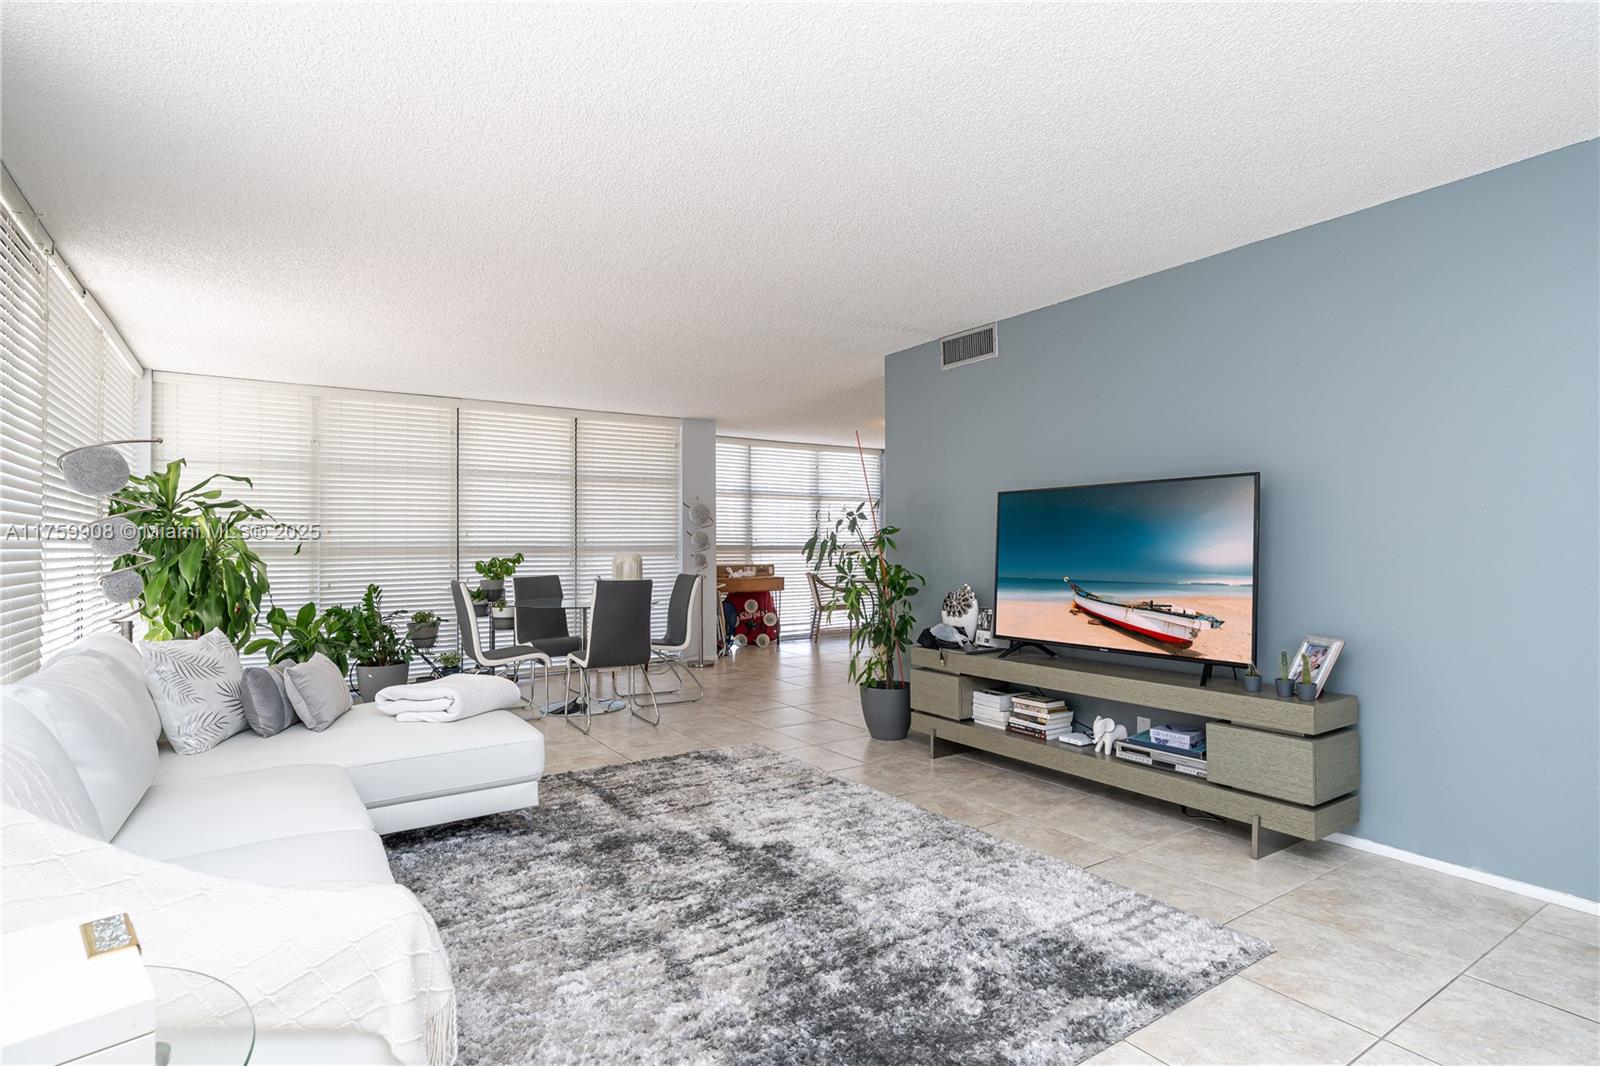
Hallandale Beach, FL Investment Properties for Sale
Browse homes for sale and investment properties in Hallandale Beach, FL. Refine your search by price, property type, or more.
Best cash flowing properties in Hallandale Beach, FL
Active
$235,000
1
bds
|
2
ba
|
982
sqft
|
built
1973
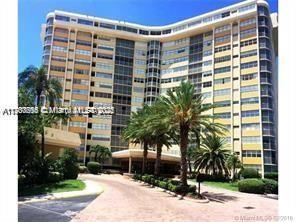
100 Golden Isles Dr, Hallandale Beach, FL 33009
$219
Cash flow
4.9%
Cash-on-Cash Return
7.4%
Cap rate
1.0%
Rent to Value Ratio
Active
$270,000
2
bds
|
2
ba
|
1,075
sqft
|
built
1981
400 Leslie Dr, Hallandale Beach, FL 33009
$-211
Cash flow
-4.1%
Cash-on-Cash Return
5.3%
Cap rate
1.0%
Rent to Value Ratio
833 out of 931 properties for sale in Hallandale Beach, FL
Limited Results Shown
Create a free account, or log in to reveal all property listings and enjoy the complete experience.
Active
$4,250,000
5
bds
|
6
ba
|
4,126
sqft
|
built
1978
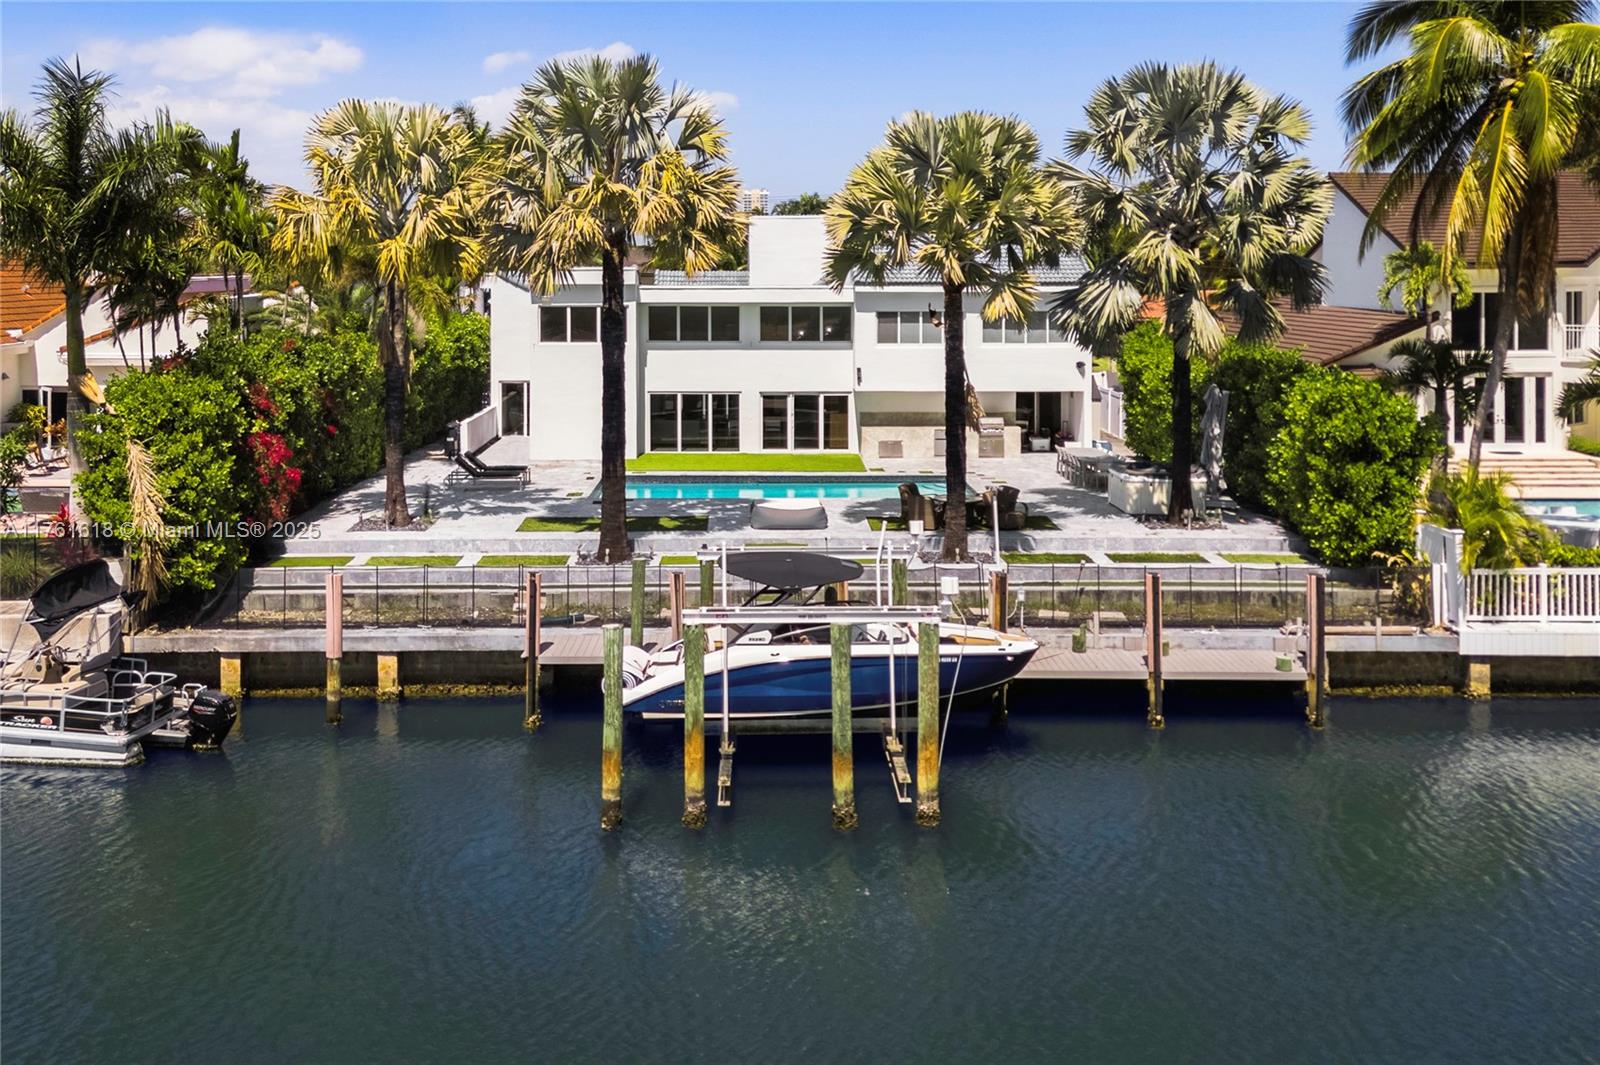
449 Holiday Dr, Hallandale Beach, FL 33009
$-19,925
Cash flow
-24.5%
Cash-on-Cash Return
0.7%
Cap rate
0.3%
Rent to Value Ratio
Active
$1,190,000
2
bds
|
2
ba
|
1,458
sqft
|
built
2006
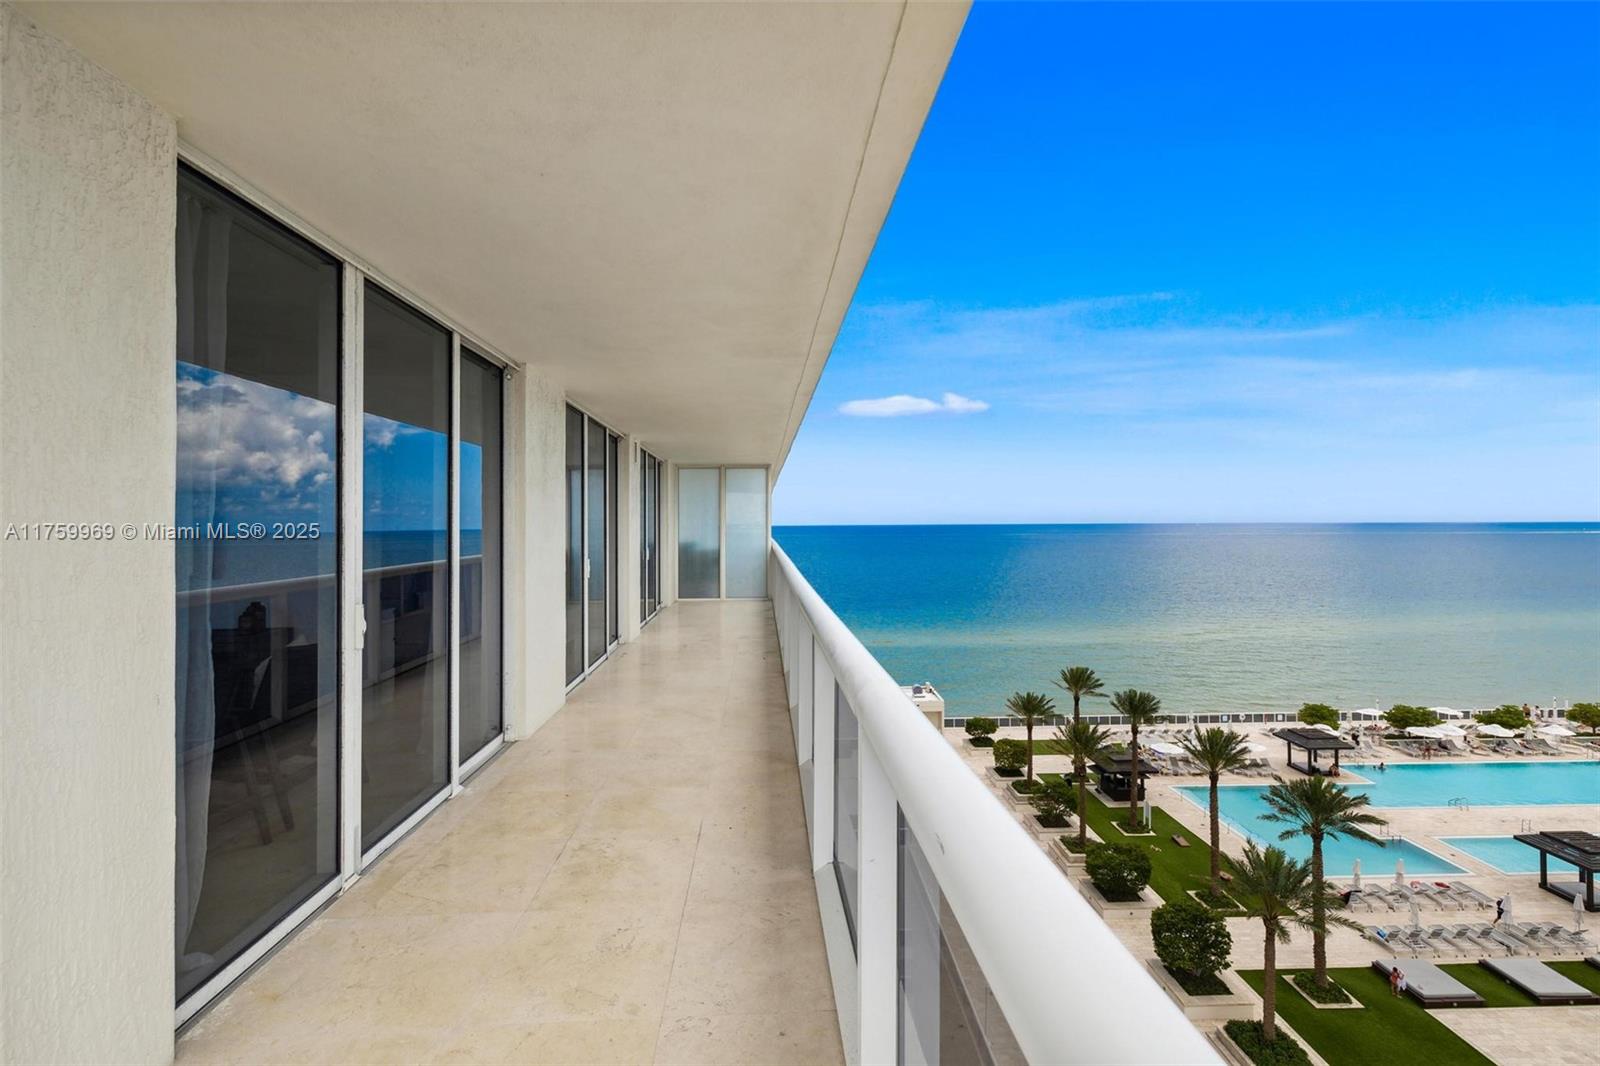
1830 S Ocean Dr, Hallandale Beach, FL 33009
$-2,994
Cash flow
-13.1%
Cash-on-Cash Return
3.3%
Cap rate
0.7%
Rent to Value Ratio
Active
$310,000
2
bds
|
2
ba
|
1,100
sqft
|
built
1972
1833 S Ocean Dr, Hallandale Beach, FL 33009
$-1,221
Cash flow
-20.5%
Cash-on-Cash Return
1.6%
Cap rate
0.8%
Rent to Value Ratio
Active
$1,160,000
2
bds
|
2
ba
|
1,458
sqft
|
built
2006
1830 S Ocean Dr, Hallandale Beach, FL 33009
$-4,332
Cash flow
-19.5%
Cash-on-Cash Return
1.8%
Cap rate
0.6%
Rent to Value Ratio
Active
$235,000
2
bds
|
2
ba
|
979
sqft
|
built
1980
701 NE 1st Ct, Hallandale Beach, FL 33009
$-598
Cash flow
-13.3%
Cash-on-Cash Return
3.2%
Cap rate
0.9%
Rent to Value Ratio
Active
$955,000
3
bds
|
3
ba
|
1,737
sqft
|
built
2015
2600 E Hallandale Beach Blvd, Hallandale Beach, FL 33009
$-3,430
Cash flow
-18.7%
Cash-on-Cash Return
2.0%
Cap rate
0.7%
Rent to Value Ratio
Active
$235,000
1
bds
|
2
ba
|
982
sqft
|
built
1973
100 Golden Isles Dr, Hallandale Beach, FL 33009
$219
Cash flow
4.9%
Cash-on-Cash Return
7.4%
Cap rate
1.0%
Rent to Value Ratio
Active
$395,000
2
bds
|
2
ba
|
1,430
sqft
|
built
1981
200 Leslie Dr, Hallandale Beach, FL 33009
$-2,361
Cash flow
-31.2%
Cash-on-Cash Return
-0.9%
Cap rate
0.7%
Rent to Value Ratio

Active
$185,000
1
bds
|
1
ba
|
645
sqft
|
built
1969
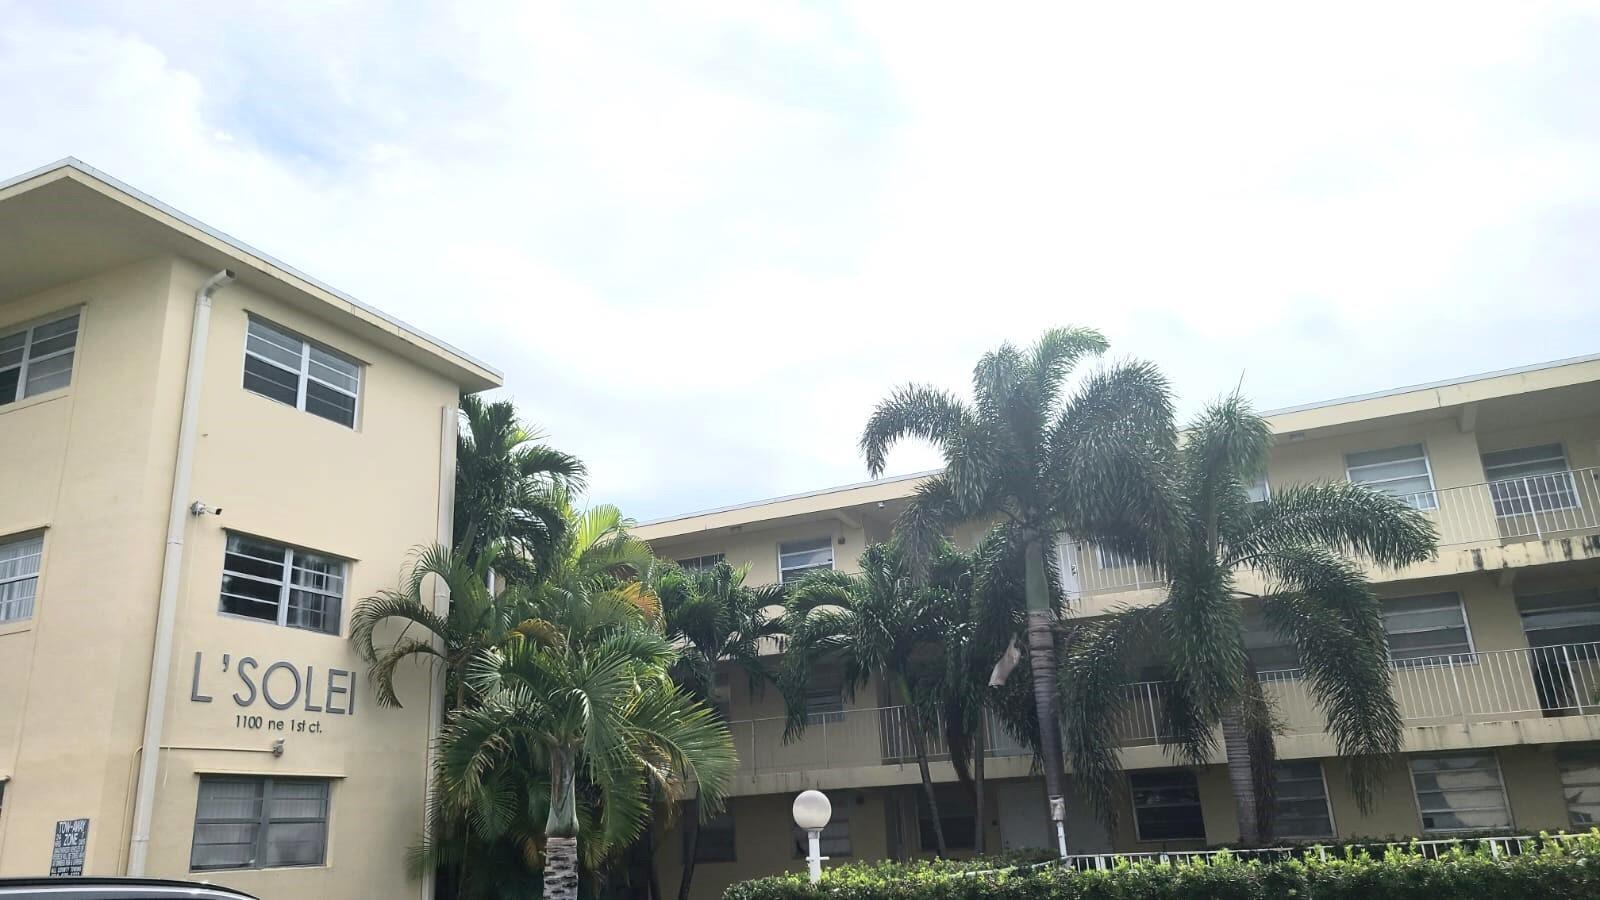
1100 NE 1st Ct, Hallandale Beach, FL 33009
$-452
Cash flow
-12.7%
Cash-on-Cash Return
3.4%
Cap rate
1.0%
Rent to Value Ratio

Active
$339,999
2
bds
|
2
ba
|
1,250
sqft
|
built
1976
3113 S Ocean Dr, Hallandale Beach, FL 33009
$-890
Cash flow
-13.7%
Cash-on-Cash Return
3.1%
Cap rate
0.8%
Rent to Value Ratio
Active
$245,000
2
bds
|
2
ba
|
965
sqft
|
built
1980
270 Layne Blvd, Hallandale Beach, FL 33009
$-766
Cash flow
-16.3%
Cash-on-Cash Return
2.5%
Cap rate
0.9%
Rent to Value Ratio
Active
$299,900
2
bds
|
2
ba
|
1,400
sqft
|
built
1974
500 Three Islands Blvd, Hallandale Beach, FL 33009
$-1,303
Cash flow
-22.7%
Cash-on-Cash Return
1.1%
Cap rate
0.8%
Rent to Value Ratio
Active
$439,900
3
bds
|
2
ba
|
1,360
sqft
|
built
1974
2049 S Ocean Dr, Hallandale Beach, FL 33009
$-1,518
Cash flow
-18.0%
Cash-on-Cash Return
2.1%
Cap rate
0.7%
Rent to Value Ratio
Active
$423,000
2
bds
|
2
ba
|
1,420
sqft
|
built
1984
300 Three Islands Blvd, Hallandale Beach, FL 33009
$-1,638
Cash flow
-20.2%
Cash-on-Cash Return
1.6%
Cap rate
0.8%
Rent to Value Ratio
Active
$265,000
1
bds
|
1
ba
|
820
sqft
|
built
1974
501 Three Islands Blvd, Hallandale Beach, FL 33009
$-742
Cash flow
-14.6%
Cash-on-Cash Return
2.9%
Cap rate
0.8%
Rent to Value Ratio
Active
$295,000
2
bds
|
2
ba
|
1,400
sqft
|
built
1975
600 Three Islands Blvd, Hallandale Beach, FL 33009
$-1,225
Cash flow
-21.7%
Cash-on-Cash Return
1.3%
Cap rate
1.0%
Rent to Value Ratio
Active
$679,000
2
bds
|
2
ba
|
1,440
sqft
|
built
1974
1904 S Ocean Dr, Hallandale Beach, FL 33009
$-2,952
Cash flow
-22.7%
Cash-on-Cash Return
1.1%
Cap rate
0.6%
Rent to Value Ratio
Active
$360,000
2
bds
|
2
ba
|
1,130
sqft
|
built
1981
200 Leslie Dr, Hallandale Beach, FL 33009
$-1,516
Cash flow
-22.0%
Cash-on-Cash Return
1.2%
Cap rate
0.8%
Rent to Value Ratio
Active
$2,990,000
bds
|
0
ba
|
6,994
sqft
|
built
1977
129 SE 5th St, Hallandale Beach, FL 33009
$-16,387
Cash flow
-28.6%
Cash-on-Cash Return
-0.3%
Cap rate
0.0%
Rent to Value Ratio
Active
$199,000
1
bds
|
1
ba
|
545
sqft
|
built
1970
1965 S Ocean Dr, Hallandale Beach, FL 33009
$-417
Cash flow
-10.9%
Cash-on-Cash Return
3.8%
Cap rate
1.1%
Rent to Value Ratio
Active
$195,000
1
bds
|
2
ba
|
1,071
sqft
|
built
1967
850 NE 12th Ave, Hallandale Beach, FL 33009
$-501
Cash flow
-13.4%
Cash-on-Cash Return
3.2%
Cap rate
1.0%
Rent to Value Ratio
Active
$875,000
5
bds
|
4
ba
|
1,912
sqft
|
built
2020
814 NE 4th St, Hallandale Beach, FL 33009
$-2,481
Cash flow
-14.8%
Cash-on-Cash Return
2.9%
Cap rate
0.5%
Rent to Value Ratio
Active
$180,000
1
bds
|
2
ba
|
915
sqft
|
built
1981
200 Leslie Dr, Hallandale Beach, FL 33009
$-469
Cash flow
-13.6%
Cash-on-Cash Return
3.2%
Cap rate
1.4%
Rent to Value Ratio

Active
$658,000
2
bds
|
2
ba
|
1,240
sqft
|
built
1971
1950 S Ocean Dr, Hallandale Beach, FL 33009
$-2,688
Cash flow
-21.3%
Cash-on-Cash Return
1.4%
Cap rate
0.6%
Rent to Value Ratio
Active
$270,000
2
bds
|
2
ba
|
1,075
sqft
|
built
1981
400 Leslie Dr, Hallandale Beach, FL 33009
$-211
Cash flow
-4.1%
Cash-on-Cash Return
5.3%
Cap rate
1.0%
Rent to Value Ratio
Active
$170,000
1
bds
|
1
ba
|
658
sqft
|
built
1969
1100 NE 1st Ct, Hallandale Beach, FL 33009
$-498
Cash flow
-15.3%
Cash-on-Cash Return
2.8%
Cap rate
0.9%
Rent to Value Ratio
Active
$349,500
2
bds
|
2
ba
|
1,580
sqft
|
built
1980
2500 Parkview Dr, Hallandale Beach, FL 33009
$-1,900
Cash flow
-28.4%
Cash-on-Cash Return
-0.2%
Cap rate
0.9%
Rent to Value Ratio

Active
$349,000
1
bds
|
2
ba
|
920
sqft
|
built
2007
1745 E Hallandale Beach Blvd, Hallandale Beach, FL 33009
$-1,647
Cash flow
-24.6%
Cash-on-Cash Return
0.6%
Cap rate
0.7%
Rent to Value Ratio
Active
$280,000
1
bds
|
2
ba
|
1,300
sqft
|
built
1974
1865 S Ocean Dr, Hallandale Beach, FL 33009
$-1,212
Cash flow
-22.6%
Cash-on-Cash Return
1.1%
Cap rate
0.9%
Rent to Value Ratio
Active
$675,000
1
bds
|
1
ba
|
871
sqft
|
built
2006
1830 S Ocean Dr, Hallandale Beach, FL 33009
$-2,826
Cash flow
-21.8%
Cash-on-Cash Return
1.3%
Cap rate
0.6%
Rent to Value Ratio

Active
$3,595,000
3
bds
|
4
ba
|
2,530
sqft
|
built
2022
2000 S Ocean Dr, Hallandale Beach, FL 33009
$-19,641
Cash flow
-28.5%
Cash-on-Cash Return
-0.3%
Cap rate
0.3%
Rent to Value Ratio
Active
$650,000
2
bds
|
3
ba
|
1,330
sqft
|
built
2007
1945 S Ocean Dr, Hallandale Beach, FL 33009
$-2,789
Cash flow
-22.4%
Cash-on-Cash Return
1.1%
Cap rate
0.6%
Rent to Value Ratio
Active
$650,000
3
bds
|
1
ba
|
1,190
sqft
|
built
1956
819 NE 2nd Ct, Hallandale Beach, FL 33009
$-1,463
Cash flow
-11.7%
Cash-on-Cash Return
3.6%
Cap rate
0.5%
Rent to Value Ratio
Active
$660,000
1
bds
|
1
ba
|
844
sqft
|
built
2006
1830 S Ocean Dr, Hallandale Beach, FL 33009
$-2,404
Cash flow
-19.0%
Cash-on-Cash Return
1.9%
Cap rate
0.7%
Rent to Value Ratio
Active
$221,999
1
bds
|
1
ba
|
700
sqft
|
built
1980
1913 S Ocean Dr, Hallandale Beach, FL 33009
$-720
Cash flow
-16.9%
Cash-on-Cash Return
2.4%
Cap rate
0.9%
Rent to Value Ratio

Active
$455,000
2
bds
|
2
ba
|
1,081
sqft
|
built
2007
1745 E Hallandale Beach Blvd, Hallandale Beach, FL 33009
$-1,575
Cash flow
-18.1%
Cash-on-Cash Return
2.1%
Cap rate
0.8%
Rent to Value Ratio
Active
$835,000
3
bds
|
3
ba
|
1,737
sqft
|
built
2015
2600 E Hallandale Beach Blvd, Hallandale Beach, FL 33009
$-2,942
Cash flow
-18.4%
Cash-on-Cash Return
2.1%
Cap rate
0.8%
Rent to Value Ratio
Active
$368,900
2
bds
|
2
ba
|
1,280
sqft
|
built
1980
2500 Parkview Dr, Hallandale Beach, FL 33009
$-355
Cash flow
-5.0%
Cash-on-Cash Return
5.1%
Cap rate
0.8%
Rent to Value Ratio

Active
$530,000
2
bds
|
2
ba
|
1,031
sqft
|
built
1972
3180 S Ocean Dr, Hallandale Beach, FL 33009
$-2,659
Cash flow
-26.2%
Cash-on-Cash Return
0.3%
Cap rate
0.6%
Rent to Value Ratio

Active
$230,000
1
bds
|
2
ba
|
834
sqft
|
built
1973
100 Golden Isles Dr, Hallandale Beach, FL 33009
$-710
Cash flow
-16.1%
Cash-on-Cash Return
2.6%
Cap rate
0.9%
Rent to Value Ratio