Hallandale Beach, FL Investment Properties for Sale
Browse homes for sale and investment properties in Hallandale Beach, FL. Refine your search by price, property type, or more.
Best cash flowing properties in Hallandale Beach, FL
Active
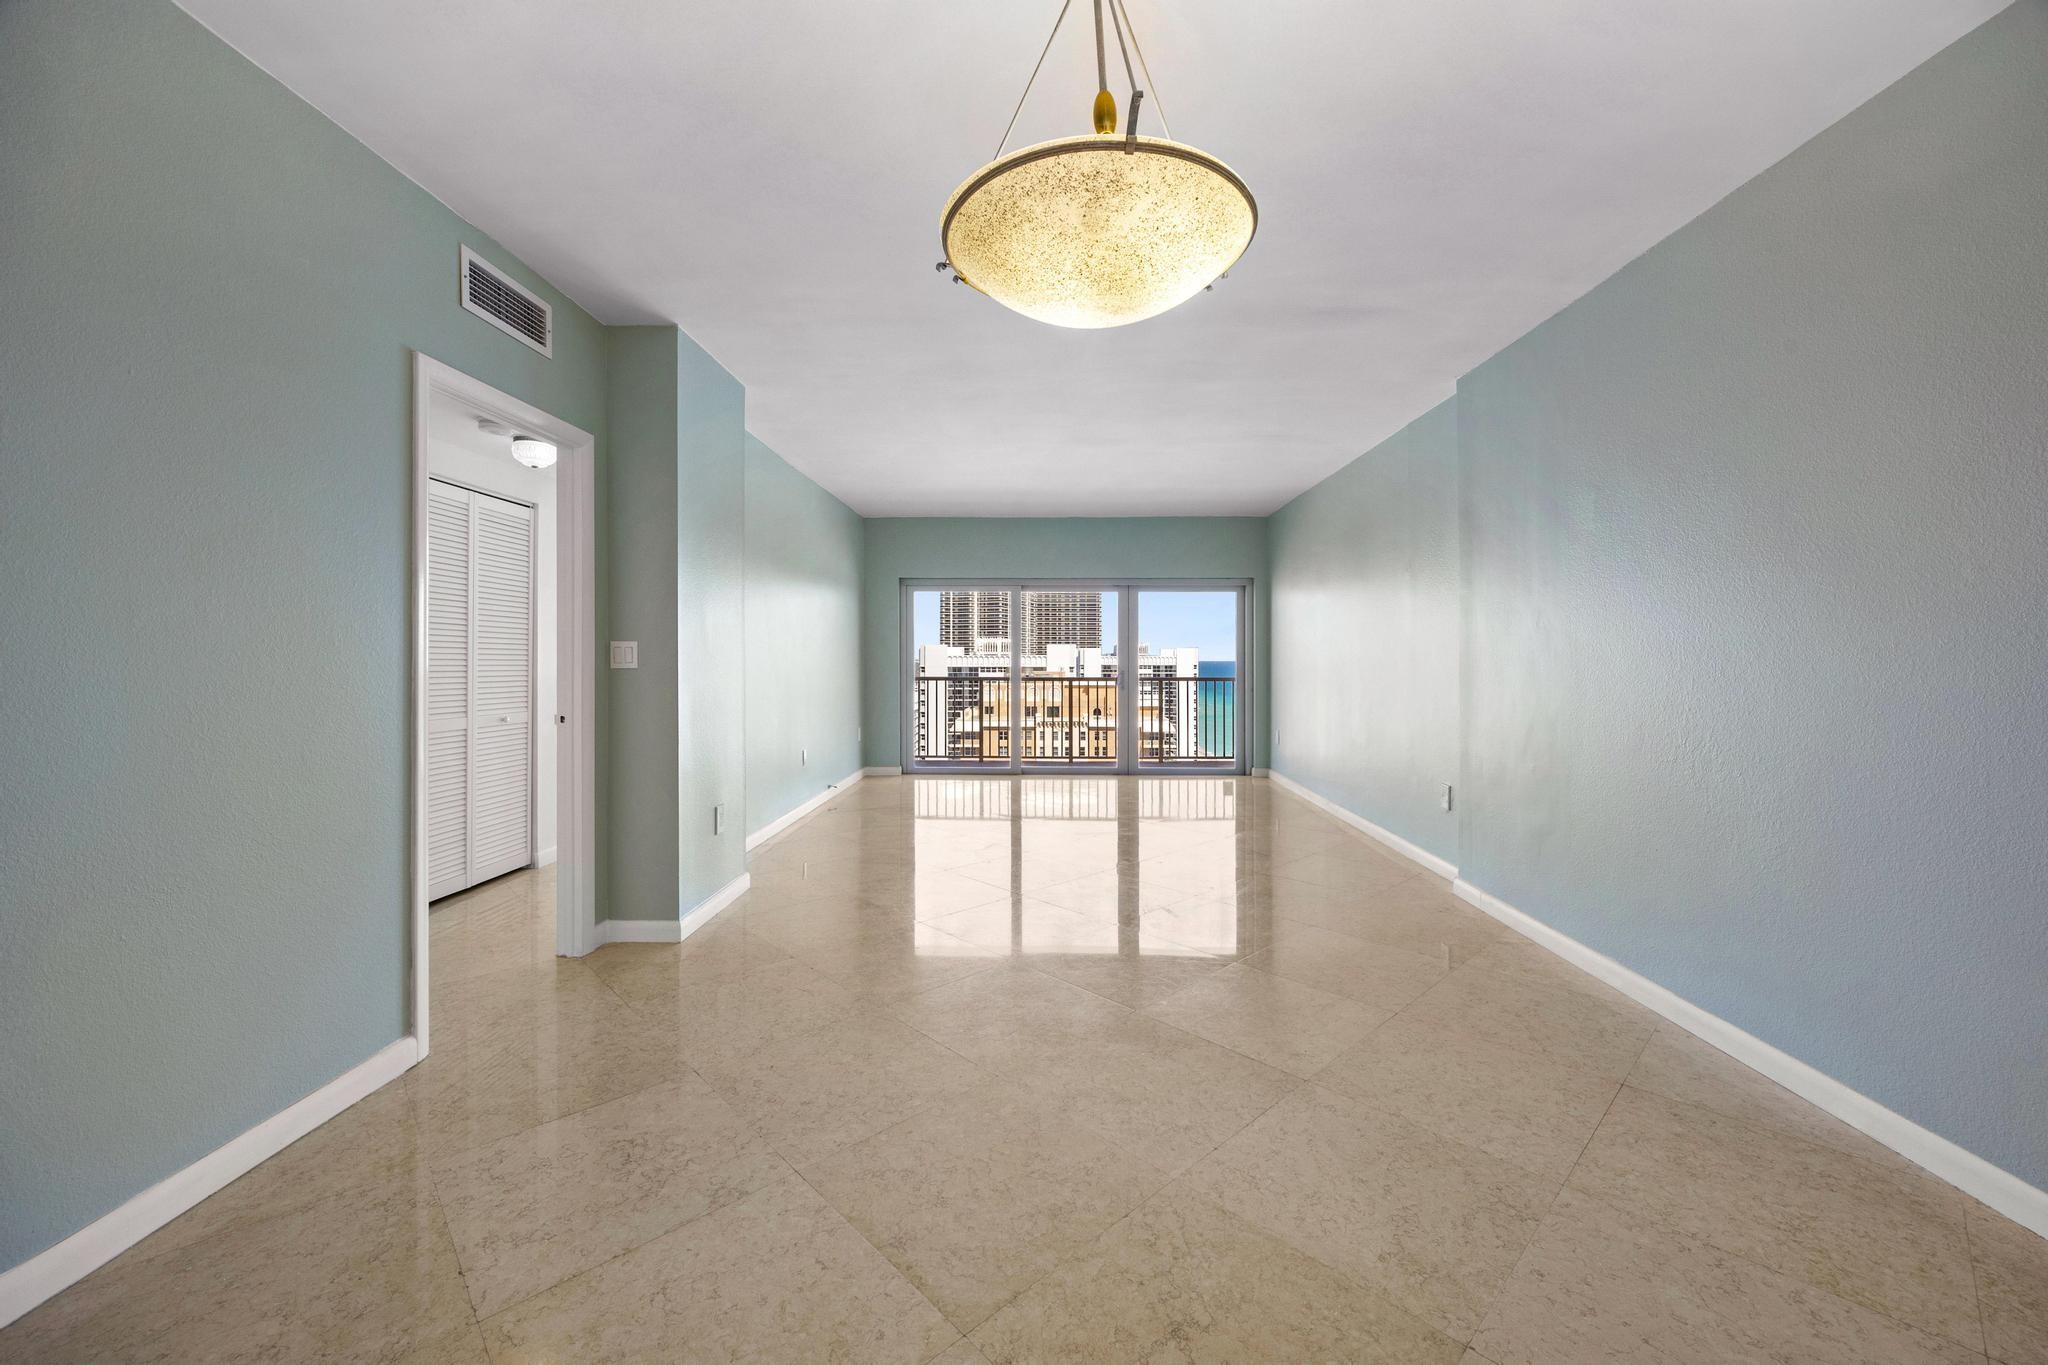
$210,000
2
bds
|
2
ba
|
924
sqft
|
built
1974
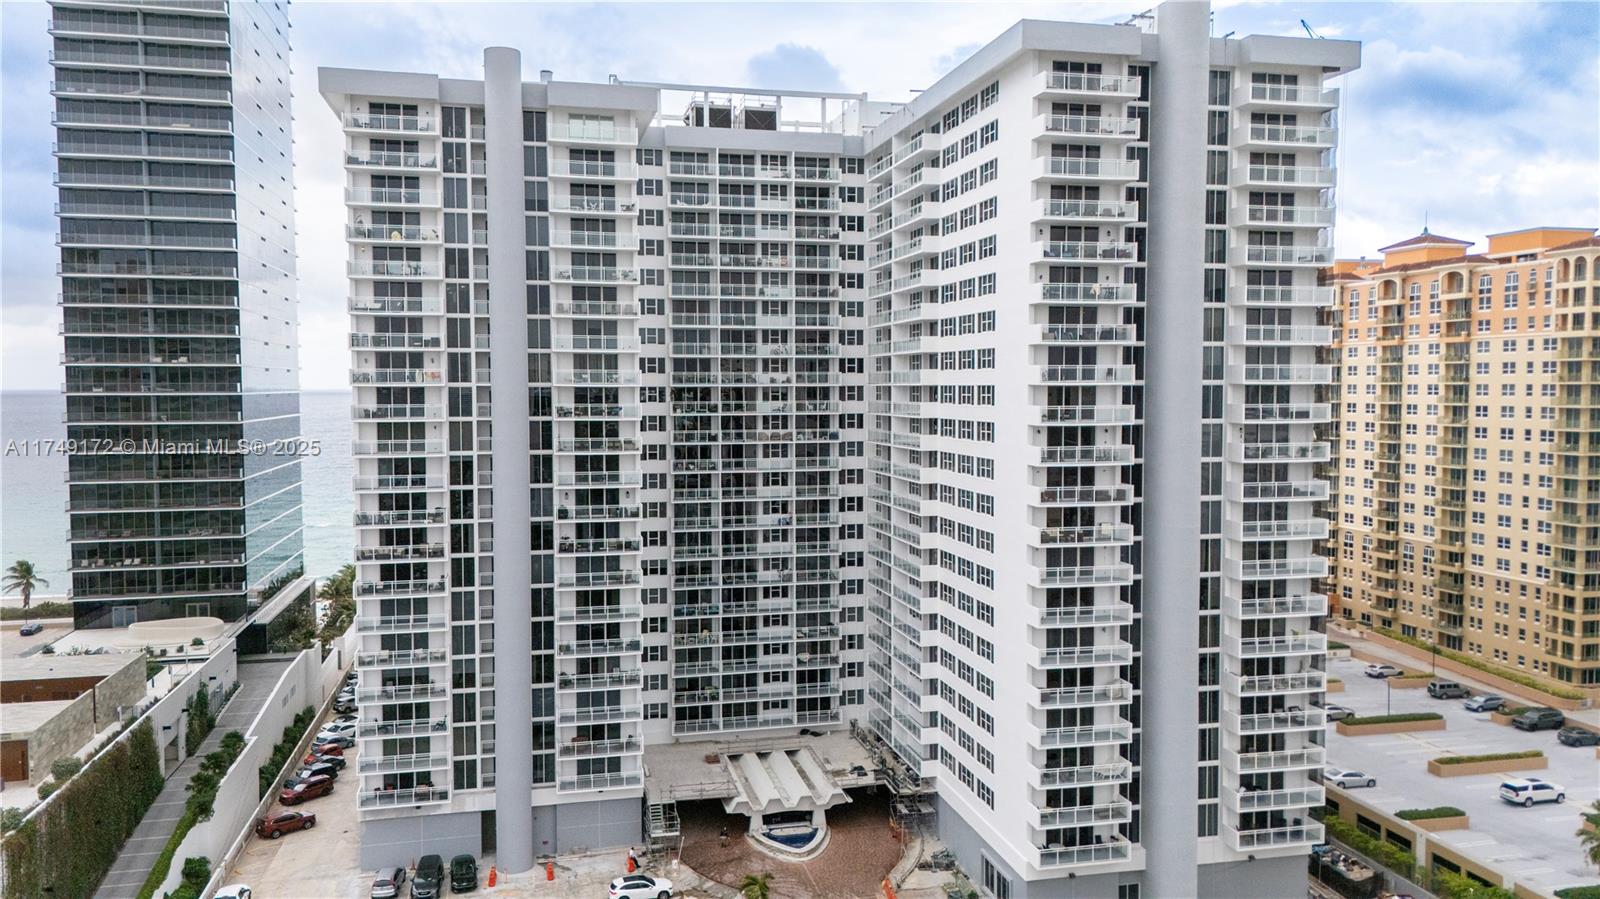
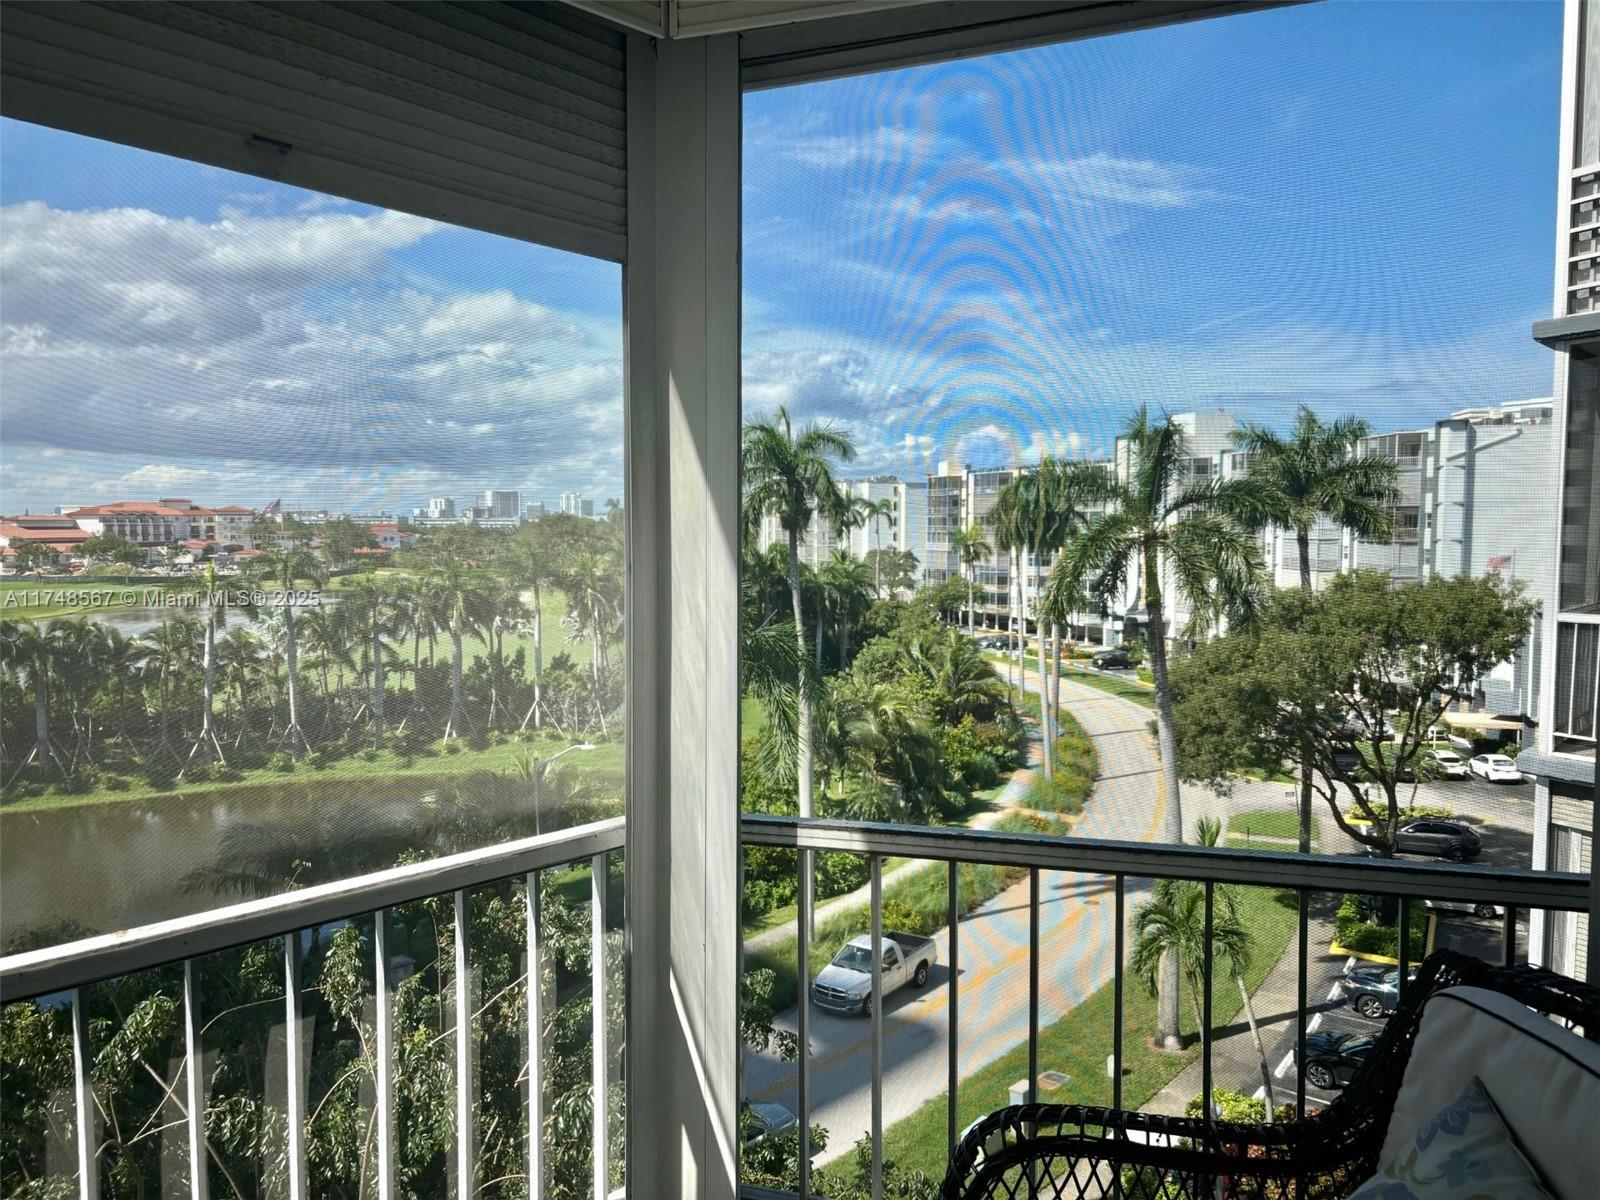
851 Three Islands Blvd, Hallandale Beach, FL 33009
$-485
Cash flow
-12.0%
Cash-on-Cash Return
3.5%
Cap rate
1.1%
Rent to Value Ratio
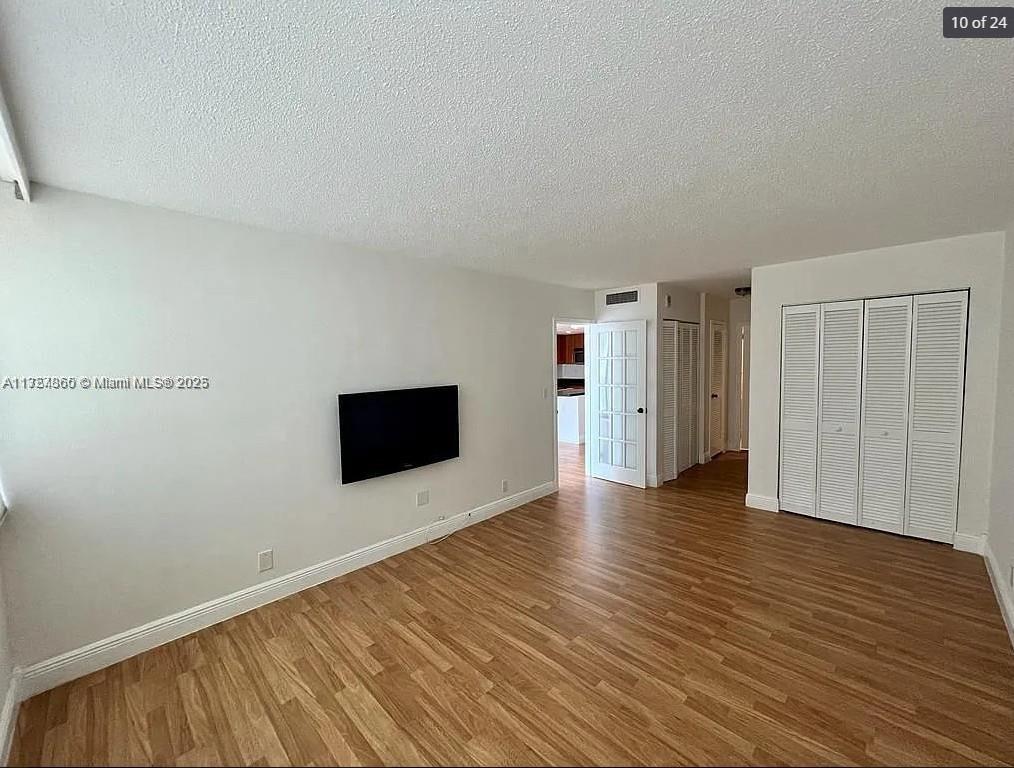
Active
$269,000
2
bds
|
2
ba
|
1,092
sqft
|
built
1972
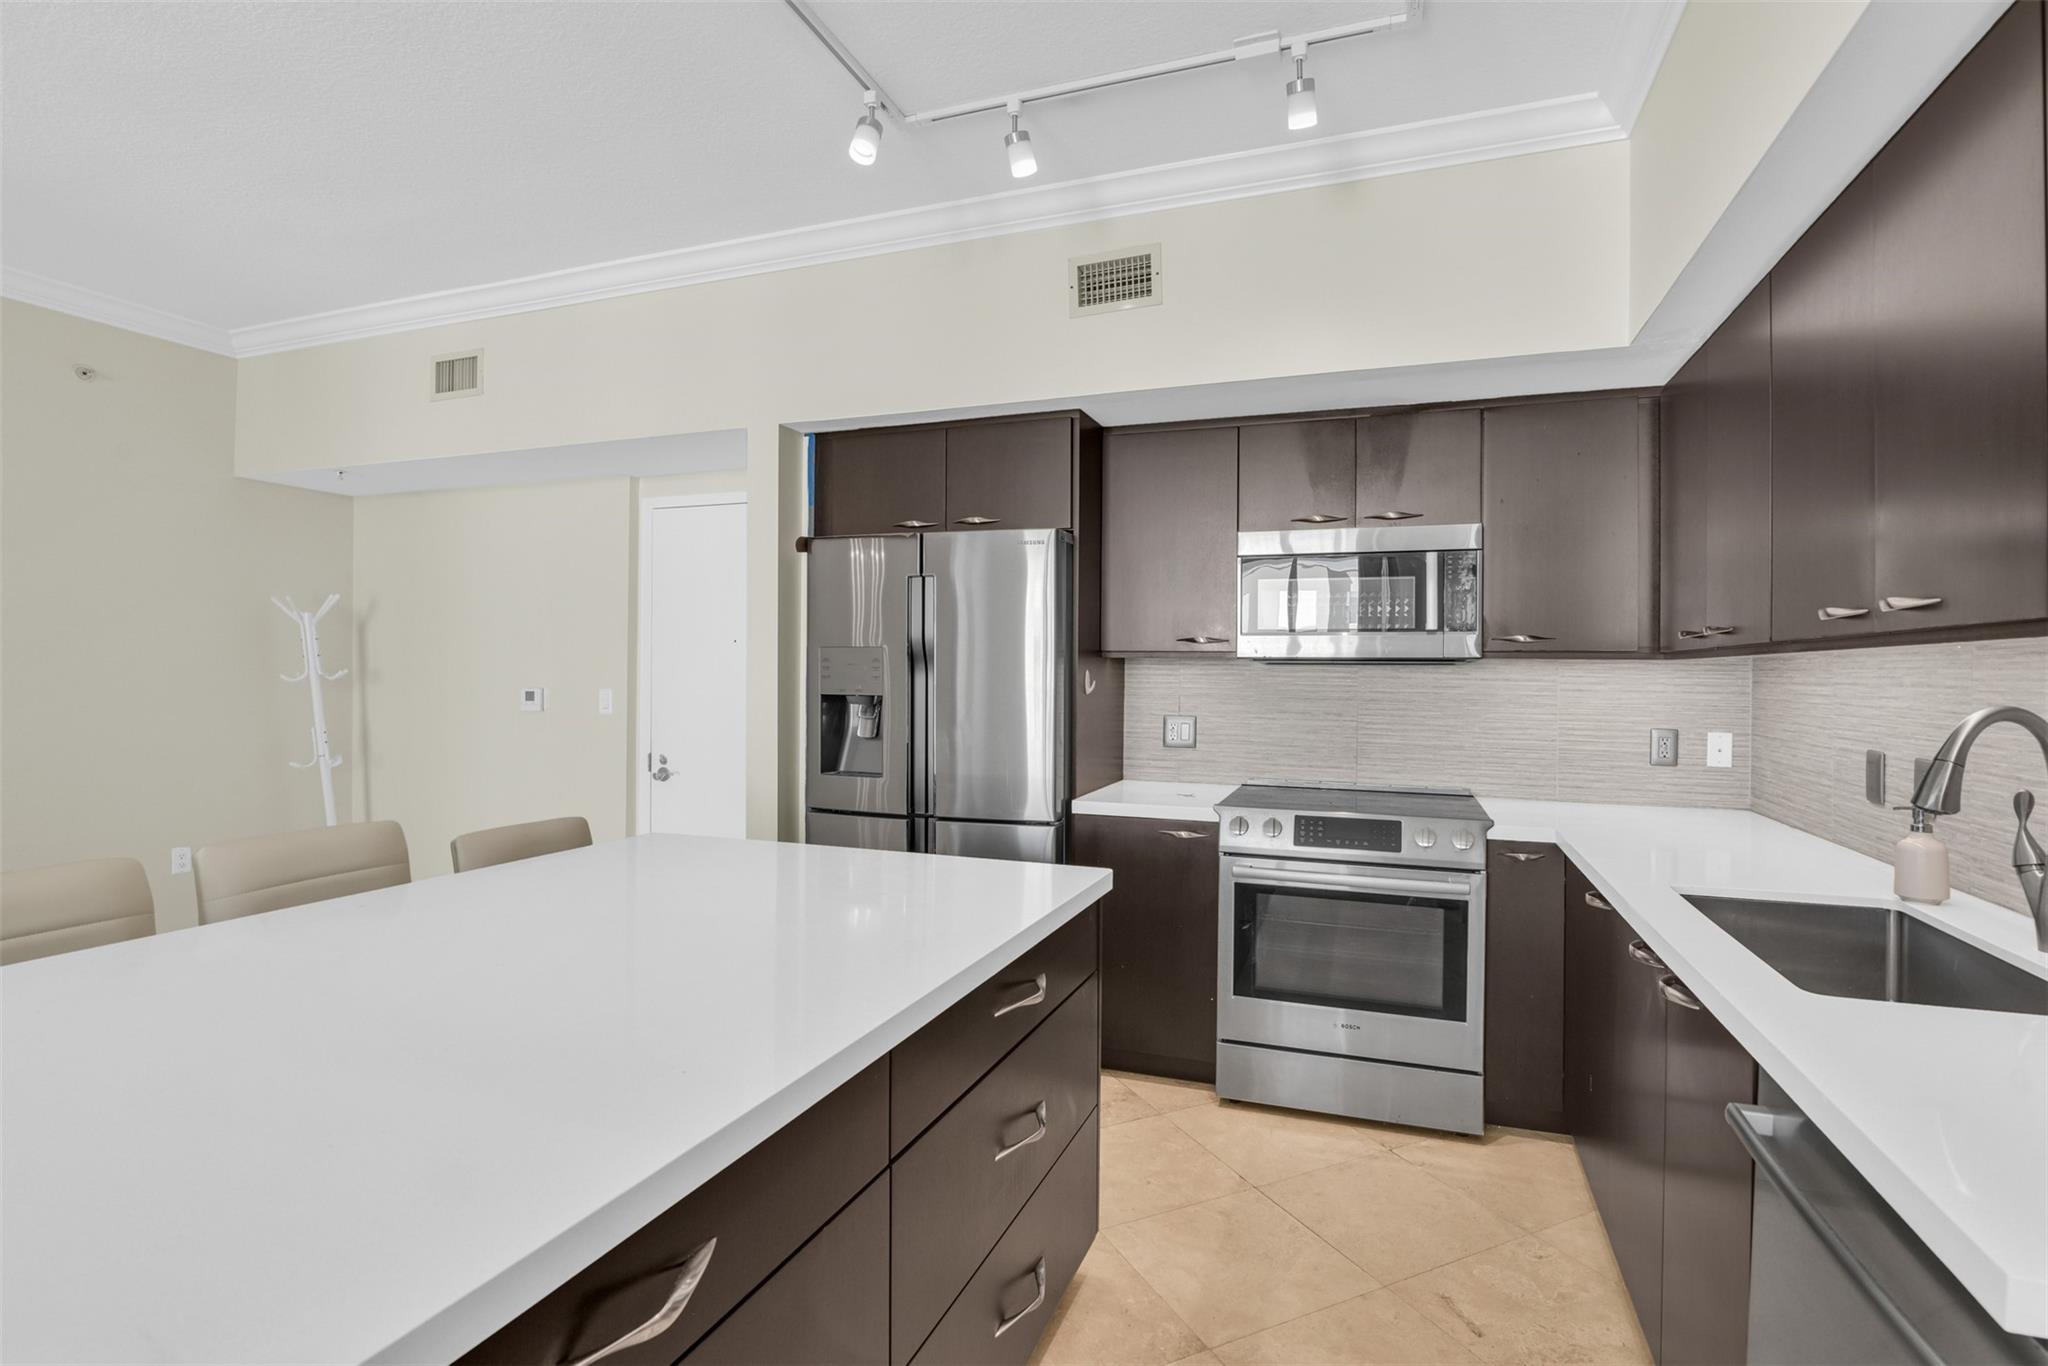
500 NE 12th Ave, Hallandale Beach, FL 33009
$-537
Cash flow
-10.4%
Cash-on-Cash Return
3.9%
Cap rate
0.9%
Rent to Value Ratio
832 out of 930 properties for sale in Hallandale Beach, FL
Limited Results Shown
Create a free account, or log in to reveal all property listings and enjoy the complete experience.
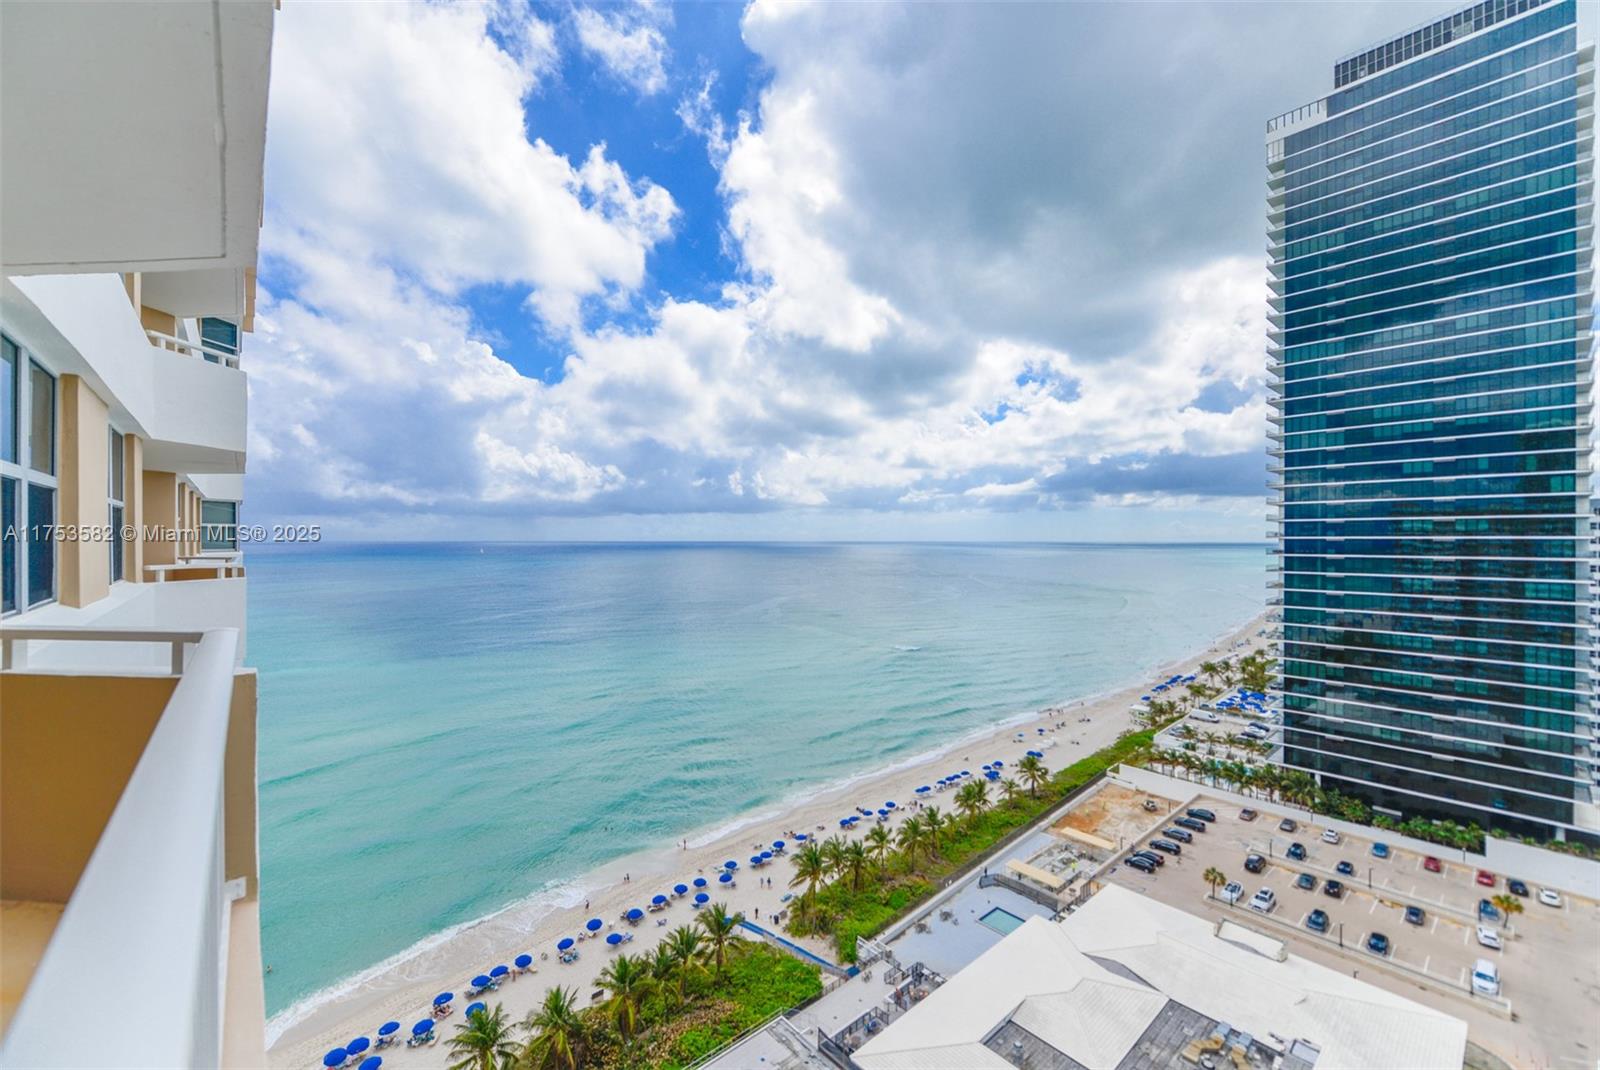
Active
$410,000
2
bds
|
2
ba
|
1,150
sqft
|
built
1970
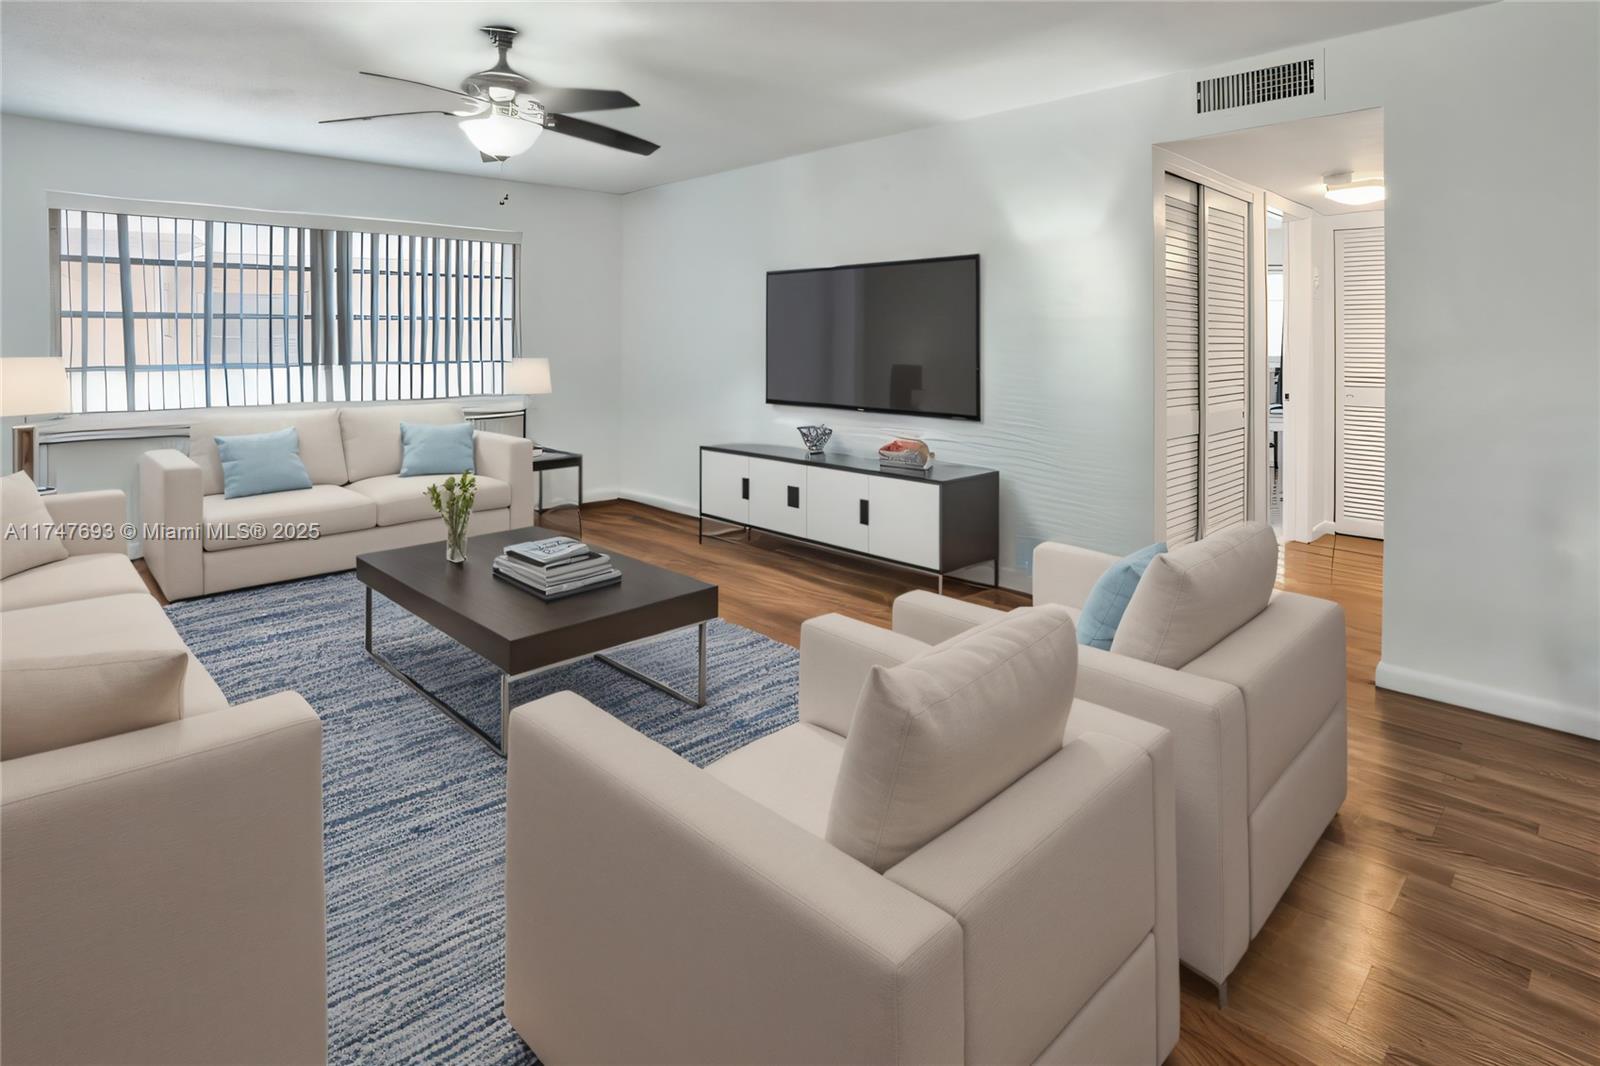
300 Diplomat Pkwy, Hallandale Beach, FL 33009
$-1,082
Cash flow
-13.8%
Cash-on-Cash Return
3.1%
Cap rate
0.9%
Rent to Value Ratio
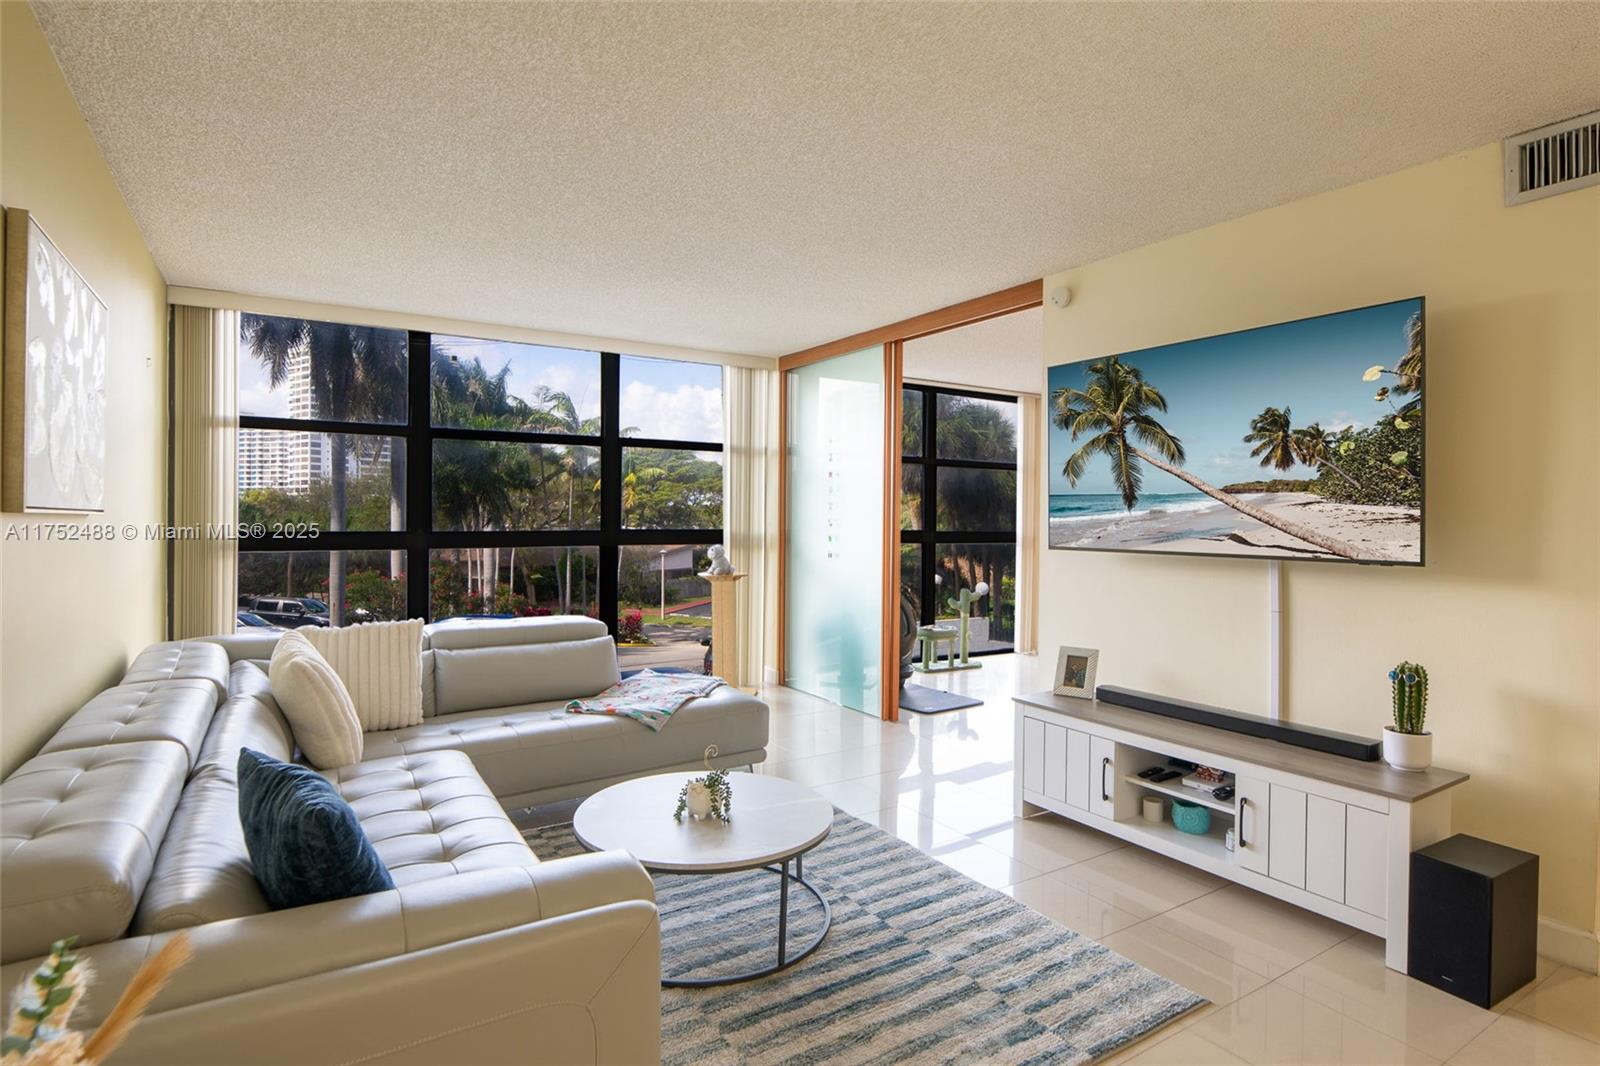
Active
$337,500
2
bds
|
2
ba
|
1,030
sqft
|
built
1963
400 Golden Isles Dr, Hallandale Beach, FL 33009
$-1,206
Cash flow
-18.6%
Cash-on-Cash Return
2.0%
Cap rate
0.8%
Rent to Value Ratio
Active
$1,300,000
2
bds
|
2
ba
|
1,458
sqft
|
built
2006
1830 S Ocean Dr, Hallandale Beach, FL 33009
$-5,054
Cash flow
-20.3%
Cash-on-Cash Return
1.6%
Cap rate
0.5%
Rent to Value Ratio

Active
$550,000
3
bds
|
2
ba
|
1,152
sqft
|
built
1953
30 SW 7th St, Hallandale Beach, FL 33009
$-1,521
Cash flow
-14.4%
Cash-on-Cash Return
3.0%
Cap rate
0.5%
Rent to Value Ratio
Active
$215,000
2
bds
|
2
ba
|
924
sqft
|
built
1974
851 Three Islands Blvd, Hallandale Beach, FL 33009
$-718
Cash flow
-17.4%
Cash-on-Cash Return
2.3%
Cap rate
0.9%
Rent to Value Ratio
Active
$210,000
2
bds
|
2
ba
|
924
sqft
|
built
1974
851 Three Islands Blvd, Hallandale Beach, FL 33009
$-485
Cash flow
-12.0%
Cash-on-Cash Return
3.5%
Cap rate
1.1%
Rent to Value Ratio
Active
$399,000
1
bds
|
2
ba
|
870
sqft
|
built
1972
1985 S Ocean Dr, Hallandale Beach, FL 33009
$-1,671
Cash flow
-21.9%
Cash-on-Cash Return
1.3%
Cap rate
0.6%
Rent to Value Ratio
Active
$198,000
1
bds
|
1
ba
|
820
sqft
|
built
1974
851 Three Islands Blvd, Hallandale Beach, FL 33009
$-716
Cash flow
-18.9%
Cash-on-Cash Return
1.9%
Cap rate
0.9%
Rent to Value Ratio

Active
$725,000
2
bds
|
3
ba
|
1,323
sqft
|
built
2007
1945 S Ocean Dr, Hallandale Beach, FL 33009
$-3,281
Cash flow
-23.6%
Cash-on-Cash Return
0.9%
Cap rate
0.5%
Rent to Value Ratio

Active
$689,000
2
bds
|
2
ba
|
1,312
sqft
|
built
1970
2030 S Ocean Dr, Hallandale Beach, FL 33009
$-2,991
Cash flow
-22.6%
Cash-on-Cash Return
1.1%
Cap rate
0.6%
Rent to Value Ratio
Active
$510,000
1
bds
|
2
ba
|
870
sqft
|
built
1971
1950 S Ocean Dr, Hallandale Beach, FL 33009
$-1,948
Cash flow
-19.9%
Cash-on-Cash Return
1.7%
Cap rate
0.6%
Rent to Value Ratio
Active
$325,000
1
bds
|
1
ba
|
736
sqft
|
built
1970
2030 S Ocean Dr, Hallandale Beach, FL 33009
$-1,575
Cash flow
-25.3%
Cash-on-Cash Return
0.5%
Cap rate
0.8%
Rent to Value Ratio
Active
$650,000
2
bds
|
2
ba
|
870
sqft
|
built
1971
1950 S Ocean Dr, Hallandale Beach, FL 33009
$-2,867
Cash flow
-23.0%
Cash-on-Cash Return
1.0%
Cap rate
0.4%
Rent to Value Ratio
Active
$325,000
2
bds
|
2
ba
|
1,075
sqft
|
built
1981
200 Leslie Dr, Hallandale Beach, FL 33009
$-1,072
Cash flow
-17.2%
Cash-on-Cash Return
2.3%
Cap rate
0.7%
Rent to Value Ratio
Active
$660,000
3
bds
|
2
ba
|
1,350
sqft
|
built
1974
1880 S Ocean Dr, Hallandale Beach, FL 33009
$-2,637
Cash flow
-20.8%
Cash-on-Cash Return
1.5%
Cap rate
0.6%
Rent to Value Ratio
Active
$1,300,000
3
bds
|
3
ba
|
2,000
sqft
|
built
1987
2300 Diana Dr, Hallandale Beach, FL 33009
$-6,288
Cash flow
-25.2%
Cash-on-Cash Return
0.5%
Cap rate
0.3%
Rent to Value Ratio
Active
$500,000
2
bds
|
2
ba
|
1,240
sqft
|
built
1971
1980 S Ocean Dr, Hallandale Beach, FL 33009
$-2,151
Cash flow
-22.4%
Cash-on-Cash Return
1.1%
Cap rate
0.7%
Rent to Value Ratio
Active
$855,000
5
bds
|
3
ba
|
2,639
sqft
|
built
1965
700 NW 9th Ct, Hallandale Beach, FL 33009
$-1,032
Cash flow
-6.3%
Cash-on-Cash Return
4.8%
Cap rate
0.7%
Rent to Value Ratio
Active
$199,000
1
bds
|
1
ba
|
700
sqft
|
built
1980
270 Layne Blvd, Hallandale Beach, FL 33009
$-633
Cash flow
-16.6%
Cash-on-Cash Return
2.5%
Cap rate
0.9%
Rent to Value Ratio
Active
$479,000
2
bds
|
2
ba
|
1,430
sqft
|
built
1976
800 Parkview Dr, Hallandale Beach, FL 33009
$-1,946
Cash flow
-21.2%
Cash-on-Cash Return
1.4%
Cap rate
0.8%
Rent to Value Ratio
Active
$269,000
2
bds
|
2
ba
|
1,092
sqft
|
built
1972
500 NE 12th Ave, Hallandale Beach, FL 33009
$-537
Cash flow
-10.4%
Cash-on-Cash Return
3.9%
Cap rate
0.9%
Rent to Value Ratio
Active
$177,000
1
bds
|
1
ba
|
620
sqft
|
built
1965
467 Golden Isles Dr, Hallandale Beach, FL 33009
$-621
Cash flow
-18.3%
Cash-on-Cash Return
2.1%
Cap rate
1.0%
Rent to Value Ratio
Active
$925,000
3
bds
|
3
ba
|
2,550
sqft
|
built
1980
136 Golden Isles Dr, Hallandale Beach, FL 33009
$-3,107
Cash flow
-17.5%
Cash-on-Cash Return
2.3%
Cap rate
0.6%
Rent to Value Ratio
Active
$1,049,000
2
bds
|
2
ba
|
1,337
sqft
|
built
2006
1830 S Ocean Dr, Hallandale Beach, FL 33009
$-4,619
Cash flow
-23.0%
Cash-on-Cash Return
1.0%
Cap rate
0.5%
Rent to Value Ratio
Active
$319,900
2
bds
|
2
ba
|
1,265
sqft
|
built
1972
427 Golden Isles Dr, Hallandale Beach, FL 33009
$-1,277
Cash flow
-20.8%
Cash-on-Cash Return
1.5%
Cap rate
0.9%
Rent to Value Ratio

Active
$349,000
2
bds
|
2
ba
|
1,360
sqft
|
built
1972
1833 S Ocean Dr, Hallandale Beach, FL 33009
$-1,231
Cash flow
-18.4%
Cash-on-Cash Return
2.1%
Cap rate
0.8%
Rent to Value Ratio

Active
$1,250,000
2
bds
|
2
ba
|
1,458
sqft
|
built
2006
1830 S Ocean Dr, Hallandale Beach, FL 33009
$-5,586
Cash flow
-23.3%
Cash-on-Cash Return
0.9%
Cap rate
0.5%
Rent to Value Ratio

Active
$875,000
3
bds
|
2
ba
|
1,395
sqft
|
built
1954
110 SW 5th St, Hallandale Beach, FL 33009
$-2,076
Cash flow
-12.4%
Cash-on-Cash Return
3.4%
Cap rate
0.6%
Rent to Value Ratio
Active
$200,000
1
bds
|
1
ba
|
545
sqft
|
built
1970
1965 S Ocean Dr, Hallandale Beach, FL 33009
$-799
Cash flow
-20.8%
Cash-on-Cash Return
1.5%
Cap rate
0.9%
Rent to Value Ratio
Active
$499,770
2
bds
|
2
ba
|
1,247
sqft
|
built
1960
731 SW 3rd Ave, Hallandale Beach, FL 33009
$-1,074
Cash flow
-11.2%
Cash-on-Cash Return
3.7%
Cap rate
0.6%
Rent to Value Ratio
Active
$519,000
2
bds
|
2
ba
|
1,248
sqft
|
built
1970
2030 S Ocean Dr, Hallandale Beach, FL 33009
$-2,294
Cash flow
-23.1%
Cash-on-Cash Return
1.0%
Cap rate
0.7%
Rent to Value Ratio
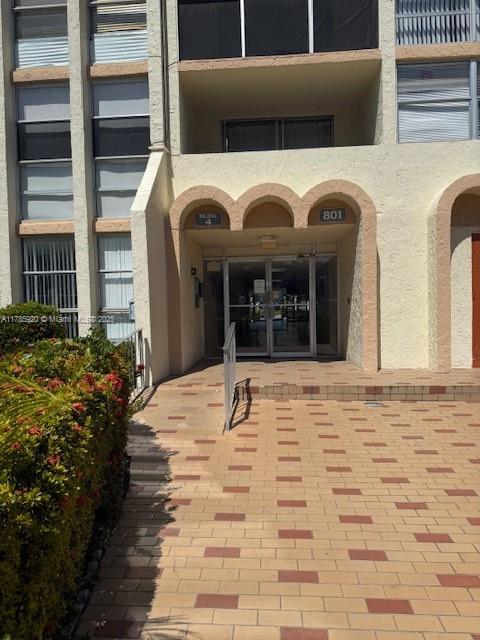
Pending
$230,000
2
bds
|
2
ba
|
924
sqft
|
built
1974
801 Three Islands Blvd, Hallandale Beach, FL 33009
$-642
Cash flow
-14.6%
Cash-on-Cash Return
2.9%
Cap rate
1.0%
Rent to Value Ratio

Active
$4,250,000
4
bds
|
4
ba
|
2,545
sqft
|
built
2023
2000 S Ocean Dr, Hallandale Beach, FL 33009
$-25,580
Cash flow
-31.4%
Cash-on-Cash Return
-0.9%
Cap rate
0.2%
Rent to Value Ratio
Active
$530,000
2
bds
|
2
ba
|
1,360
sqft
|
built
1974
2017 S Ocean Dr, Hallandale Beach, FL 33009
$-1,086
Cash flow
-10.7%
Cash-on-Cash Return
3.8%
Cap rate
0.7%
Rent to Value Ratio

Active
$749,000
1
bds
|
1
ba
|
871
sqft
|
built
2006
1830 S Ocean Dr, Hallandale Beach, FL 33009
$-2,147
Cash flow
-15.0%
Cash-on-Cash Return
2.8%
Cap rate
0.6%
Rent to Value Ratio

Active
$168,000
1
bds
|
1
ba
|
630
sqft
|
built
1964
455 Golden Isles Dr, Hallandale Beach, FL 33009
$-719
Cash flow
-22.3%
Cash-on-Cash Return
1.2%
Cap rate
1.1%
Rent to Value Ratio
Active
$474,900
2
bds
|
2
ba
|
1,270
sqft
|
built
1974
2049 S Ocean Dr, Hallandale Beach, FL 33009
$-946
Cash flow
-10.4%
Cash-on-Cash Return
3.9%
Cap rate
0.7%
Rent to Value Ratio
Active
$288,000
2
bds
|
2
ba
|
1,150
sqft
|
built
1970
200 Diplomat Pkwy, Hallandale Beach, FL 33009
$-1,110
Cash flow
-20.1%
Cash-on-Cash Return
1.7%
Cap rate
0.9%
Rent to Value Ratio
Active
$645,000
3
bds
|
3
ba
|
1,738
sqft
|
built
2007
1745 E Hallandale Beach Blvd, Hallandale Beach, FL 33009
$-2,341
Cash flow
-18.9%
Cash-on-Cash Return
1.9%
Cap rate
0.8%
Rent to Value Ratio
Active
$257,777
2
bds
|
2
ba
|
1,168
sqft
|
built
1967
180 NE 12th Ave, Hallandale Beach, FL 33009
$-679
Cash flow
-13.7%
Cash-on-Cash Return
3.1%
Cap rate
1.0%
Rent to Value Ratio