Hartland, WI Investment Properties for Sale
Browse homes for sale and investment properties in Hartland, WI. Refine your search by price, property type, or more.
Best cash flowing properties in Hartland, WI
Active
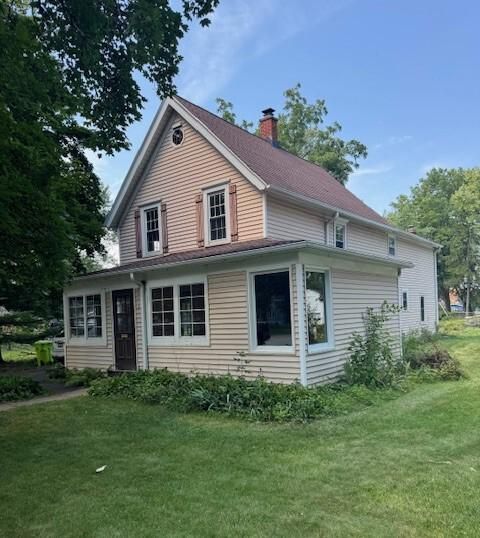
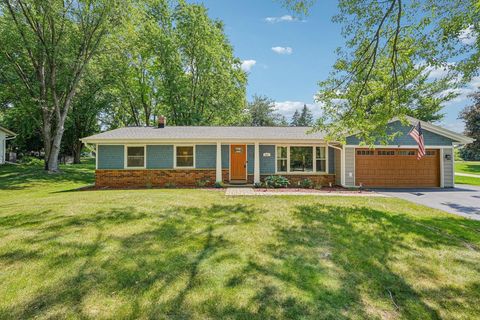
$299,900
4
bds
|
1
ba
|
1,924
sqft
|
built
1890
552 E Capitol Dr, Hartland, WI 53029
$-14
Cash flow
-0.2%
Cash-on-Cash Return
6.1%
Cap rate
0.9%
Rent to Value Ratio
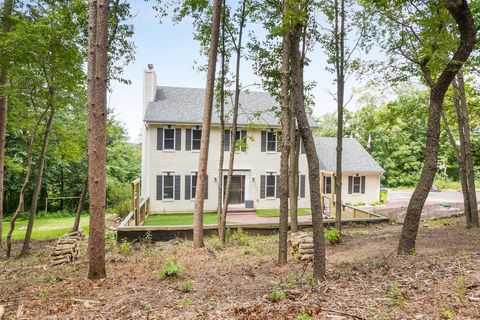
Active
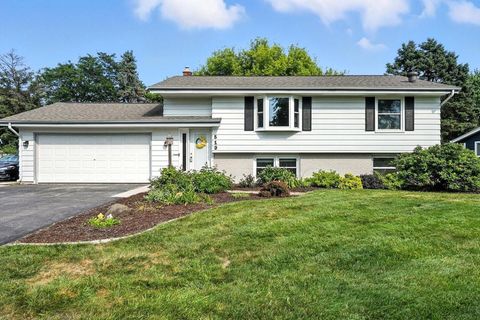
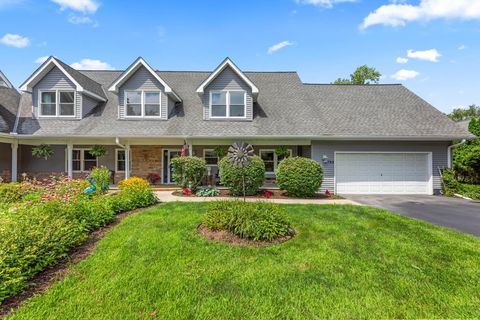
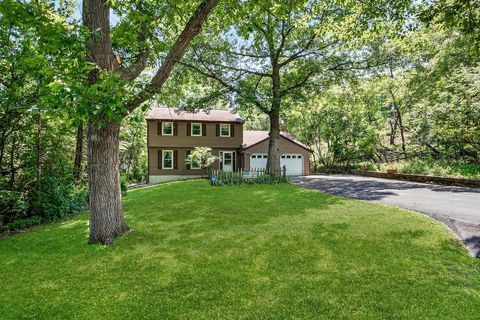
$399,900
3
bds
|
2
ba
|
1,746
sqft
|
built
1978
519 Buckingham Way, Hartland, WI 53029
$-480
Cash flow
-6.3%
Cash-on-Cash Return
4.7%
Cap rate
0.7%
Rent to Value Ratio
14 out of 15 properties for sale in Hartland, WI
Limited Results Shown
Create a free account, or log in to reveal all property listings and enjoy the complete experience.
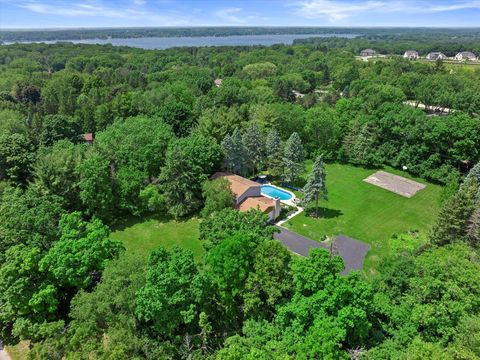
Active
$695,000
4
bds
|
2
ba
|
3,162
sqft
|
built
1969
2925 Meadow Ln, Hartland, WI 53029
$-2,582
Cash flow
-19.4%
Cash-on-Cash Return
1.7%
Cap rate
0.3%
Rent to Value Ratio
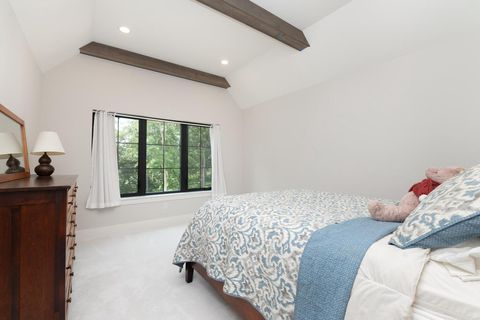
Active
$7,800,000
5
bds
|
4
ba
|
5,755
sqft
|
built
2023
4779 N Pine Meadows Ln, Hartland, WI 53029
$-38,992
Cash flow
-26.1%
Cash-on-Cash Return
0.1%
Cap rate
0.0%
Rent to Value Ratio
Active
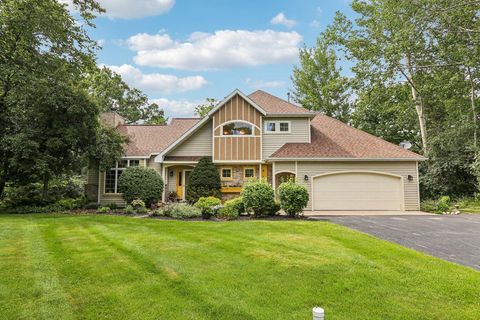
$837,900
4
bds
|
3
ba
|
2,668
sqft
|
built
1988
1722 Journeys Dr, Hartland, WI 53029
$-2,697
Cash flow
-16.8%
Cash-on-Cash Return
2.3%
Cap rate
0.3%
Rent to Value Ratio
Active
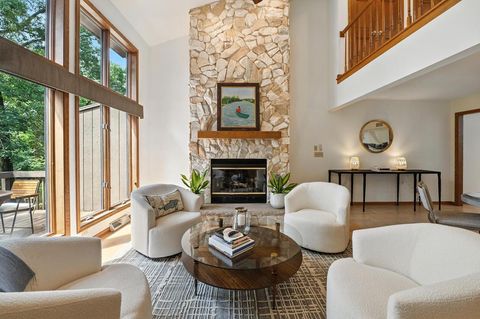
$624,900
3
bds
|
2.5
ba
|
1,956
sqft
|
built
1978
2105 Nagawicka Rd, Hartland, WI 53029
$-1,617
Cash flow
-13.5%
Cash-on-Cash Return
3.0%
Cap rate
0.4%
Rent to Value Ratio
Active
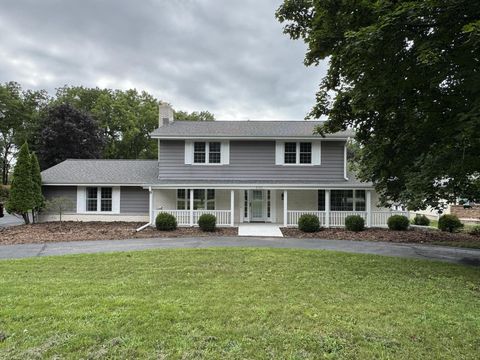
$474,900
4
bds
|
2
ba
|
1,992
sqft
|
built
1978
733 Cardiff Ct, Hartland, WI 53029
$-753
Cash flow
-8.3%
Cash-on-Cash Return
4.2%
Cap rate
0.6%
Rent to Value Ratio
Active
$1,249,900
3
bds
|
1
ba
|
1,160
sqft
|
built
1930
W329N6495 Forest Dr, Hartland, WI 53029
$-5,340
Cash flow
-22.3%
Cash-on-Cash Return
1.0%
Cap rate
0.2%
Rent to Value Ratio
Active
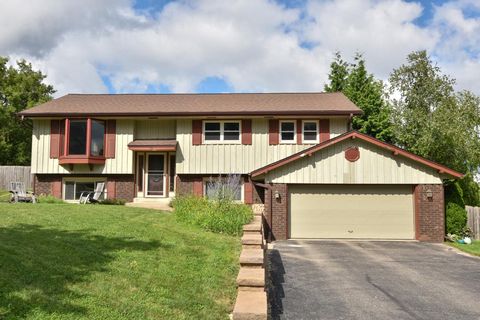
$479,900
4
bds
|
2
ba
|
2,383
sqft
|
built
1976
N53W30509 Arrowhead Dr, Hartland, WI 53029
$-1,518
Cash flow
-16.5%
Cash-on-Cash Return
2.4%
Cap rate
0.4%
Rent to Value Ratio
Active
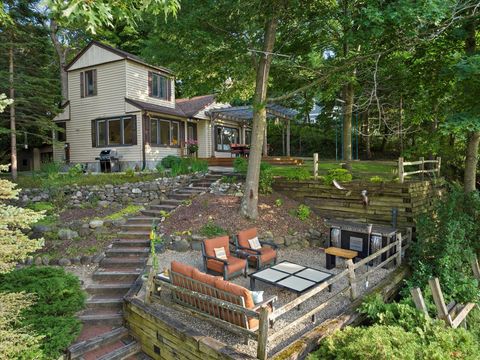
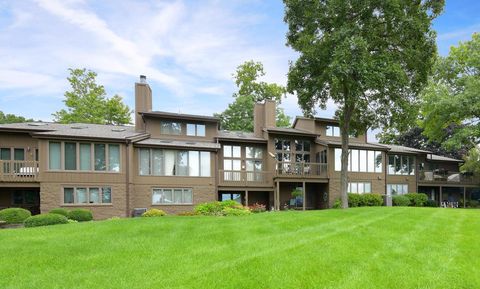
$529,900
3
bds
|
3
ba
|
2,176
sqft
|
built
1992
N67W32462 Wildwood Point Rd, Hartland, WI 53029
$-1,571
Cash flow
-15.5%
Cash-on-Cash Return
2.6%
Cap rate
0.4%
Rent to Value Ratio
Active
$814,900
2
bds
|
3
ba
|
2,792
sqft
|
built
1991
3826 Nagawicka Shores Dr, Hartland, WI 53029
$-3,231
Cash flow
-20.7%
Cash-on-Cash Return
1.4%
Cap rate
0.3%
Rent to Value Ratio
Active
$1,050,000
3
bds
|
3.5
ba
|
3,098
sqft
|
built
1988
3757 Nagawicka Shores Dr, Hartland, WI 53029
$-4,285
Cash flow
-21.3%
Cash-on-Cash Return
1.3%
Cap rate
0.2%
Rent to Value Ratio
Active
$474,900
3
bds
|
2
ba
|
2,250
sqft
|
built
1974
507 Oxford Dr, Hartland, WI 53029
$-1,109
Cash flow
-12.2%
Cash-on-Cash Return
3.3%
Cap rate
0.5%
Rent to Value Ratio
Active
$839,900
4
bds
|
3
ba
|
2,194
sqft
|
built
2002
487 Schraufnagel Dr, Hartland, WI 53029
$-2,004
Cash flow
-12.4%
Cash-on-Cash Return
3.3%
Cap rate
0.5%
Rent to Value Ratio