Cook County Investment Properties for Sale
Browse homes for sale and investment properties in Cook County. Refine your search by price, property type, or more.
Best cash flowing properties in Cook County
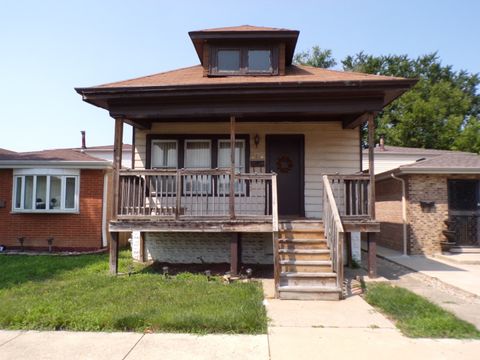
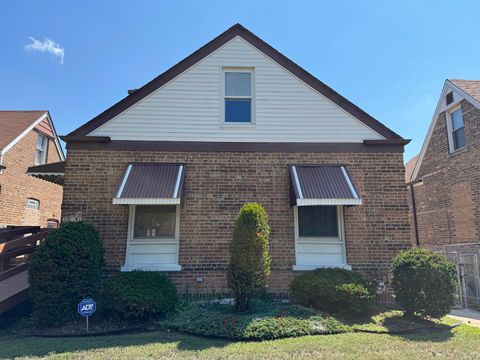
Active
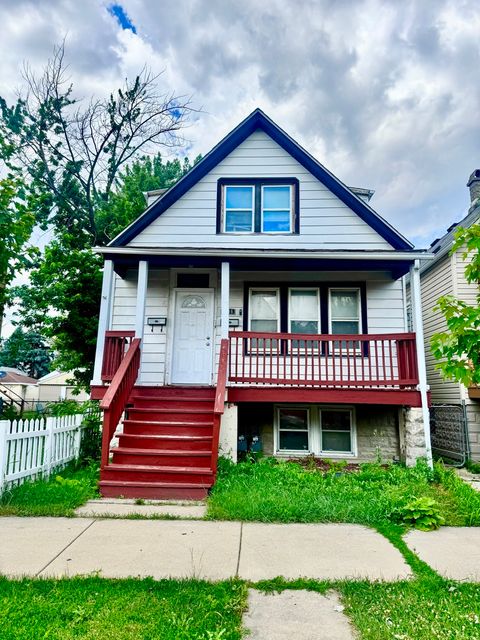
$81,100
2
bds
|
1
ba
|
1,040
sqft
|
built
1921
2112 W 72nd Pl, Chicago, IL 60636
$917
Cash flow
59.0%
Cash-on-Cash Return
19.3%
Cap rate
2.5%
Rent to Value Ratio
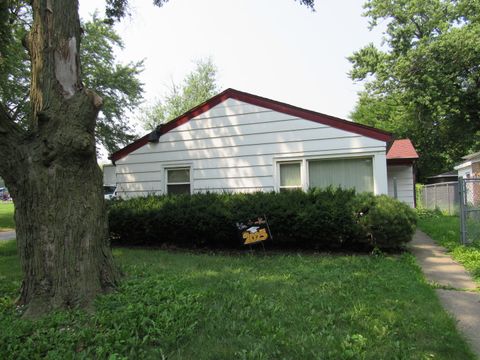
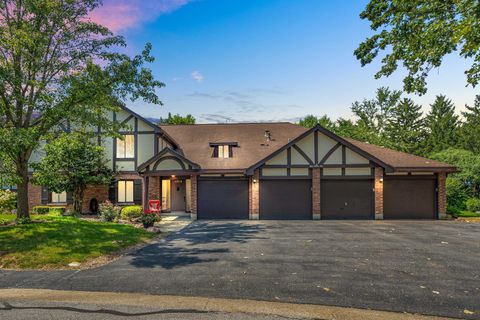
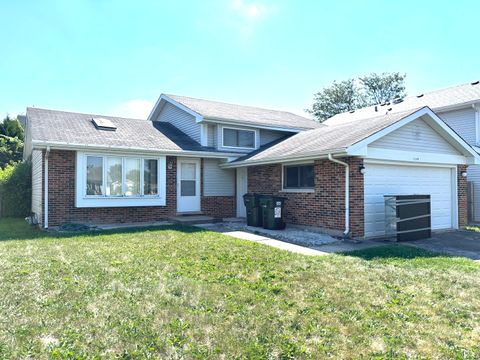
Active
$129,000
4
bds
|
1
ba
|
1,279
sqft
|
built
1952
16840 Bulger Ave, Hazel Crest, IL 60429
$779
Cash flow
31.5%
Cash-on-Cash Return
12.9%
Cap rate
1.9%
Rent to Value Ratio
5,327 out of 6,172 properties for sale in Cook County
Limited Results Shown
Create a free account, or log in to reveal all property listings and enjoy the complete experience.
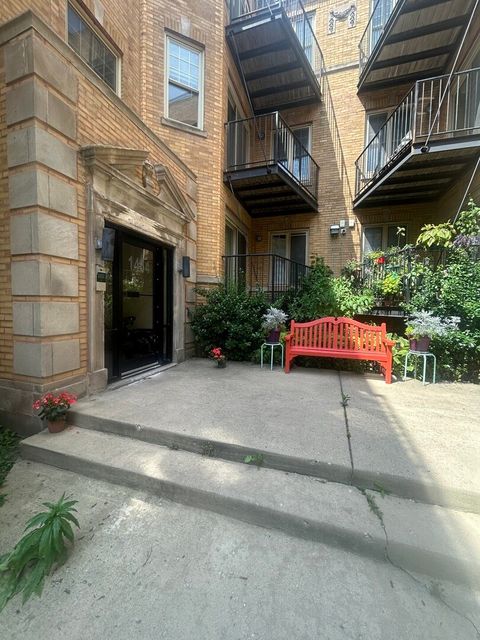
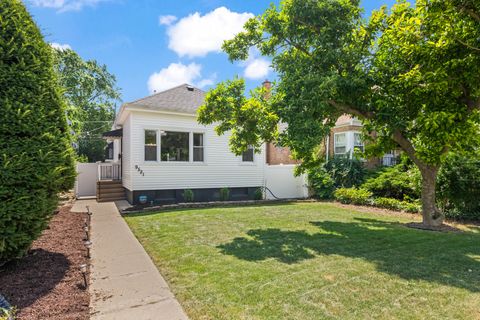
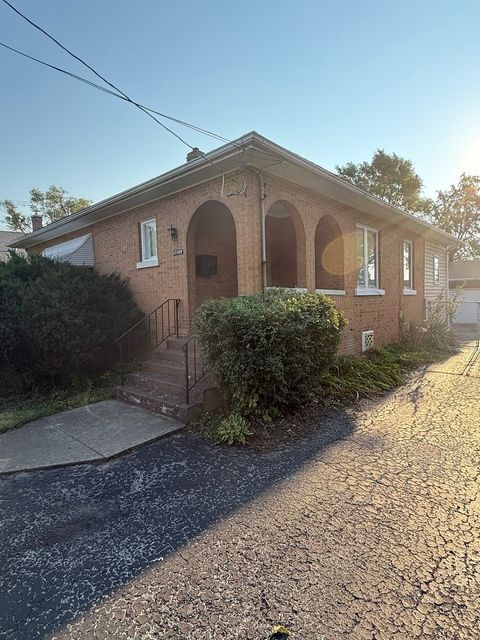
Active
$95,000
2
bds
|
1
ba
|
900
sqft
|
built
1921
1464 E 69th St, Chicago, IL 60637
$618
Cash flow
33.9%
Cash-on-Cash Return
13.5%
Cap rate
1.7%
Rent to Value Ratio
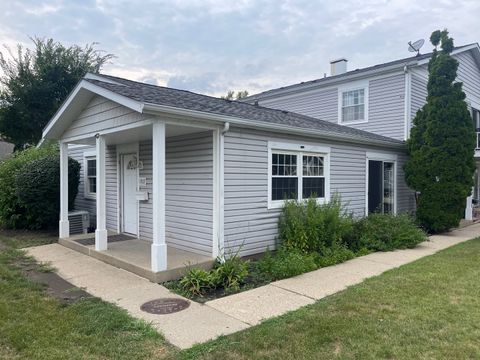
Active
$235,000
3
bds
|
1
ba
|
1,175
sqft
|
built
1973
1317 Wye Ct, Wheeling, IL 60090
$-185
Cash flow
-4.1%
Cash-on-Cash Return
4.7%
Cap rate
1.0%
Rent to Value Ratio
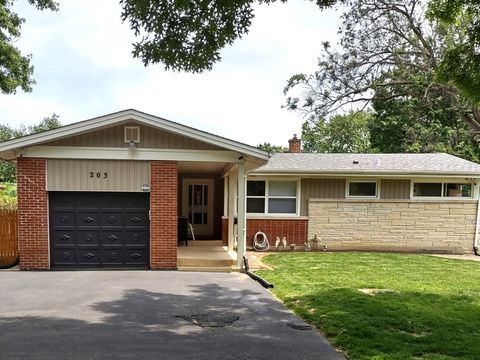
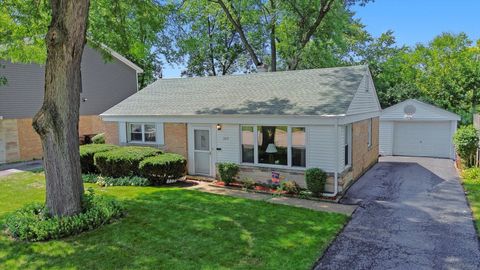
Active
$169,900
3
bds
|
2
ba
|
1,800
sqft
|
built
1964
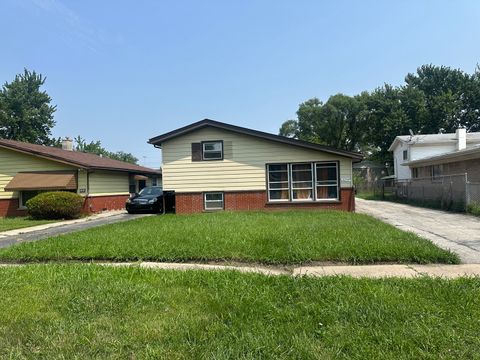
16333 Justine St, Markham, IL 60428
$486
Cash flow
14.9%
Cash-on-Cash Return
9.1%
Cap rate
1.5%
Rent to Value Ratio
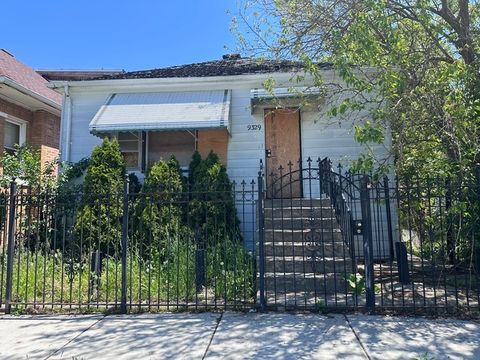
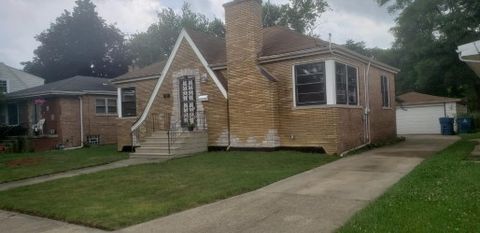
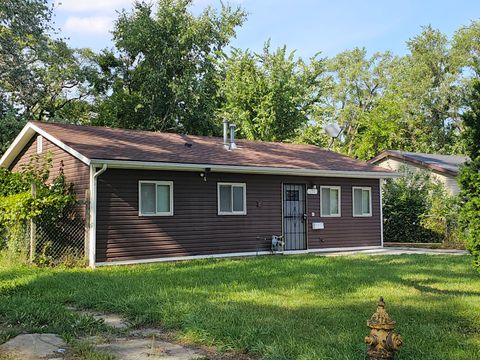
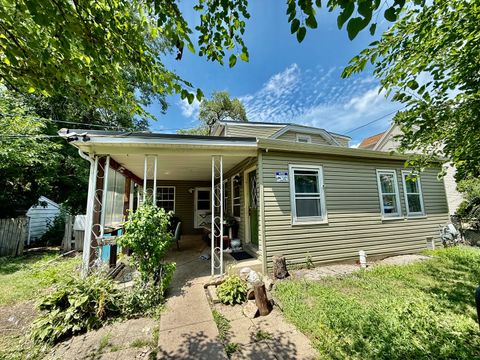
Active
$75,900
3
bds
|
2
ba
|
2,124
sqft
|
built
1922
9329 S Wentworth Ave, Chicago, IL 60620
$457
Cash flow
31.4%
Cash-on-Cash Return
12.9%
Cap rate
1.8%
Rent to Value Ratio
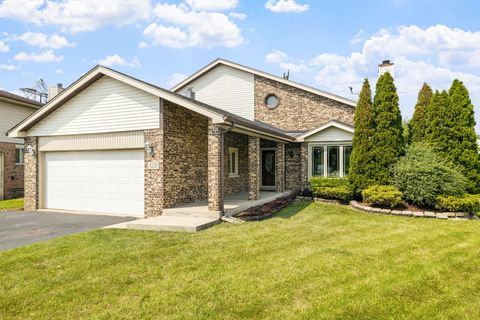
Active
$284,900
3
bds
|
2
ba
|
1,500
sqft
|
built
1955
6621 183rd St, Tinley Park, IL 60477
$-130
Cash flow
-2.4%
Cash-on-Cash Return
5.1%
Cap rate
1.0%
Rent to Value Ratio
Active
$349,900
3
bds
|
3
ba
|
1,972
sqft
|
built
1988
21191 Lisa Ln, Steger, IL 60475
$-149
Cash flow
-2.2%
Cash-on-Cash Return
5.2%
Cap rate
0.8%
Rent to Value Ratio
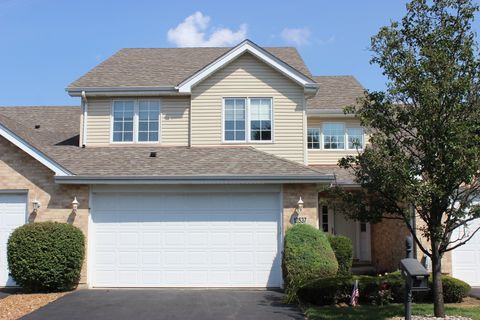
Active
$349,900
2
bds
|
3
ba
|
2,200
sqft
|
built
2002
13537 Latrobe Ave, Crestwood, IL 60418
$-893
Cash flow
-13.3%
Cash-on-Cash Return
2.6%
Cap rate
0.6%
Rent to Value Ratio
Active
$250,000
2
bds
|
1
ba
|
1,000
sqft
|
built
1970
1491 Quaker Ln, Prospect Heights, IL 60070
$-355
Cash flow
-7.4%
Cash-on-Cash Return
4.0%
Cap rate
0.7%
Rent to Value Ratio
Active
$449,000
2
bds
|
2
ba
|
1,300
sqft
|
built
1994
1030 Arbor Ln, Northfield, IL 60093
$-1,231
Cash flow
-14.3%
Cash-on-Cash Return
2.4%
Cap rate
0.6%
Rent to Value Ratio
Active
$275,000
3
bds
|
2
ba
|
1,500
sqft
|
built
1963
16314 Woodlawn East Ave, South Holland, IL 60473
$-135
Cash flow
-2.6%
Cash-on-Cash Return
5.1%
Cap rate
1.0%
Rent to Value Ratio
Active
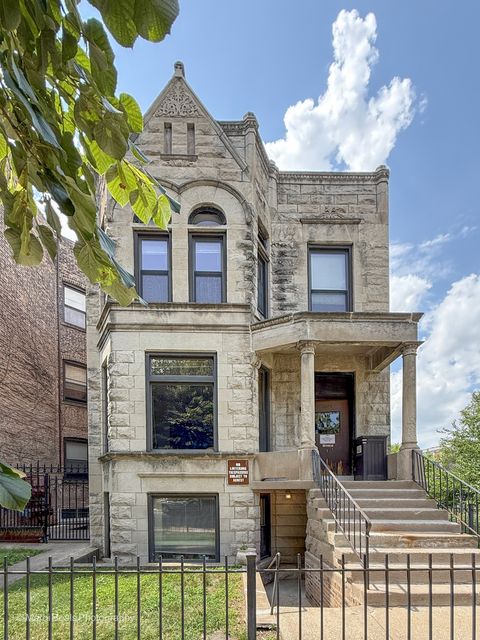
$729,000
6
bds
|
3
ba
|
0
sqft
|
built
1888
6224 S Greenwood Ave, Chicago, IL 60637
$-2,134
Cash flow
-15.3%
Cash-on-Cash Return
2.2%
Cap rate
0.3%
Rent to Value Ratio
Active
$145,000
1
bds
|
1
ba
|
0
sqft
|
built
1926
2551 N Laramie Ave, Chicago, IL 60639
$-123
Cash flow
-4.4%
Cash-on-Cash Return
4.7%
Cap rate
0.8%
Rent to Value Ratio
Active
$549,900
4
bds
|
4
ba
|
2,662
sqft
|
built
1959
708 S Edgewood Ln, Mount Prospect, IL 60056
$-946
Cash flow
-9.0%
Cash-on-Cash Return
3.6%
Cap rate
0.6%
Rent to Value Ratio
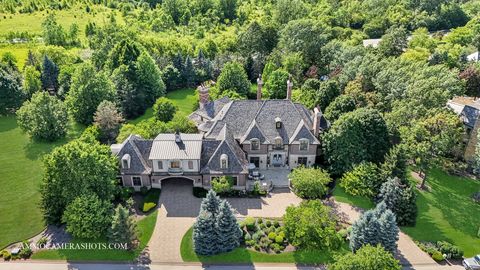
Active
$3,995,000
5
bds
|
7
ba
|
11,600
sqft
|
built
2007
8 Brooke Ln, Barrington, IL 60010
$-19,654
Cash flow
-25.7%
Cash-on-Cash Return
-0.2%
Cap rate
0.1%
Rent to Value Ratio
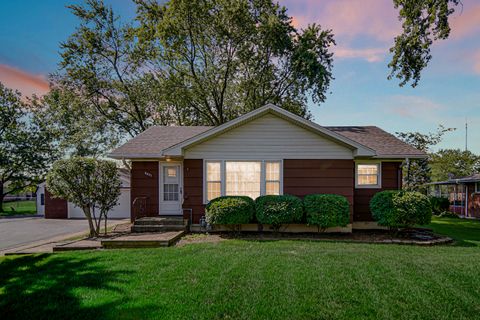
Active
$205,000
4
bds
|
1
ba
|
1,140
sqft
|
built
1944
10941 S Avenue C, Chicago, IL 60617
$336
Cash flow
8.6%
Cash-on-Cash Return
7.6%
Cap rate
1.0%
Rent to Value Ratio
Active
$289,000
3
bds
|
2
ba
|
0
sqft
|
built
1974
11210 S Cherry Ct, Palos Hills, IL 60465
$-612
Cash flow
-11.0%
Cash-on-Cash Return
3.1%
Cap rate
0.8%
Rent to Value Ratio
Active
$325,000
2
bds
|
1
ba
|
940
sqft
|
built
1944
9521 Garfield Ave, Brookfield, IL 60513
$-606
Cash flow
-9.7%
Cash-on-Cash Return
3.4%
Cap rate
0.7%
Rent to Value Ratio
Active
$250,000
2
bds
|
2
ba
|
972
sqft
|
built
1957
360 Streamside Dr, Harvey, IL 60426
$-417
Cash flow
-8.7%
Cash-on-Cash Return
3.7%
Cap rate
0.8%
Rent to Value Ratio
Active
$609,000
3
bds
|
3
ba
|
2,385
sqft
|
built
1938
10057 S Bell Ave, Chicago, IL 60643
$-710
Cash flow
-6.1%
Cash-on-Cash Return
4.3%
Cap rate
0.7%
Rent to Value Ratio
Active
$345,900
3
bds
|
2
ba
|
2,200
sqft
|
built
1952
1502 N 34th Ave, Melrose Park, IL 60160
$-43
Cash flow
-0.6%
Cash-on-Cash Return
5.5%
Cap rate
0.8%
Rent to Value Ratio
Active
$369,900
4
bds
|
2
ba
|
2,008
sqft
|
built
1964
6887 Meadowbrook Ln, Hanover Park, IL 60133
$-414
Cash flow
-5.8%
Cash-on-Cash Return
4.3%
Cap rate
0.7%
Rent to Value Ratio
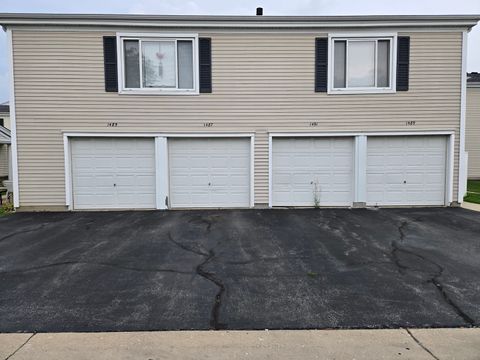
Active
$155,900
2
bds
|
2
ba
|
1,050
sqft
|
built
1962
1117 Leavitt Ave, Flossmoor, IL 60422
$-204
Cash flow
-6.8%
Cash-on-Cash Return
4.1%
Cap rate
1.0%
Rent to Value Ratio
Active
$329,000
1
bds
|
1
ba
|
875
sqft
|
built
2000
330 N Jefferson St, Chicago, IL 60661
$-1,127
Cash flow
-17.9%
Cash-on-Cash Return
1.6%
Cap rate
0.8%
Rent to Value Ratio
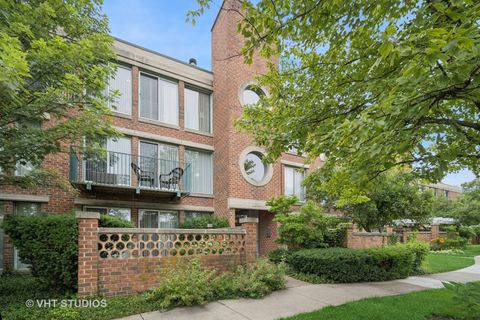
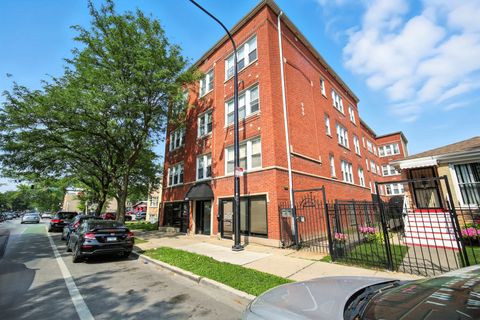
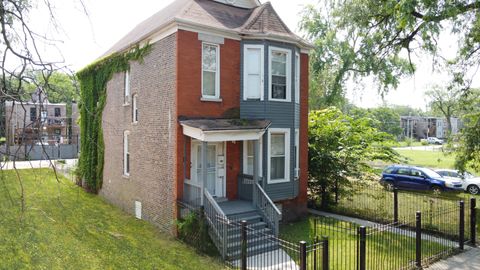
Active
$695,500
3
bds
|
2
ba
|
1,119
sqft
|
built
1902
2343 N Lawndale Ave, Chicago, IL 60647
$-1,888
Cash flow
-14.2%
Cash-on-Cash Return
2.4%
Cap rate
0.4%
Rent to Value Ratio
Active
$248,000
3
bds
|
2
ba
|
1,136
sqft
|
built
1961
808 E 165th St, South Holland, IL 60473
$80
Cash flow
1.7%
Cash-on-Cash Return
6.1%
Cap rate
1.1%
Rent to Value Ratio
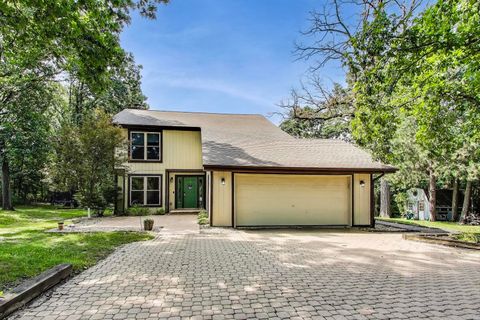
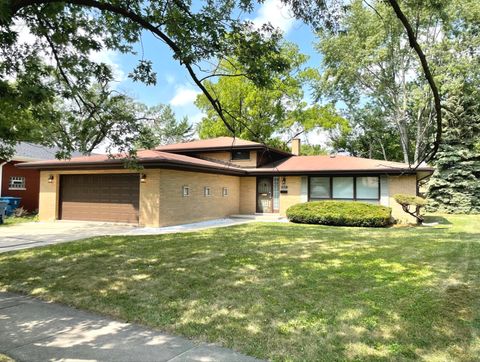
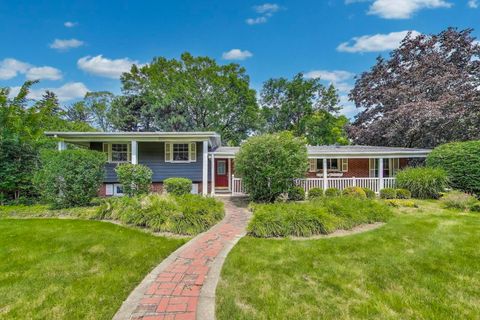
Active
$449,000
4
bds
|
3
ba
|
2,059
sqft
|
built
1950
15 Ridge Rd, Lemont, IL 60439
$-936
Cash flow
-10.9%
Cash-on-Cash Return
3.2%
Cap rate
0.5%
Rent to Value Ratio
Active
$330,000
5
bds
|
2
ba
|
0
sqft
|
built
1908
4916 W 29th St, Cicero, IL 60804
$-914
Cash flow
-14.5%
Cash-on-Cash Return
2.4%
Cap rate
0.5%
Rent to Value Ratio
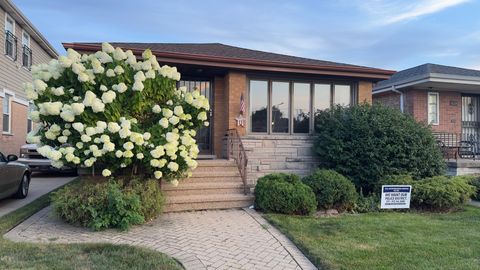
Active
$560,000
3
bds
|
3
ba
|
1,424
sqft
|
built
1956
203 S See Gwun Ave, Mount Prospect, IL 60056
$-1,059
Cash flow
-9.9%
Cash-on-Cash Return
3.4%
Cap rate
0.6%
Rent to Value Ratio
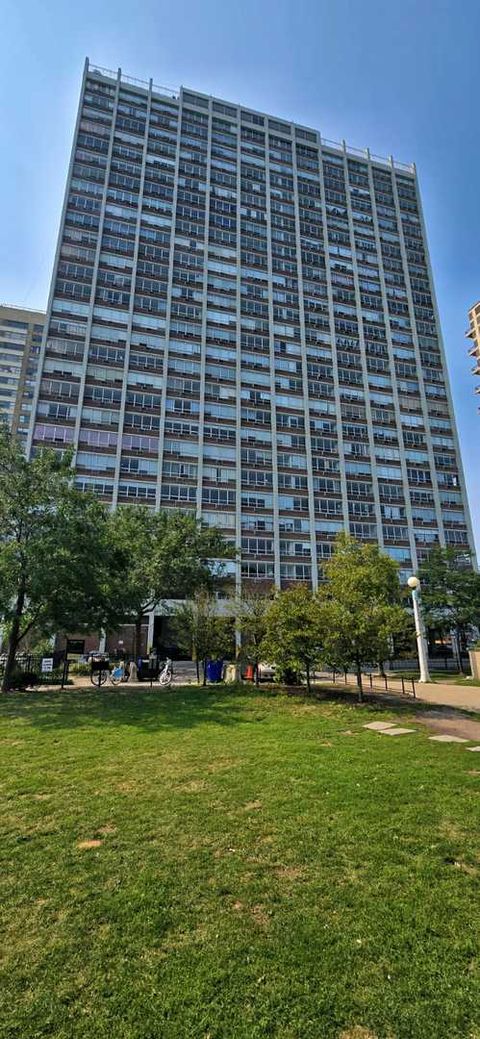
Active
$119,900
bds
|
1
ba
|
500
sqft
|
built
1932
6171 N Sheridan Rd, Chicago, IL 60660
$106
Cash flow
4.6%
Cash-on-Cash Return
6.7%
Cap rate
1.5%
Rent to Value Ratio
Active
$319,999
3
bds
|
1
ba
|
1,100
sqft
|
built
1962
6225 W 63rd Pl, Chicago, IL 60638
$-75
Cash flow
-1.2%
Cash-on-Cash Return
5.4%
Cap rate
0.7%
Rent to Value Ratio
Active
$374,900
3
bds
|
3
ba
|
1,972
sqft
|
built
1987
11231 S Lamon Ave, Alsip, IL 60803
$-579
Cash flow
-8.1%
Cash-on-Cash Return
3.8%
Cap rate
0.7%
Rent to Value Ratio
Active
$99,800
3
bds
|
1
ba
|
852
sqft
|
built
1957
171 W 158th Pl, Harvey, IL 60426
$508
Cash flow
26.6%
Cash-on-Cash Return
11.8%
Cap rate
1.6%
Rent to Value Ratio
Active
$260,000
6
bds
|
2
ba
|
0
sqft
|
built
1893
5641 S Morgan St, Chicago, IL 60621
$-196
Cash flow
-3.9%
Cash-on-Cash Return
4.8%
Cap rate
0.6%
Rent to Value Ratio

Active
$174,900
3
bds
|
2
ba
|
1,236
sqft
|
built
1922
7206 S Fairfield Ave, Chicago, IL 60629
$548
Cash flow
16.3%
Cash-on-Cash Return
9.4%
Cap rate
1.3%
Rent to Value Ratio
Active
$125,000
2
bds
|
1
ba
|
949
sqft
|
built
1951
320 Oswego St, Park Forest, IL 60466
$343
Cash flow
14.3%
Cash-on-Cash Return
9.0%
Cap rate
1.4%
Rent to Value Ratio
Active
$269,900
4
bds
|
3
ba
|
1,170
sqft
|
built
1943
2118 Fairfield Ave, Melrose Park, IL 60164
$-79
Cash flow
-1.5%
Cash-on-Cash Return
5.3%
Cap rate
0.9%
Rent to Value Ratio
Active
$225,000
1
bds
|
1
ba
|
990
sqft
|
built
1928
17109 67th Ct, Tinley Park, IL 60477
$-102
Cash flow
-2.4%
Cash-on-Cash Return
5.1%
Cap rate
1.0%
Rent to Value Ratio
Active
$430,000
3
bds
|
2
ba
|
1,050
sqft
|
built
1987
1149 N Cardinal Dr, Palatine, IL 60074
$-439
Cash flow
-5.3%
Cash-on-Cash Return
4.5%
Cap rate
0.7%
Rent to Value Ratio