Cook County Investment Properties for Sale
Browse homes for sale and investment properties in Cook County. Refine your search by price, property type, or more.
Best cash flowing properties in Cook County
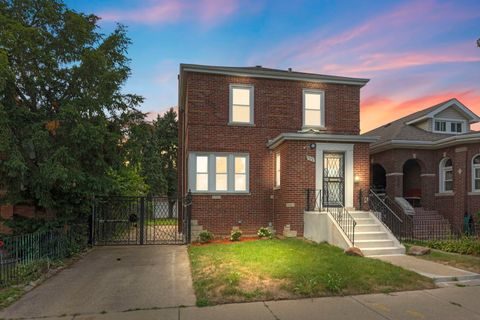
Active
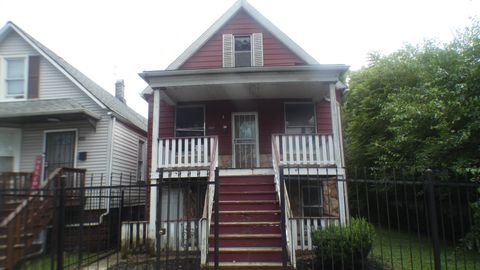
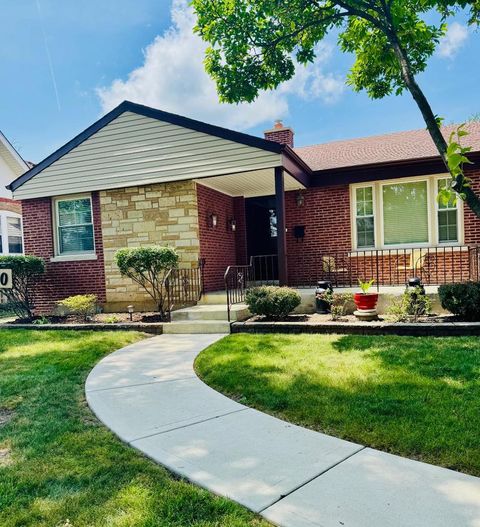
$95,000
5
bds
|
3
ba
|
1,194
sqft
|
built
1903
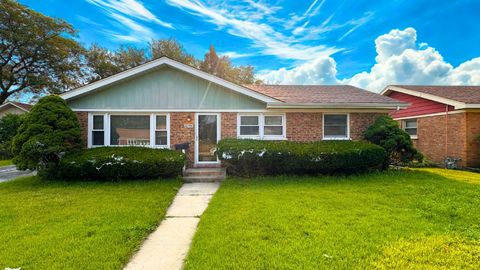
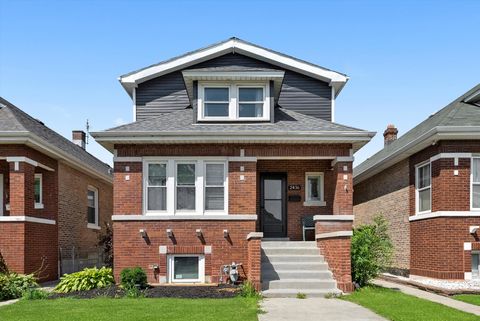
2047 W 67th Pl, Chicago, IL 60636
$822
Cash flow
45.1%
Cash-on-Cash Return
16.1%
Cap rate
2.1%
Rent to Value Ratio
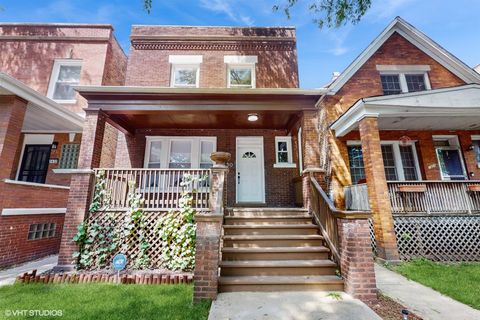
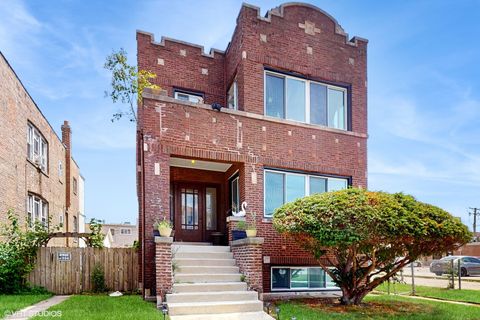
Active
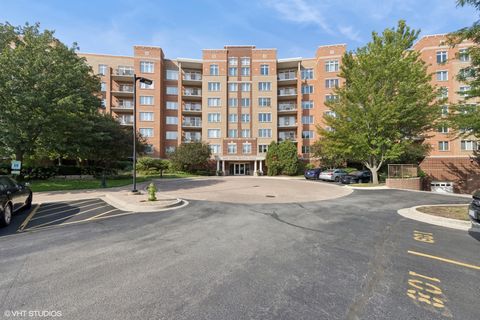
$285,000
4
bds
|
2
ba
|
2,400
sqft
|
built
1906
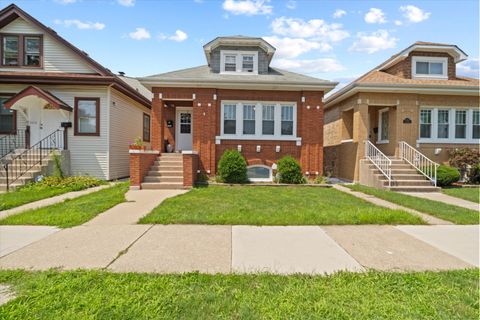
7430 S King Dr, Chicago, IL 60619
$459
Cash flow
8.4%
Cash-on-Cash Return
7.6%
Cap rate
1.0%
Rent to Value Ratio
4,699 out of 5,467 properties for sale in Cook County
Limited Results Shown
Create a free account, or log in to reveal all property listings and enjoy the complete experience.
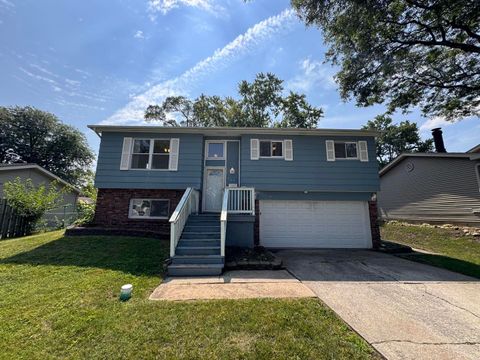
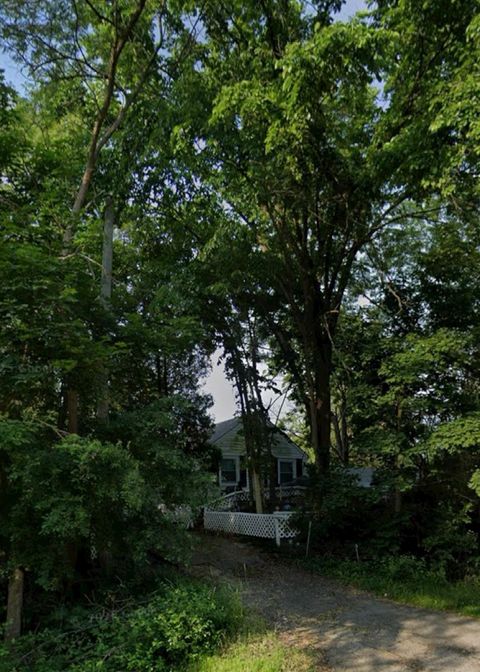
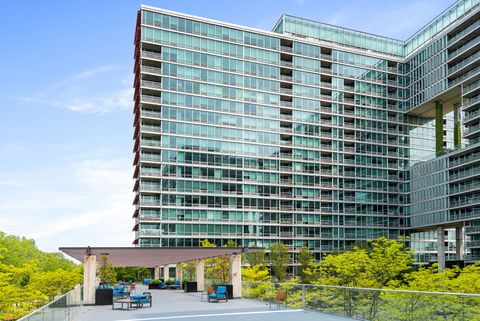
Active
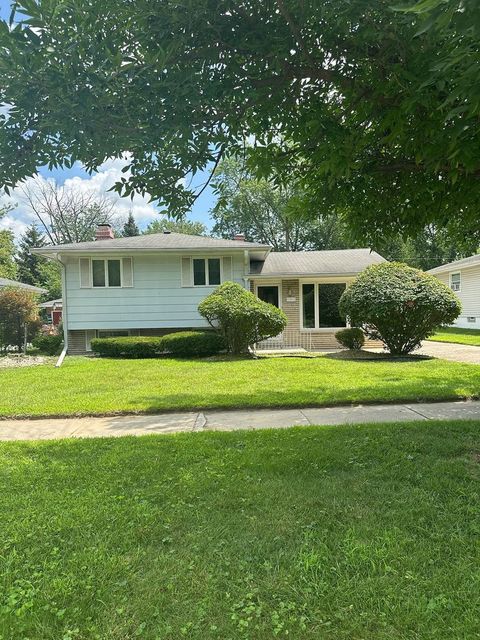
$336,000
4
bds
|
3
ba
|
1,019
sqft
|
built
1969
5103 Elmwood Rd, Oak Forest, IL 60452
$-474
Cash flow
-7.4%
Cash-on-Cash Return
4.0%
Cap rate
0.7%
Rent to Value Ratio
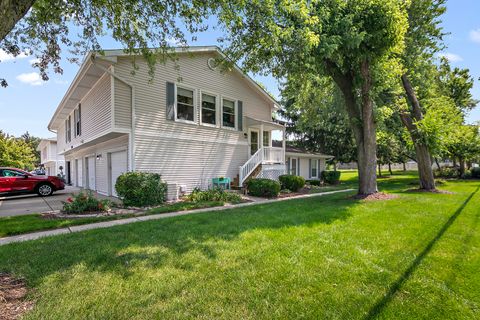
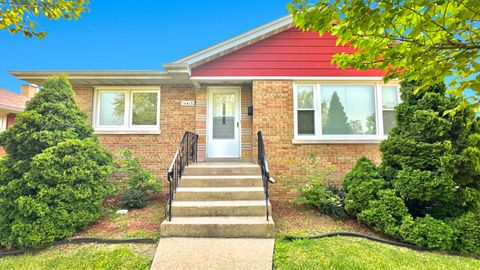
Active
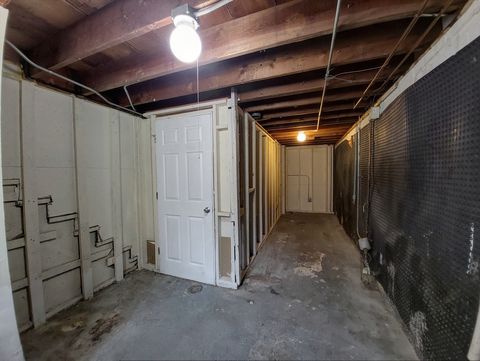
$184,900
2
bds
|
1
ba
|
0
sqft
|
built
1972
5349 Crescent Ln, Oak Forest, IL 60452
$-276
Cash flow
-7.8%
Cash-on-Cash Return
3.9%
Cap rate
0.9%
Rent to Value Ratio
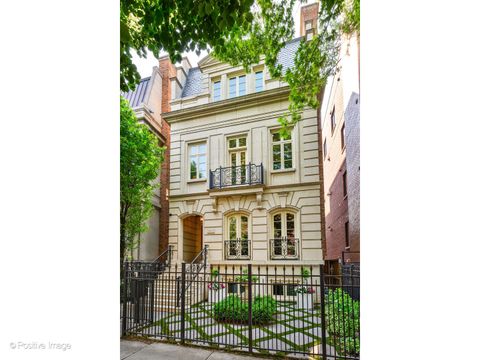
Active
$645,000
3
bds
|
3
ba
|
0
sqft
|
built
1879
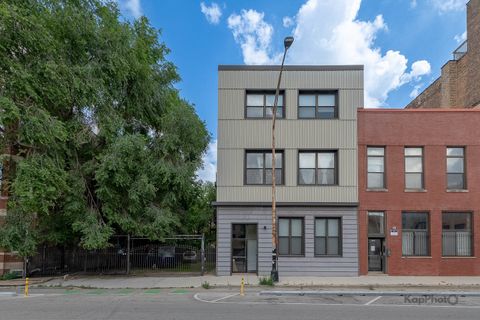
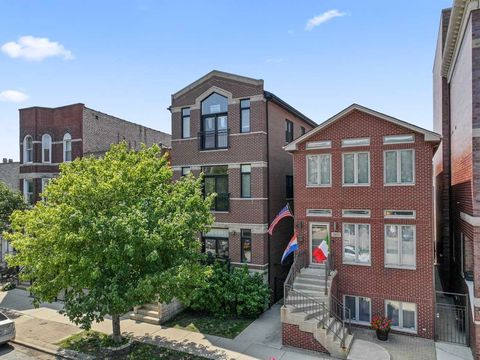
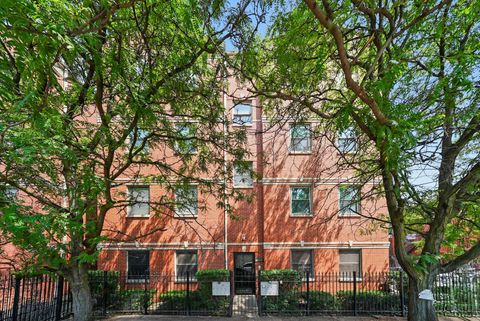
1346 W Augusta Blvd, Chicago, IL 60642
$-1,577
Cash flow
-12.8%
Cash-on-Cash Return
2.7%
Cap rate
0.5%
Rent to Value Ratio
Active
$525,000
3
bds
|
2
ba
|
1,083
sqft
|
built
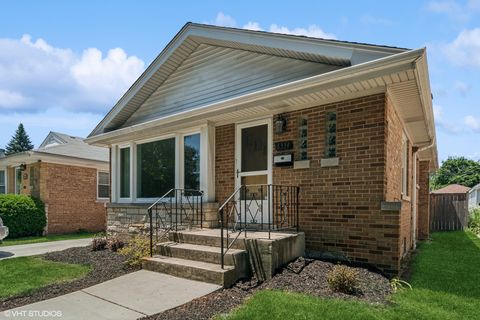
1951
6334 N Kildare Ave, Chicago, IL 60646
$-1,183
Cash flow
-11.8%
Cash-on-Cash Return
3.0%
Cap rate
0.6%
Rent to Value Ratio
Active
$895,000
5
bds
|
4
ba
|
3,500
sqft
|
built
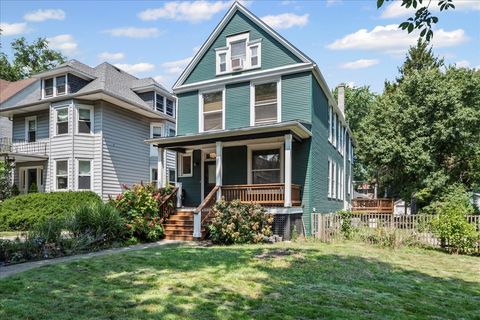
1910
1842 W Greenleaf Ave, Chicago, IL 60626
$-2,023
Cash flow
-11.8%
Cash-on-Cash Return
3.0%
Cap rate
0.5%
Rent to Value Ratio
Active
$1,250,000
2
bds
|
2
ba
|
2,352
sqft
|
built
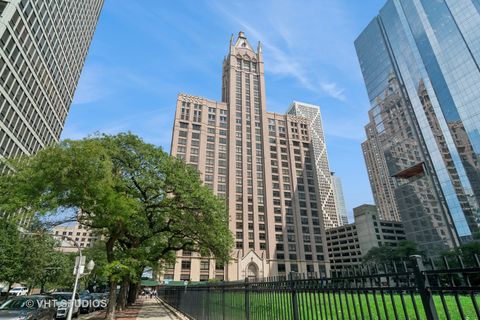
1923
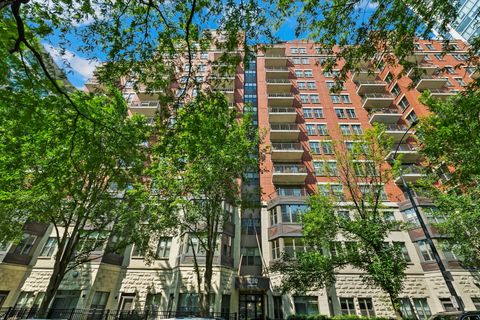
680 N Lake Shore Dr, Chicago, IL 60611
$-3,975
Cash flow
-16.6%
Cash-on-Cash Return
1.9%
Cap rate
0.5%
Rent to Value Ratio
Active
$434,900
3
bds
|
2
ba
|
1,600
sqft
|
built
1951
1540 Norfolk Ave, Westchester, IL 60154
$-571
Cash flow
-6.9%
Cash-on-Cash Return
4.1%
Cap rate
0.7%
Rent to Value Ratio
Active
$435,000
2
bds
|
2
ba
|
1,321
sqft
|
built
2001
1 N Beacon Pl, La Grange, IL 60525
$-1,808
Cash flow
-21.7%
Cash-on-Cash Return
0.7%
Cap rate
0.5%
Rent to Value Ratio
Active
$170,000
3
bds
|
2
ba
|
930
sqft
|
built
1972
17871 Locust St, Lansing, IL 60438
$434
Cash flow
13.3%
Cash-on-Cash Return
8.7%
Cap rate
1.2%
Rent to Value Ratio
Active
$228,000
3
bds
|
2
ba
|
1,580
sqft
|
built
1956
18034 Lorenz Ave, Lansing, IL 60438
$211
Cash flow
4.8%
Cash-on-Cash Return
6.8%
Cap rate
1.0%
Rent to Value Ratio
Active
$375,000
3
bds
|
2
ba
|
1,561
sqft
|
built
1962
224 N Bissell Dr, Palatine, IL 60074
$-254
Cash flow
-3.5%
Cash-on-Cash Return
4.9%
Cap rate
0.8%
Rent to Value Ratio
Active
$145,000
1
bds
|
1
ba
|
700
sqft
|
built
1970
2330 N Harlem Ave, Elmwood Park, IL 60707
$97
Cash flow
3.5%
Cash-on-Cash Return
6.5%
Cap rate
1.2%
Rent to Value Ratio
Active
$112,000
1
bds
|
1
ba
|
700
sqft
|
built
1961
10931 S Lloyd Dr, Worth, IL 60482
$3
Cash flow
0.1%
Cash-on-Cash Return
5.7%
Cap rate
1.3%
Rent to Value Ratio
Active
$975,000
5
bds
|
6
ba
|
4,064
sqft
|
built
2001
9032 Wolf Rd, Willow Springs, IL 60480
$-2,673
Cash flow
-14.3%
Cash-on-Cash Return
2.4%
Cap rate
0.5%
Rent to Value Ratio
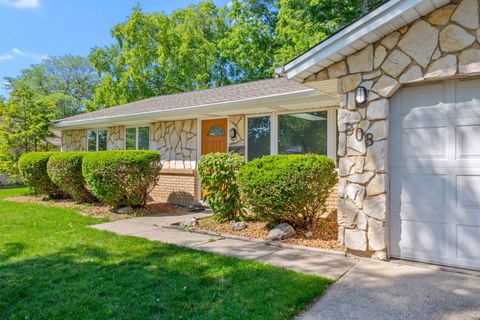
Active
$400,000
3
bds
|
2
ba
|
1,386
sqft
|
built
1971
808 S Cedarcrest Dr, Schaumburg, IL 60193
$-447
Cash flow
-5.8%
Cash-on-Cash Return
4.3%
Cap rate
0.8%
Rent to Value Ratio
Active
$4,425,000
6
bds
|
8
ba
|
8,550
sqft
|
built
2009
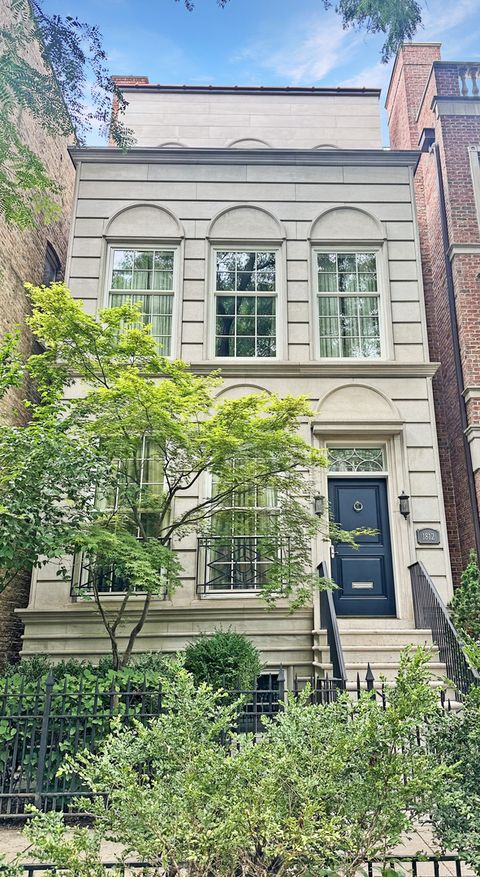
2248 N Orchard St, Chicago, IL 60614
$-21,151
Cash flow
-24.9%
Cash-on-Cash Return
-0.1%
Cap rate
0.2%
Rent to Value Ratio
Active
$275,000
1
bds
|
1
ba
|
700
sqft
|
built
1983
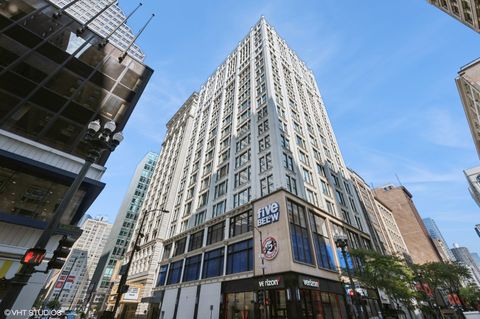
10 E Ontario St, Chicago, IL 60611
$-609
Cash flow
-11.6%
Cash-on-Cash Return
3.0%
Cap rate
0.8%
Rent to Value Ratio
Active
$190,000
3
bds
|
2
ba
|
14,300
sqft
|
built
1941
1223 W Dundee Rd, Palatine, IL 60074
$135
Cash flow
3.7%
Cash-on-Cash Return
6.5%
Cap rate
1.2%
Rent to Value Ratio
Active
$258,000
2
bds
|
2
ba
|
990
sqft
|
built
1913
8 W Monroe St, Chicago, IL 60603
$-1,030
Cash flow
-20.8%
Cash-on-Cash Return
0.9%
Cap rate
1.1%
Rent to Value Ratio
Active
$293,000
3
bds
|
1
ba
|
1,133
sqft
|
built
1956
10755 Mason Ave, Chicago Ridge, IL 60415
$-161
Cash flow
-2.9%
Cash-on-Cash Return
5.0%
Cap rate
0.9%
Rent to Value Ratio
Active
$549,000
4
bds
|
3
ba
|
2,600
sqft
|
built
2012
3106 S Wells St, Chicago, IL 60616
$-1,253
Cash flow
-11.9%
Cash-on-Cash Return
2.9%
Cap rate
0.6%
Rent to Value Ratio
Active
$3,300,000
6
bds
|
7
ba
|
6,200
sqft
|
built
2002
1812 N Cleveland Ave, Chicago, IL 60614
$-14,184
Cash flow
-22.4%
Cash-on-Cash Return
0.5%
Cap rate
0.3%
Rent to Value Ratio
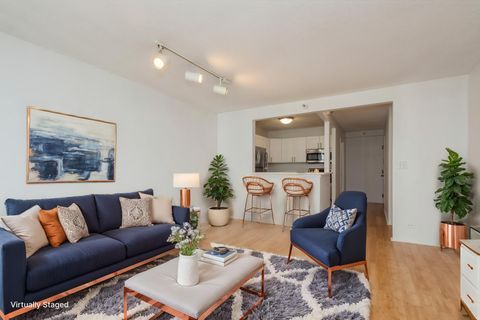
Active
$299,900
1
bds
|
2
ba
|
1,100
sqft
|
built
2004
1250 S Indiana Ave, Chicago, IL 60605
$-771
Cash flow
-13.4%
Cash-on-Cash Return
2.6%
Cap rate
0.8%
Rent to Value Ratio
Active
$415,000
2
bds
|
2
ba
|
1,260
sqft
|
built
2007
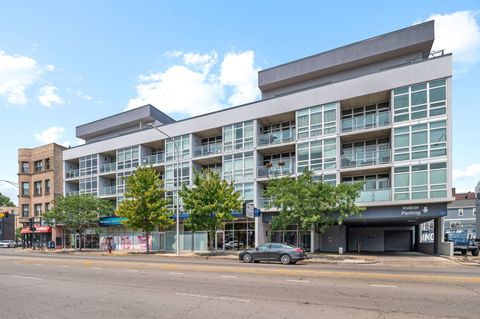
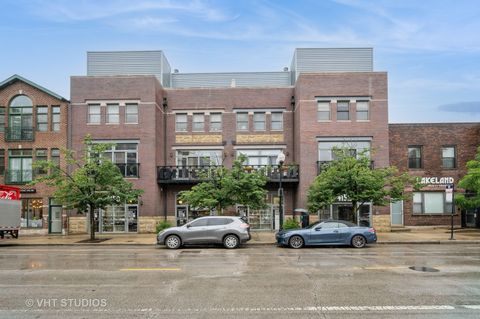
1610 W Fullerton Ave, Chicago, IL 60614
$-458
Cash flow
-5.8%
Cash-on-Cash Return
4.4%
Cap rate
0.8%
Rent to Value Ratio
Active
$625,000
4
bds
|
4
ba
|
3,050
sqft
|
built
1923
2436 Grove Ave, Berwyn, IL 60402
$-1,219
Cash flow
-10.2%
Cash-on-Cash Return
3.3%
Cap rate
0.6%
Rent to Value Ratio
Active
$585,900
4
bds
|
3
ba
|
2,514
sqft
|
built
1954
1001 Oakton St, Park Ridge, IL 60068
$-383
Cash flow
-3.4%
Cash-on-Cash Return
4.9%
Cap rate
0.8%
Rent to Value Ratio
Active
$232,000
2
bds
|
1
ba
|
1,084
sqft
|
built
2002
519 S Maplewood Ave, Chicago, IL 60612
$-64
Cash flow
-1.4%
Cash-on-Cash Return
5.3%
Cap rate
0.9%
Rent to Value Ratio
Active
$535,000
3
bds
|
3
ba
|
2,532
sqft
|
built
1923
3036 N Luna Ave, Chicago, IL 60641
$-886
Cash flow
-8.6%
Cash-on-Cash Return
3.7%
Cap rate
0.6%
Rent to Value Ratio
Active
$624,900
3
bds
|
3
ba
|
1,900
sqft
|
built
2002
4152 N Lincoln Ave, Chicago, IL 60618
$-1,684
Cash flow
-14.1%
Cash-on-Cash Return
2.4%
Cap rate
0.6%
Rent to Value Ratio
Active
$325,000
2
bds
|
1
ba
|
850
sqft
|
built
1913
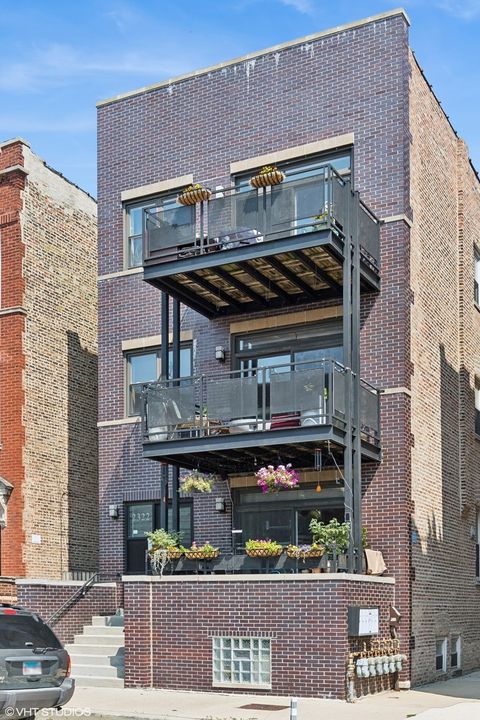
2322 W Augusta Blvd, Chicago, IL 60622
$-482
Cash flow
-7.7%
Cash-on-Cash Return
3.9%
Cap rate
0.8%
Rent to Value Ratio
Active
$360,000
4
bds
|
3
ba
|
1,810
sqft
|
built
1940
9326 S May St, Chicago, IL 60620
$-518
Cash flow
-7.5%
Cash-on-Cash Return
4.0%
Cap rate
0.6%
Rent to Value Ratio
Active
$499,000
4
bds
|
2
ba
|
0
sqft
|
built
1924
2125 Euclid Ave, Berwyn, IL 60402
$-636
Cash flow
-6.6%
Cash-on-Cash Return
4.1%
Cap rate
0.5%
Rent to Value Ratio
Active
$675,000
3
bds
|
2
ba
|
1,700
sqft
|
built
2008
9725 Woods Dr, Skokie, IL 60077
$-2,160
Cash flow
-16.7%
Cash-on-Cash Return
1.8%
Cap rate
0.6%
Rent to Value Ratio
Active
$254,000
3
bds
|
2
ba
|
1,200
sqft
|
built
1959
16417 School St, South Holland, IL 60473
$-127
Cash flow
-2.6%
Cash-on-Cash Return
5.1%
Cap rate
1.0%
Rent to Value Ratio
Active
$180,000
2
bds
|
2
ba
|
1,100
sqft
|
built
1984
14033 Laramie Ave, Crestwood, IL 60418
$-57
Cash flow
-1.7%
Cash-on-Cash Return
5.3%
Cap rate
1.0%
Rent to Value Ratio
Active
$315,000
2
bds
|
2
ba
|
1,400
sqft
|
built
1973
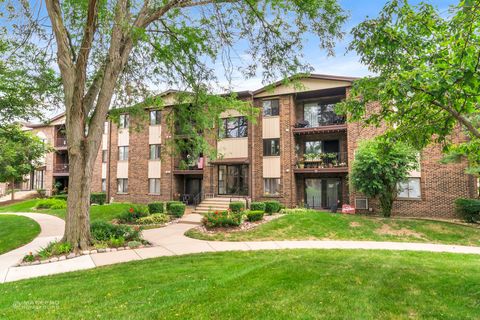
9332 Landings Ln, Des Plaines, IL 60016
$-688
Cash flow
-11.4%
Cash-on-Cash Return
3.1%
Cap rate
0.7%
Rent to Value Ratio
Active
$229,900
2
bds
|
2
ba
|
0
sqft
|
built
1980
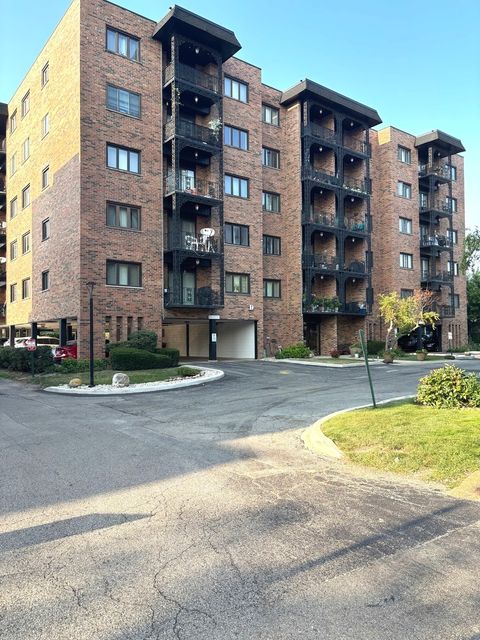
711 S River Rd, Des Plaines, IL 60016
$-481
Cash flow
-10.9%
Cash-on-Cash Return
3.2%
Cap rate
0.9%
Rent to Value Ratio
Active
$395,000
2
bds
|
2
ba
|
1,075
sqft
|
built
2004
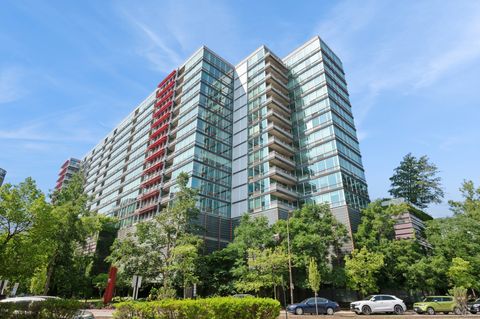
800 Elgin Rd, Evanston, IL 60201
$-1,096
Cash flow
-14.5%
Cash-on-Cash Return
2.3%
Cap rate
0.8%
Rent to Value Ratio