Cook County Investment Properties for Sale
Browse homes for sale and investment properties in Cook County. Refine your search by price, property type, or more.
Best cash flowing properties in Cook County
Active
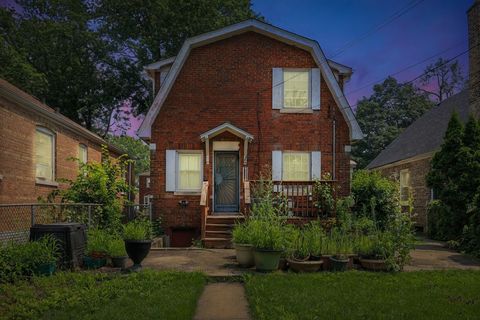
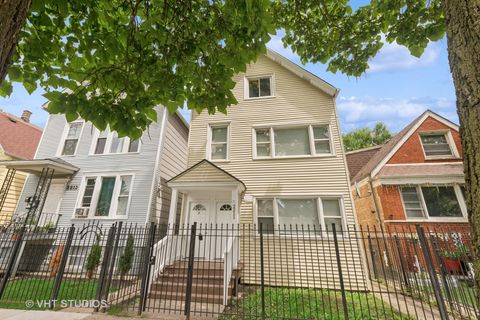
$159,000
2
bds
|
2
ba
|
1,364
sqft
|
built
1940
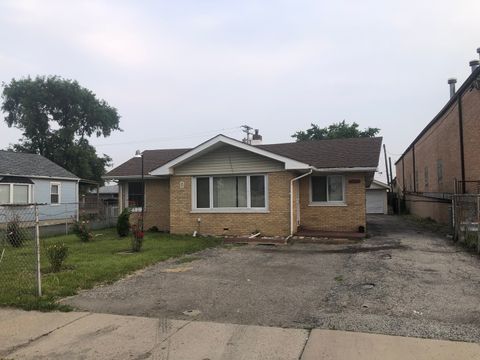
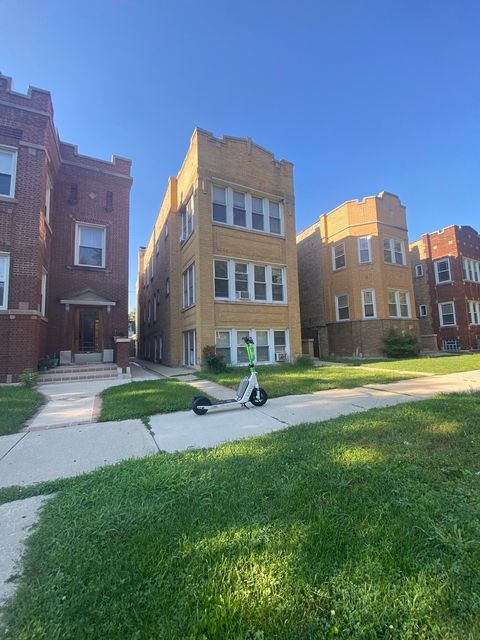
12220 S La Salle St, Chicago, IL 60628
$683
Cash flow
22.4%
Cash-on-Cash Return
10.8%
Cap rate
1.4%
Rent to Value Ratio
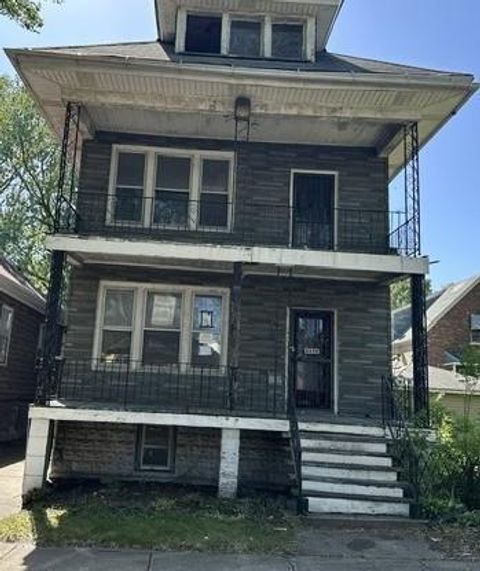
Active
$95,000
4
bds
|
2
ba
|
0
sqft
|
built
1918
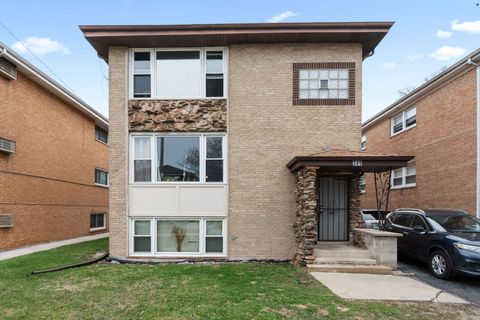
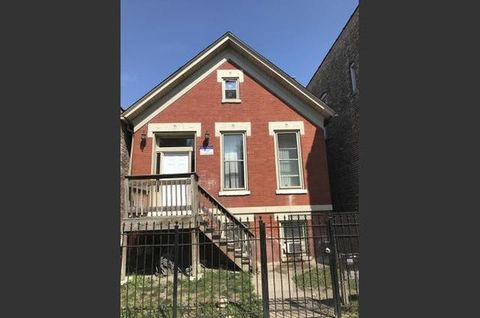
8606 S Saginaw Ave, Chicago, IL 60617
$616
Cash flow
33.8%
Cash-on-Cash Return
13.5%
Cap rate
1.9%
Rent to Value Ratio
4,738 out of 5,507 properties for sale in Cook County
Limited Results Shown
Create a free account, or log in to reveal all property listings and enjoy the complete experience.
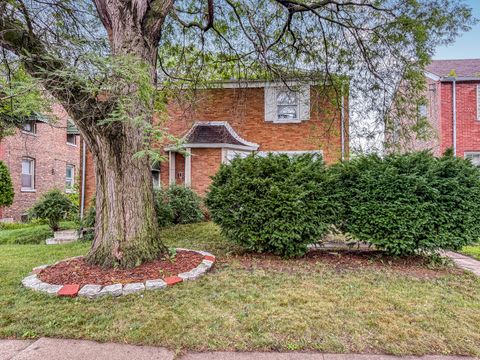
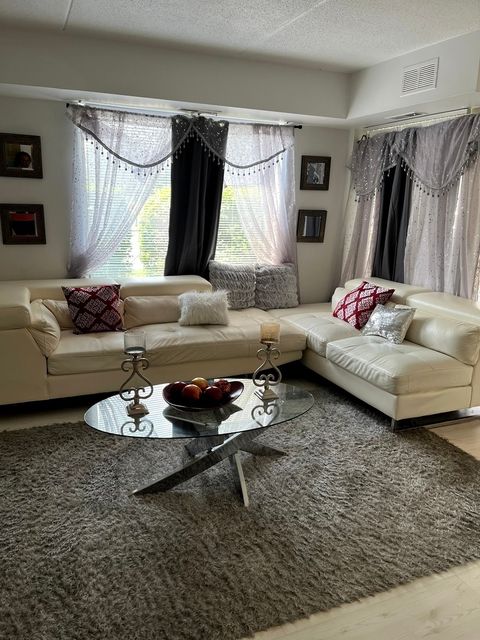
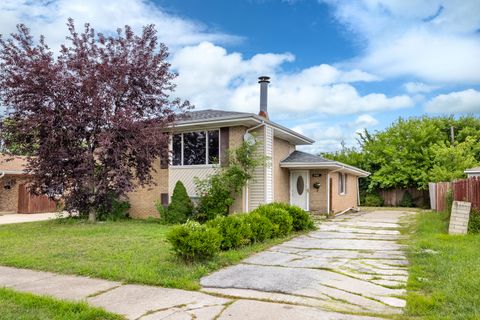
Active
$160,000
2
bds
|
2
ba
|
1,000
sqft
|
built
1942
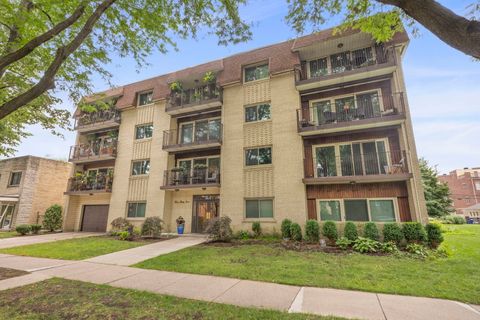
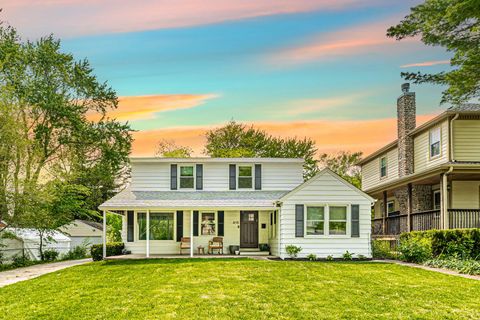
8539 S Saint Lawrence Ave, Chicago, IL 60619
$309
Cash flow
10.1%
Cash-on-Cash Return
8.0%
Cap rate
1.1%
Rent to Value Ratio
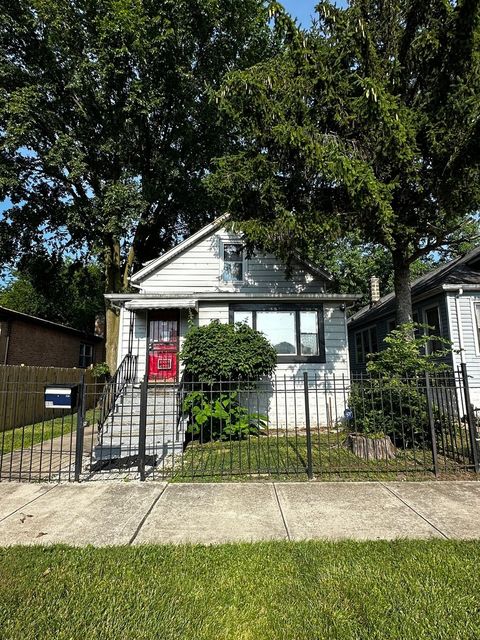
Active
$202,000
4
bds
|
3
ba
|
1,400
sqft
|
built
1923
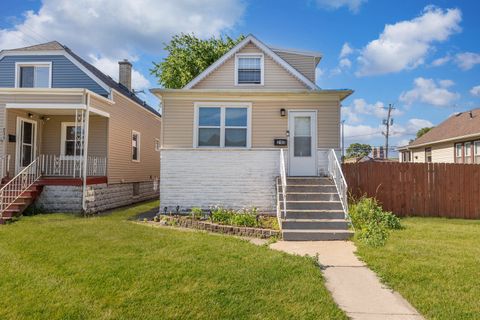
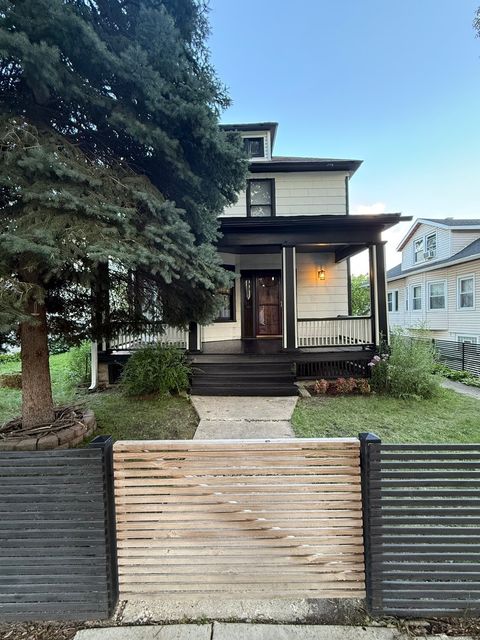
9930 S Perry Ave, Chicago, IL 60628
$10
Cash flow
0.3%
Cash-on-Cash Return
5.7%
Cap rate
0.7%
Rent to Value Ratio
Active
$425,000
3
bds
|
4
ba
|
2,567
sqft
|
built
1990
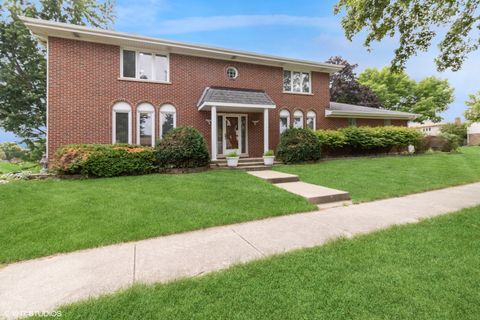
9838 S Beverly Ave, Chicago, IL 60643
$-33
Cash flow
-0.4%
Cash-on-Cash Return
5.6%
Cap rate
0.8%
Rent to Value Ratio
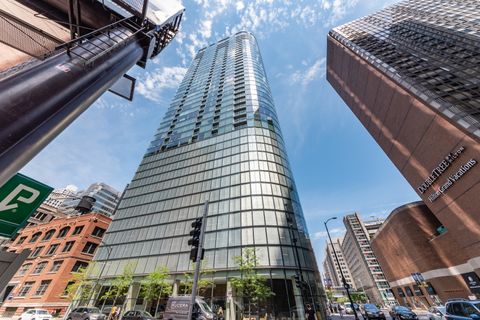
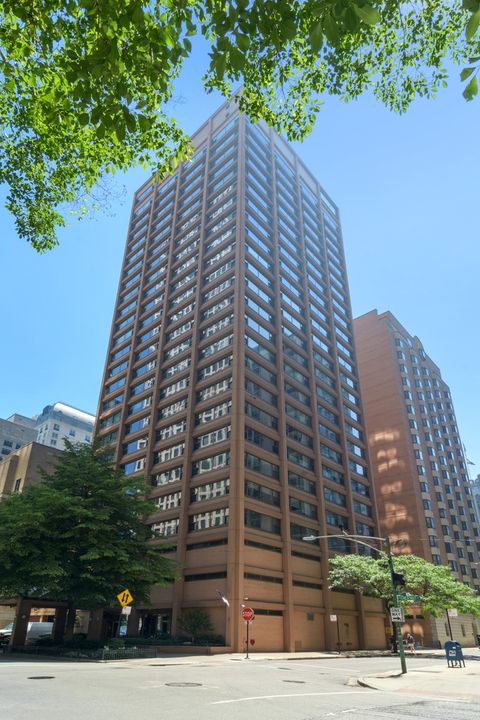
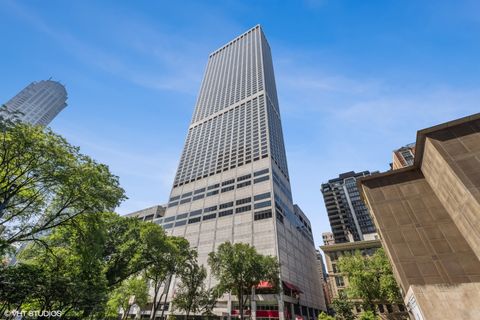
Active
$425,000
1
bds
|
1
ba
|
821
sqft
|
built
2007
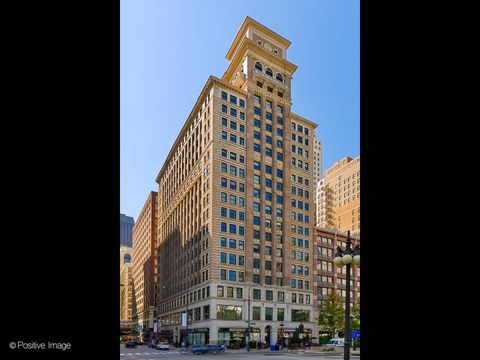
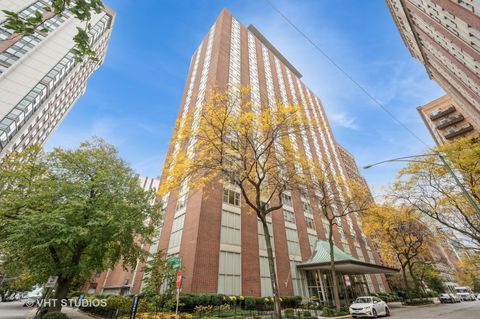
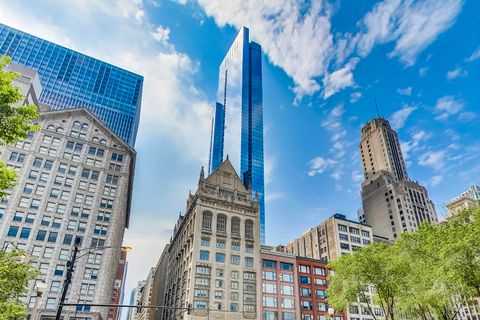
600 N Fairbanks Ct, Chicago, IL 60611
$-1,394
Cash flow
-17.1%
Cash-on-Cash Return
1.7%
Cap rate
0.7%
Rent to Value Ratio
Active
$149,000
1
bds
|
1
ba
|
525
sqft
|
built
1974
4343 N Clarendon Ave, Chicago, IL 60613
$-679
Cash flow
-23.8%
Cash-on-Cash Return
0.2%
Cap rate
1.2%
Rent to Value Ratio
Active
$95,000
3
bds
|
2
ba
|
1,188
sqft
|
built
1974
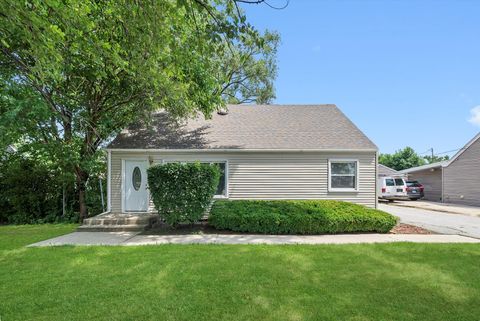
400 Park Ave, Calumet City, IL 60409
$-103
Cash flow
-5.7%
Cash-on-Cash Return
4.4%
Cap rate
1.9%
Rent to Value Ratio
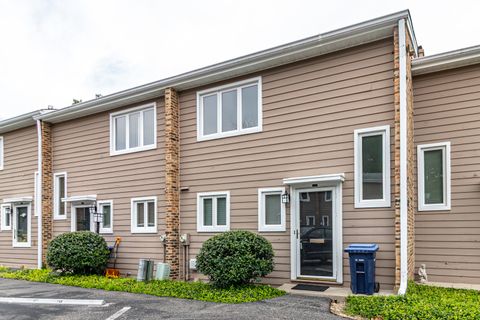
Active
$199,950
3
bds
|
2
ba
|
1,346
sqft
|
built
1970
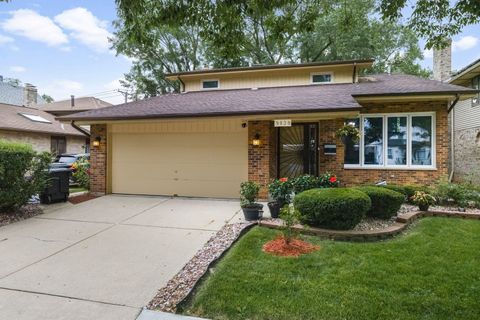
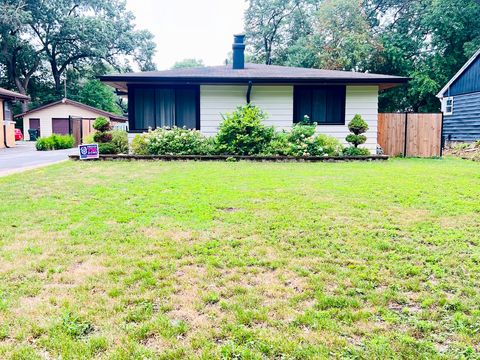
16465 Terry Ln, Oak Forest, IL 60452
$88
Cash flow
2.3%
Cash-on-Cash Return
6.2%
Cap rate
1.3%
Rent to Value Ratio
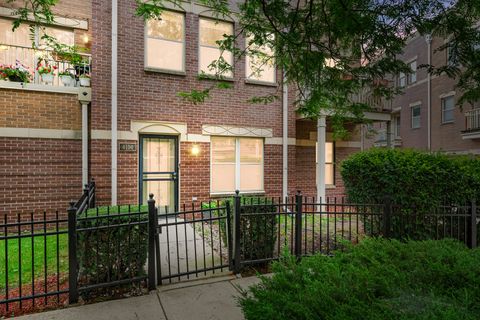
Active
$349,000
2
bds
|
2
ba
|
1,250
sqft
|
built
1965
247 E Chestnut St, Chicago, IL 60611
$-1,269
Cash flow
-19.0%
Cash-on-Cash Return
1.3%
Cap rate
0.9%
Rent to Value Ratio
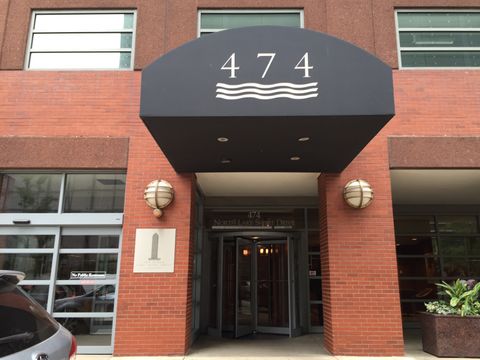
Active
$210,000
bds
|
1
ba
|
642
sqft
|
built
1991
474 N Lake Shore Dr, Chicago, IL 60611
$-582
Cash flow
-14.5%
Cash-on-Cash Return
2.4%
Cap rate
0.9%
Rent to Value Ratio
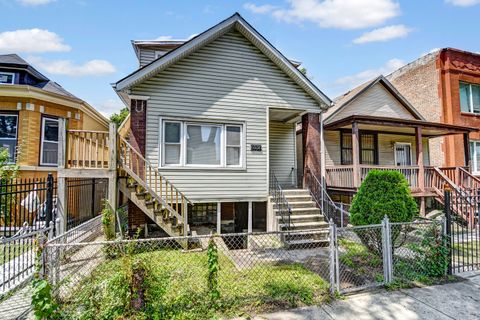
Active
$249,873
4
bds
|
2
ba
|
2,000
sqft
|
built
1888
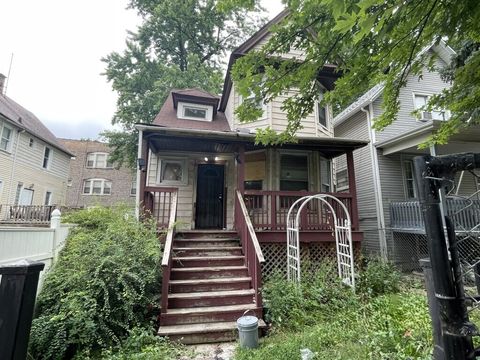
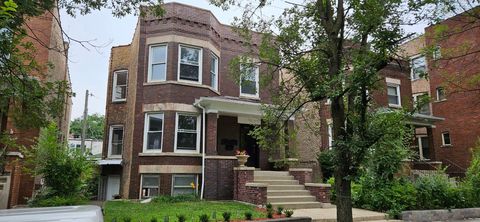
6336 S Saint Lawrence Ave, Chicago, IL 60637
$264
Cash flow
5.5%
Cash-on-Cash Return
6.9%
Cap rate
0.9%
Rent to Value Ratio
Active
$298,900
3
bds
|
2
ba
|
1,234
sqft
|
built
1958
17750 Clyde Ave, Lansing, IL 60438
$128
Cash flow
2.2%
Cash-on-Cash Return
6.2%
Cap rate
0.9%
Rent to Value Ratio
Active
$154,900
3
bds
|
2
ba
|
1,781
sqft
|
built
1919
213 153rd Pl, Calumet City, IL 60409
$211
Cash flow
7.1%
Cash-on-Cash Return
7.3%
Cap rate
1.4%
Rent to Value Ratio
Active
$474,900
2
bds
|
2
ba
|
1,350
sqft
|
built
1999
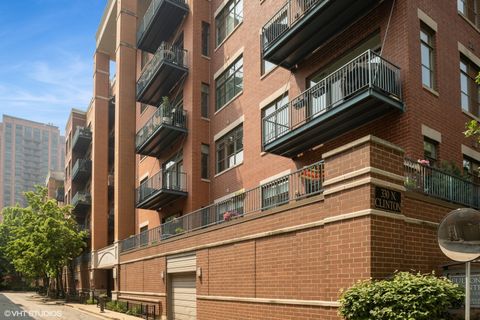
330 N Clinton St, Chicago, IL 60661
$-864
Cash flow
-9.5%
Cash-on-Cash Return
3.5%
Cap rate
0.8%
Rent to Value Ratio
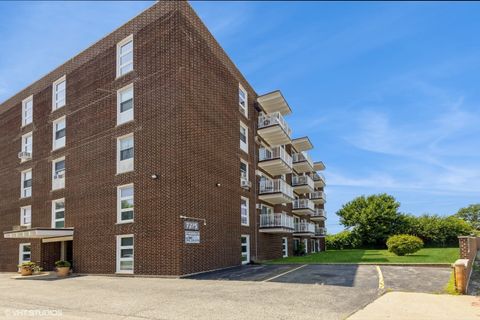
Active
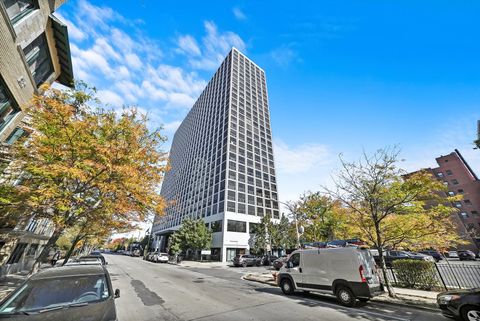
$295,000
2
bds
|
2
ba
|
1,343
sqft
|
built
1973
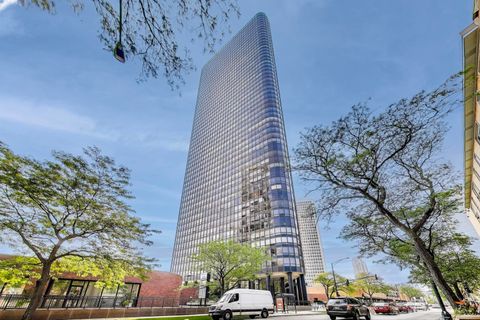
5415 N Sheridan Rd, Chicago, IL 60640
$-1,057
Cash flow
-18.7%
Cash-on-Cash Return
1.4%
Cap rate
1.0%
Rent to Value Ratio
Active
$259,000
3
bds
|
2
ba
|
1,344
sqft
|
built
1960
7153 W 72nd St, Chicago, IL 60638
$40
Cash flow
0.8%
Cash-on-Cash Return
5.9%
Cap rate
1.0%
Rent to Value Ratio
Active
$315,000
2
bds
|
2
ba
|
1,200
sqft
|
built
1966
339 Home Ave, Oak Park, IL 60302
$-975
Cash flow
-16.1%
Cash-on-Cash Return
2.0%
Cap rate
0.7%
Rent to Value Ratio
Active
$320,000
1
bds
|
1
ba
|
0
sqft
|
built
1895
6 N Michigan Ave, Chicago, IL 60602
$-665
Cash flow
-10.8%
Cash-on-Cash Return
3.2%
Cap rate
1.0%
Rent to Value Ratio
Active
$150,000
4
bds
|
1
ba
|
1,280
sqft
|
built
1890
5252 W Ferdinand St, Chicago, IL 60644
$529
Cash flow
18.4%
Cash-on-Cash Return
9.9%
Cap rate
1.3%
Rent to Value Ratio
Active
$655,000
6
bds
|
3
ba
|
0
sqft
|
built
1928
5352 W Dakin St, Chicago, IL 60641
$-1,916
Cash flow
-15.3%
Cash-on-Cash Return
2.2%
Cap rate
0.4%
Rent to Value Ratio
Active
$425,000
3
bds
|
1
ba
|
0
sqft
|
built
1949
418 S Rose St, Palatine, IL 60067
$-123
Cash flow
-1.5%
Cash-on-Cash Return
5.3%
Cap rate
0.8%
Rent to Value Ratio
Active
$549,000
2
bds
|
2
ba
|
1,650
sqft
|
built
1964
1325 N State Pkwy, Chicago, IL 60610
$-2,211
Cash flow
-21.0%
Cash-on-Cash Return
0.8%
Cap rate
0.7%
Rent to Value Ratio
Active
$359,900
5
bds
|
1
ba
|
1,704
sqft
|
built
1905
3751 W 63rd Pl, Chicago, IL 60629
$-308
Cash flow
-4.5%
Cash-on-Cash Return
4.7%
Cap rate
0.7%
Rent to Value Ratio
Active
$399,900
4
bds
|
2
ba
|
0
sqft
|
built
1897
2211 N Lorel Ave, Chicago, IL 60639
$-984
Cash flow
-12.8%
Cash-on-Cash Return
2.7%
Cap rate
0.5%
Rent to Value Ratio
Active
$2,095,000
3
bds
|
4
ba
|
2,754
sqft
|
built
1975
180 E Pearson St, Chicago, IL 60611
$-7,732
Cash flow
-19.3%
Cash-on-Cash Return
1.2%
Cap rate
0.5%
Rent to Value Ratio
Active
$310,000
2
bds
|
2
ba
|
0
sqft
|
built
1974
580 Green Bay Rd, Glencoe, IL 60022
$-478
Cash flow
-8.0%
Cash-on-Cash Return
3.8%
Cap rate
0.8%
Rent to Value Ratio
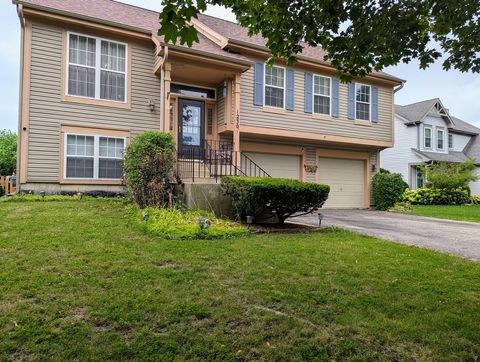
Active
$384,900
3
bds
|
2
ba
|
2,200
sqft
|
built
2008
4114 Maryland Ave, Chicago, IL 60653
$-213
Cash flow
-2.9%
Cash-on-Cash Return
5.0%
Cap rate
0.8%
Rent to Value Ratio
Active
$259,999
2
bds
|
2
ba
|
1,221
sqft
|
built
1968
7225 W Higgins Ave, Chicago, IL 60656
$-211
Cash flow
-4.2%
Cash-on-Cash Return
4.7%
Cap rate
0.8%
Rent to Value Ratio
Active
$384,990
4
bds
|
3
ba
|
2,060
sqft
|
built
1992
1230 Spring Creek Rd, Elgin, IL 60120
$-437
Cash flow
-5.9%
Cash-on-Cash Return
4.3%
Cap rate
0.8%
Rent to Value Ratio
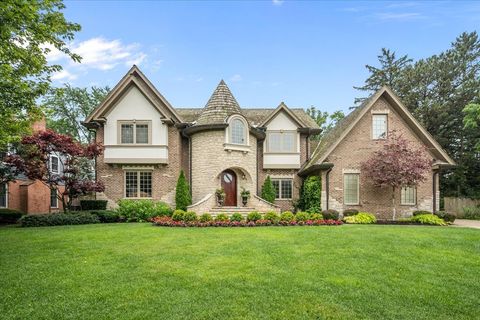
Active
$2,299,000
5
bds
|
6
ba
|
4,978
sqft
|
built
2007
1329 Glenwood Ave, Glenview, IL 60025
$-8,550
Cash flow
-19.4%
Cash-on-Cash Return
1.2%
Cap rate
0.3%
Rent to Value Ratio
Active
$160,000
1
bds
|
1
ba
|
0
sqft
|
built
1971
8810 Briar Ct, Des Plaines, IL 60016
$144
Cash flow
4.7%
Cash-on-Cash Return
6.8%
Cap rate
1.1%
Rent to Value Ratio
Active
$650,000
3
bds
|
4
ba
|
2,850
sqft
|
built
1981
601 S Saint Cecilia Dr, Mount Prospect, IL 60056
$-1,234
Cash flow
-9.9%
Cash-on-Cash Return
3.4%
Cap rate
0.6%
Rent to Value Ratio
Active
$649,000
7
bds
|
3
ba
|
0
sqft
|
built
1913
5015 W Montrose Ave, Chicago, IL 60641
$-2,274
Cash flow
-18.3%
Cash-on-Cash Return
1.5%
Cap rate
0.3%
Rent to Value Ratio
Active
$729,999
2
bds
|
2
ba
|
1,500
sqft
|
built
2009
60 E Monroe St, Chicago, IL 60603
$-3,164
Cash flow
-22.6%
Cash-on-Cash Return
0.5%
Cap rate
0.6%
Rent to Value Ratio
Active
$325,000
8
bds
|
5
ba
|
0
sqft
|
built
1967
349 Yates Ave, Calumet City, IL 60409
$-1,683
Cash flow
-27.0%
Cash-on-Cash Return
-0.5%
Cap rate
0.5%
Rent to Value Ratio
Active
$274,999
1
bds
|
1
ba
|
766
sqft
|
built
2004
1717 S Prairie Ave, Chicago, IL 60616
$-747
Cash flow
-14.2%
Cash-on-Cash Return
2.4%
Cap rate
0.8%
Rent to Value Ratio
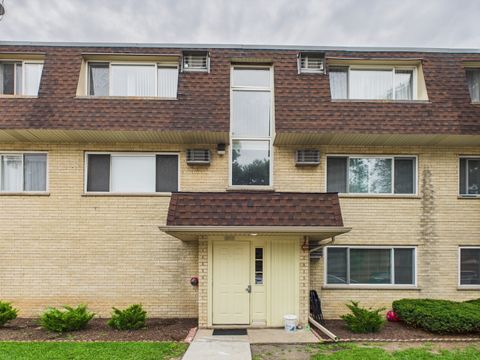
Active
$279,500
7
bds
|
3
ba
|
0
sqft
|
built
1903
3502 W Lake St, Chicago, IL 60624
$-98
Cash flow
-1.8%
Cash-on-Cash Return
5.3%
Cap rate
0.7%
Rent to Value Ratio
Active
$325,000
3
bds
|
2
ba
|
1,305
sqft
|
built
1954
9417 S 78th Ave, Hickory Hills, IL 60457
$-139
Cash flow
-2.2%
Cash-on-Cash Return
5.2%
Cap rate
0.9%
Rent to Value Ratio
Active
$169,900
3
bds
|
2
ba
|
0
sqft
|
built
1923
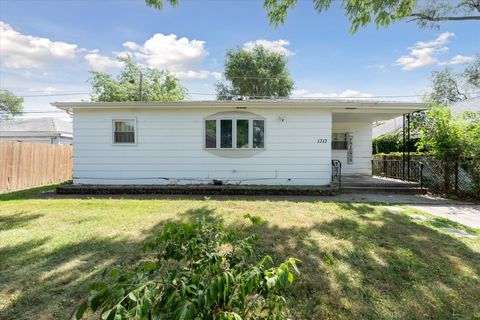
1313 Gordon Ave, Calumet City, IL 60409
$193
Cash flow
5.9%
Cash-on-Cash Return
7.0%
Cap rate
1.3%
Rent to Value Ratio