Cook County Investment Properties for Sale
Browse homes for sale and investment properties in Cook County. Refine your search by price, property type, or more.
Best cash flowing properties in Cook County
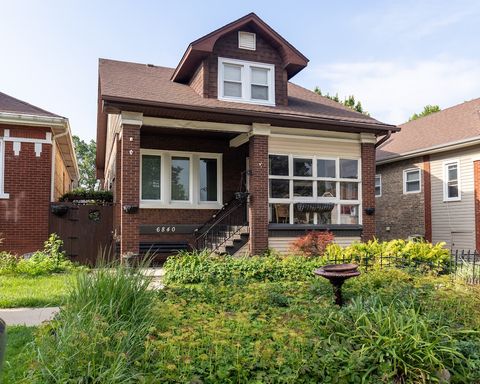
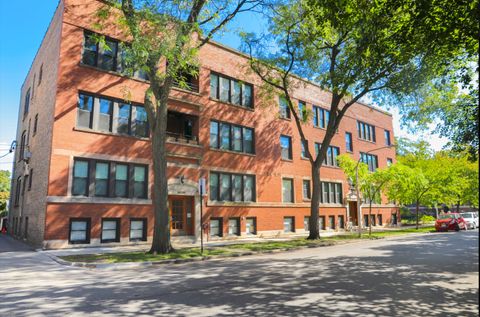
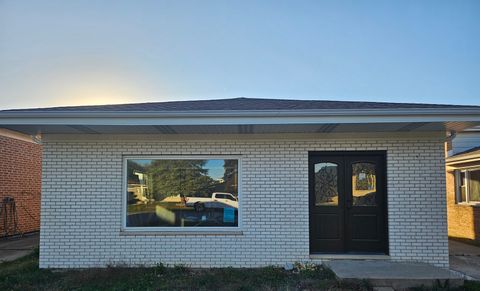
Active
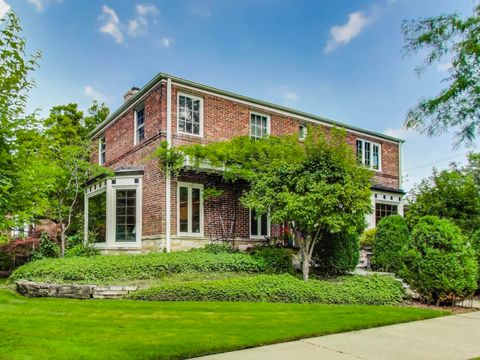
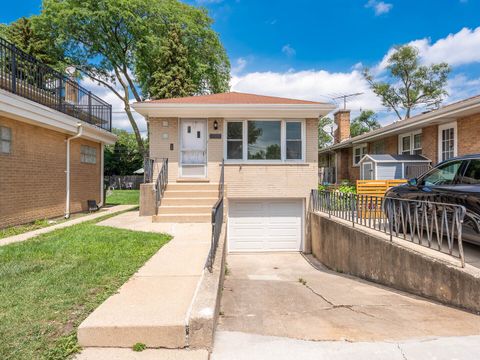
$251,750
4
bds
|
3
ba
|
1,020
sqft
|
built
1918
2659 N Mont Clare Ave, Chicago, IL 60707
$182
Cash flow
3.8%
Cash-on-Cash Return
6.5%
Cap rate
1.0%
Rent to Value Ratio
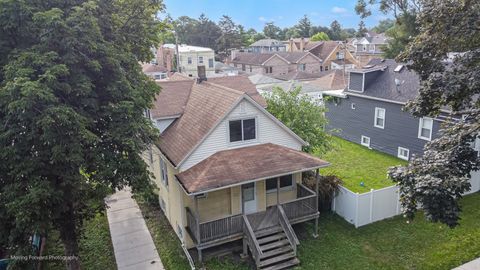
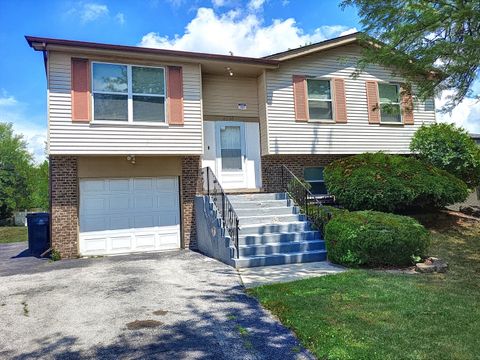
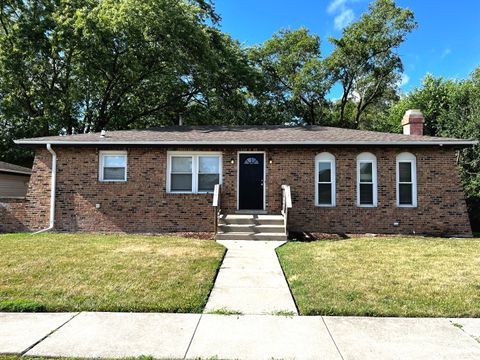
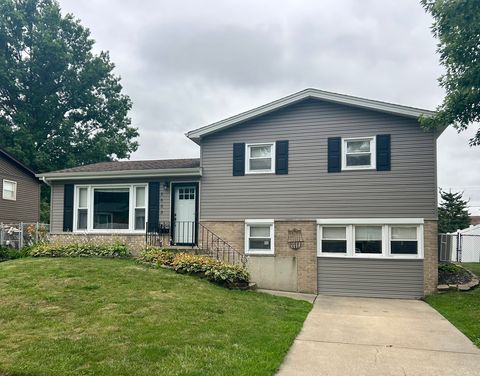
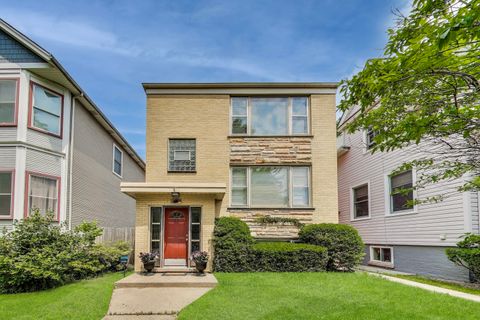
Active
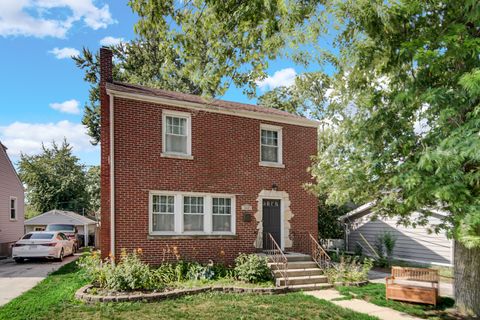
$383,000
3
bds
|
3
ba
|
3,000
sqft
|
built
1925
6840 29th Pl, Berwyn, IL 60402
$106
Cash flow
1.4%
Cash-on-Cash Return
6.0%
Cap rate
0.8%
Rent to Value Ratio
5,491 out of 6,361 properties for sale in Cook County
Limited Results Shown
Create a free account, or log in to reveal all property listings and enjoy the complete experience.
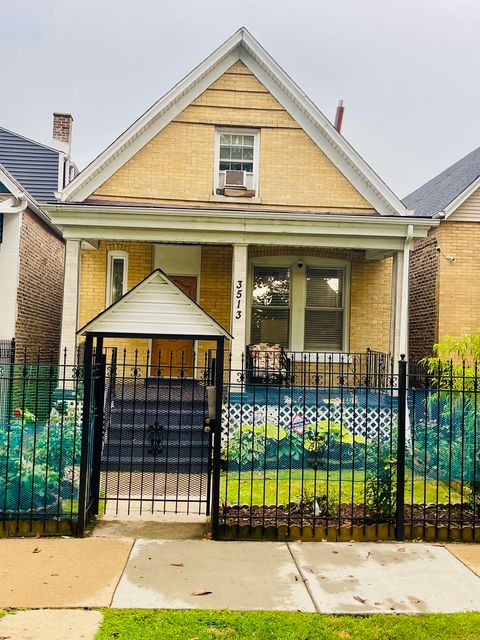
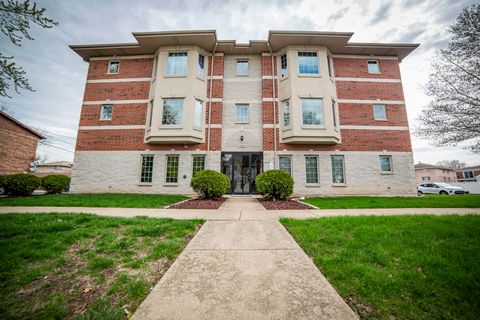
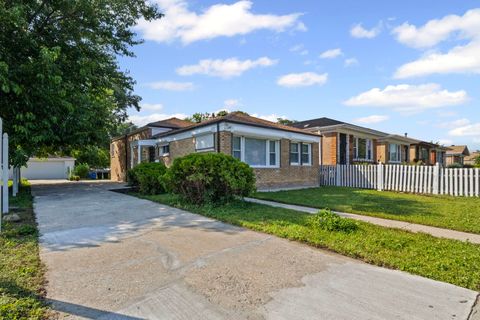
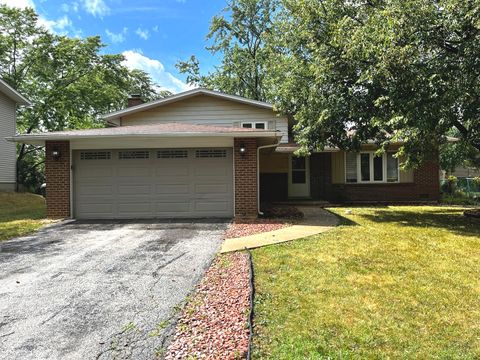
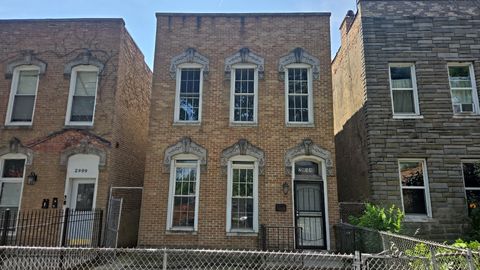
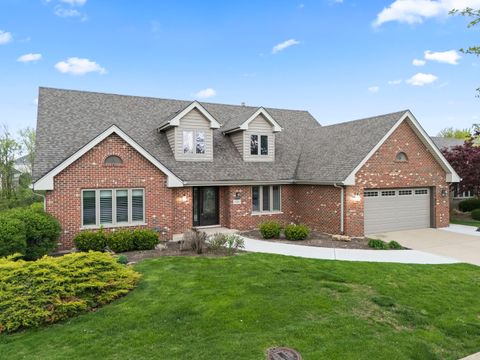
Active
$550,000
6
bds
|
3
ba
|
0
sqft
|
built
1903
3513 W Beach Ave, Chicago, IL 60651
$-1,050
Cash flow
-10.0%
Cash-on-Cash Return
3.4%
Cap rate
0.5%
Rent to Value Ratio
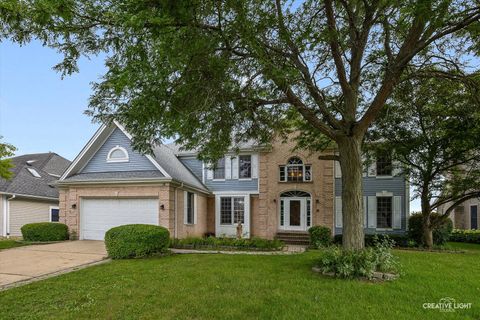
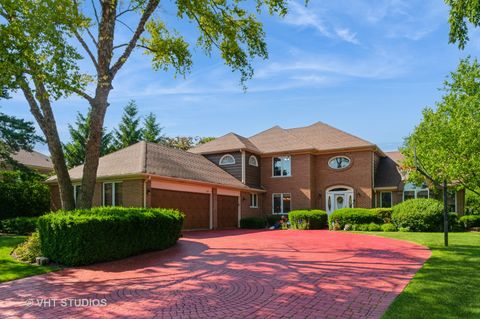
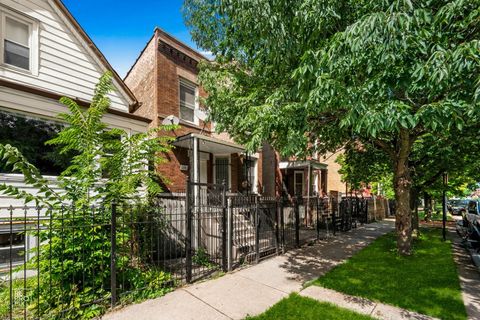
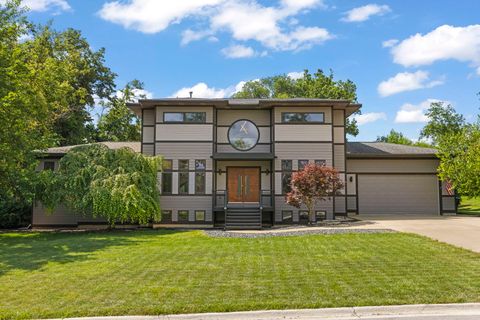
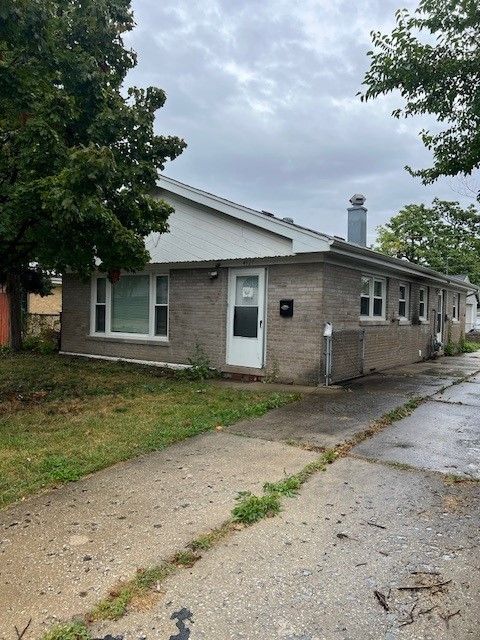
Active
$720,000
4
bds
|
4
ba
|
3,873
sqft
|
built
1993
1475 Crowfoot Cir S, Hoffman Estates, IL 60169
$-1,676
Cash flow
-12.1%
Cash-on-Cash Return
2.9%
Cap rate
0.6%
Rent to Value Ratio
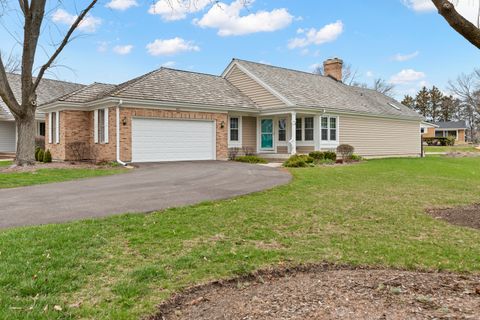
Active
$289,900
2
bds
|
2
ba
|
1,600
sqft
|
built
1991
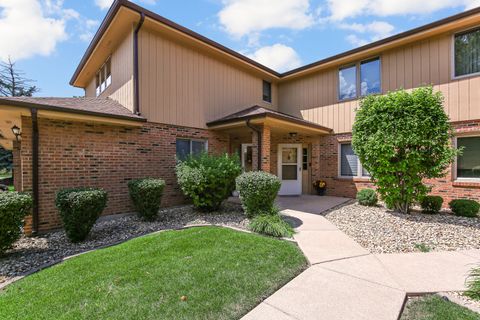
8966 Silverdale Dr, Orland Park, IL 60462
$-383
Cash flow
-6.9%
Cash-on-Cash Return
4.1%
Cap rate
0.9%
Rent to Value Ratio
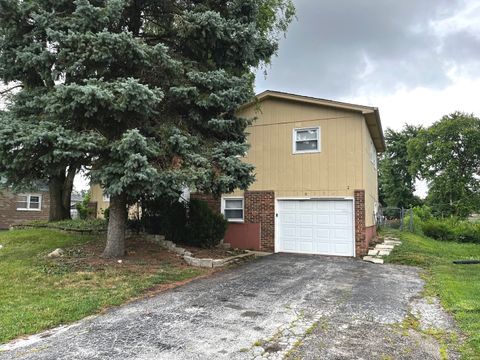
Active
$345,000
3
bds
|
2
ba
|
1,200
sqft
|
built
1958
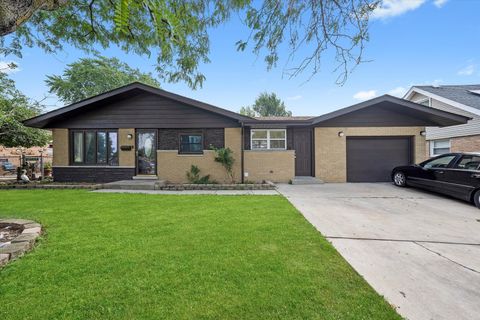
9201 Willow Ln, Bridgeview, IL 60455
$-406
Cash flow
-6.1%
Cash-on-Cash Return
4.3%
Cap rate
0.7%
Rent to Value Ratio
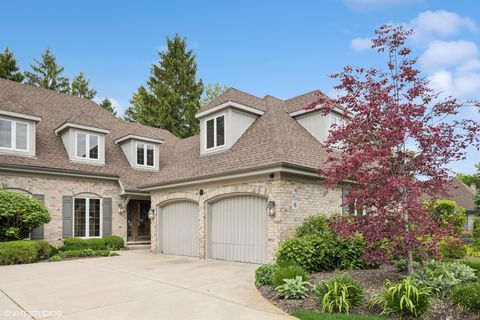
Active
$595,000
5
bds
|
3
ba
|
3,460
sqft
|
built
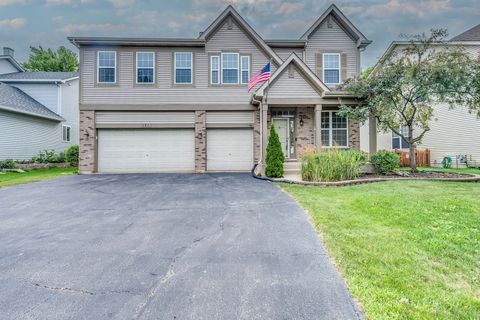
2004
171 Silbury Dr, Bartlett, IL 60103
$-1,186
Cash flow
-10.4%
Cash-on-Cash Return
3.3%
Cap rate
0.6%
Rent to Value Ratio
Active
$670,000
2
bds
|
2
ba
|
2,000
sqft
|
built
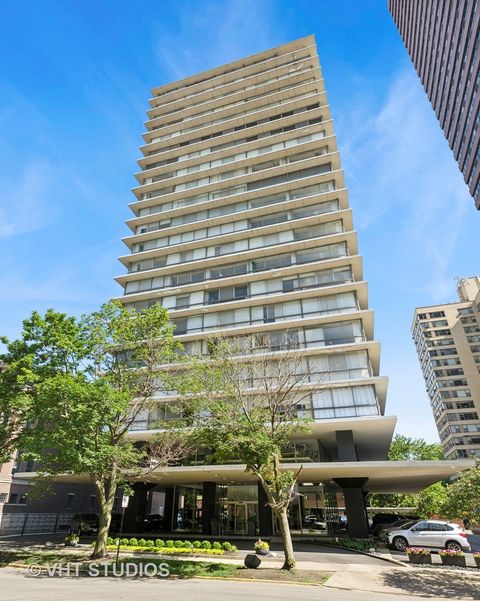
1955
320 W Oakdale Ave, Chicago, IL 60657
$-2,604
Cash flow
-20.3%
Cash-on-Cash Return
1.0%
Cap rate
0.6%
Rent to Value Ratio
Active
$699,000
5
bds
|
4
ba
|
3,058
sqft
|
built
1986
702 Newcastle Ln, Prospect Heights, IL 60070
$-1,725
Cash flow
-12.9%
Cash-on-Cash Return
2.7%
Cap rate
0.6%
Rent to Value Ratio
Active
$559,900
2
bds
|
2
ba
|
1,615
sqft
|
built
1990
401 Park Barrington Dr, Barrington, IL 60010
$-1,407
Cash flow
-13.1%
Cash-on-Cash Return
2.7%
Cap rate
0.6%
Rent to Value Ratio
Active
$264,900
2
bds
|
2
ba
|
1,100
sqft
|
built
2006
5368 W 96th St, Oak Lawn, IL 60453
$-482
Cash flow
-9.5%
Cash-on-Cash Return
3.5%
Cap rate
0.8%
Rent to Value Ratio
Active
$318,000
3
bds
|
2
ba
|
1,491
sqft
|
built
1972
16101 Debra Dr, Oak Forest, IL 60452
$-297
Cash flow
-4.9%
Cash-on-Cash Return
4.6%
Cap rate
0.8%
Rent to Value Ratio
Active
$250,000
2
bds
|
1
ba
|
0
sqft
|
built
1920
6711 N Lakewood Ave, Chicago, IL 60626
$-427
Cash flow
-8.9%
Cash-on-Cash Return
3.6%
Cap rate
0.8%
Rent to Value Ratio
Active
$270,000
4
bds
|
2
ba
|
1,200
sqft
|
built
1975
6230 Streamwood Ln, Matteson, IL 60443
$-244
Cash flow
-4.7%
Cash-on-Cash Return
4.6%
Cap rate
0.9%
Rent to Value Ratio
Active
$329,000
3
bds
|
3
ba
|
1,265
sqft
|
built
1963
11350 S Vincennes Ave, Chicago, IL 60643
$-11
Cash flow
-0.2%
Cash-on-Cash Return
5.6%
Cap rate
0.8%
Rent to Value Ratio

Active
$300,000
2
bds
|
2
ba
|
1,100
sqft
|
built
2007
3450 S Halsted St, Chicago, IL 60608
$-745
Cash flow
-13.0%
Cash-on-Cash Return
2.7%
Cap rate
0.8%
Rent to Value Ratio
Active
$450,000
5
bds
|
3
ba
|
0
sqft
|
built
1911
4138 W Potomac Ave, Chicago, IL 60651
$-1,071
Cash flow
-12.4%
Cash-on-Cash Return
2.8%
Cap rate
0.5%
Rent to Value Ratio
Active
$279,500
4
bds
|
3
ba
|
1,500
sqft
|
built
1976
558 Escanaba Ave, Calumet City, IL 60409
$-398
Cash flow
-7.4%
Cash-on-Cash Return
4.0%
Cap rate
0.7%
Rent to Value Ratio
Active
$248,000
3
bds
|
3
ba
|
1,175
sqft
|
built
1975
2724 Lake Park Dr, Lynwood, IL 60411
$-165
Cash flow
-3.5%
Cash-on-Cash Return
4.9%
Cap rate
0.9%
Rent to Value Ratio
Active
$244,000
3
bds
|
2
ba
|
1,244
sqft
|
built
1977
5110 Arquilla Dr, Richton Park, IL 60471
$-332
Cash flow
-7.1%
Cash-on-Cash Return
4.0%
Cap rate
0.9%
Rent to Value Ratio
Active
$1,090,000
3
bds
|
4
ba
|
3,803
sqft
|
built
2001
11225 Arrowhead Trl, Indian Head Park, IL 60525
$-3,179
Cash flow
-15.2%
Cash-on-Cash Return
2.2%
Cap rate
0.4%
Rent to Value Ratio
Active
$999,000
3
bds
|
5
ba
|
3,919
sqft
|
built
1988
6 Tartan Ridge Rd, Burr Ridge, IL 60527
$-3,307
Cash flow
-17.3%
Cash-on-Cash Return
1.7%
Cap rate
0.5%
Rent to Value Ratio
Active
$264,000
2
bds
|
2
ba
|
1,350
sqft
|
built
1971
5251 Galitz St, Skokie, IL 60077
$-600
Cash flow
-11.9%
Cash-on-Cash Return
2.9%
Cap rate
0.8%
Rent to Value Ratio
Active
$265,000
3
bds
|
2
ba
|
1,000
sqft
|
built
1970
5653 Dover Rd, Oak Forest, IL 60452
$-200
Cash flow
-3.9%
Cash-on-Cash Return
4.8%
Cap rate
0.9%
Rent to Value Ratio
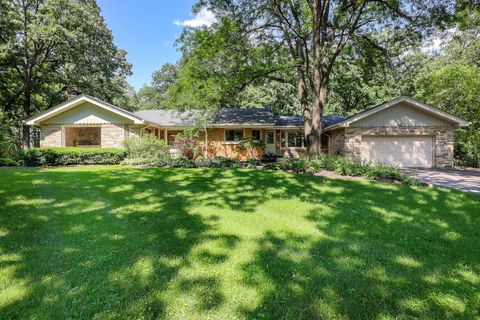
Active
$655,000
3
bds
|
2
ba
|
2,878
sqft
|
built
1952
12525 S Pawnee Rd, Palos Park, IL 60464
$-1,336
Cash flow
-10.6%
Cash-on-Cash Return
3.2%
Cap rate
0.6%
Rent to Value Ratio
Active
$849,900
3
bds
|
4
ba
|
3,619
sqft
|
built
1947
3550 W Ardmore Ave, Chicago, IL 60659
$-1,099
Cash flow
-6.7%
Cash-on-Cash Return
4.1%
Cap rate
0.6%
Rent to Value Ratio
Active
$174,900
3
bds
|
2
ba
|
1,520
sqft
|
built
1876
2911 W Walnut St, Chicago, IL 60612
$-112
Cash flow
-3.3%
Cash-on-Cash Return
4.9%
Cap rate
0.9%
Rent to Value Ratio
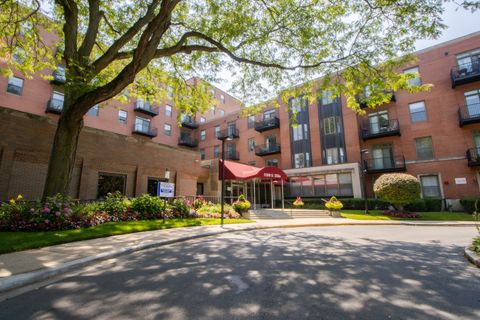
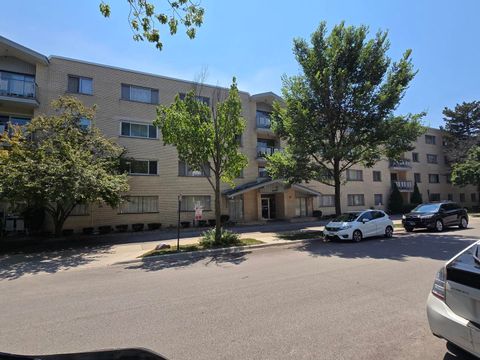
Active
$144,900
1
bds
|
1
ba
|
0
sqft
|
built
1971
5200 S Ellis Ave, Chicago, IL 60615
$-127
Cash flow
-4.6%
Cash-on-Cash Return
4.6%
Cap rate
1.4%
Rent to Value Ratio
Active
$250,000
3
bds
|
2
ba
|
1,800
sqft
|
built
1947
3445 N Schultz Dr, Lansing, IL 60438
$-224
Cash flow
-4.7%
Cash-on-Cash Return
4.6%
Cap rate
1.0%
Rent to Value Ratio
Active
$379,900
3
bds
|
2
ba
|
1,000
sqft
|
built
1964
2304 Oakton St, Park Ridge, IL 60068
$-295
Cash flow
-4.1%
Cash-on-Cash Return
4.7%
Cap rate
0.8%
Rent to Value Ratio
Active
$899,000
7
bds
|
5
ba
|
0
sqft
|
built
2008
1021 South Blvd, Evanston, IL 60202
$-4,013
Cash flow
-23.3%
Cash-on-Cash Return
0.3%
Cap rate
0.2%
Rent to Value Ratio
Active
$569,900
4
bds
|
3
ba
|
2,679
sqft
|
built
1996
10900 Beth Dr, Orland Park, IL 60467
$-593
Cash flow
-5.4%
Cash-on-Cash Return
4.4%
Cap rate
0.8%
Rent to Value Ratio
Active
$315,000
3
bds
|
1
ba
|
1,144
sqft
|
built
1958
4327 Eberly Ave, Brookfield, IL 60513
$-344
Cash flow
-5.7%
Cash-on-Cash Return
4.4%
Cap rate
0.8%
Rent to Value Ratio
Active
$165,900
1
bds
|
1
ba
|
650
sqft
|
built
1942
4950 N Marine Dr, Chicago, IL 60640
$-508
Cash flow
-16.0%
Cash-on-Cash Return
2.0%
Cap rate
1.0%
Rent to Value Ratio
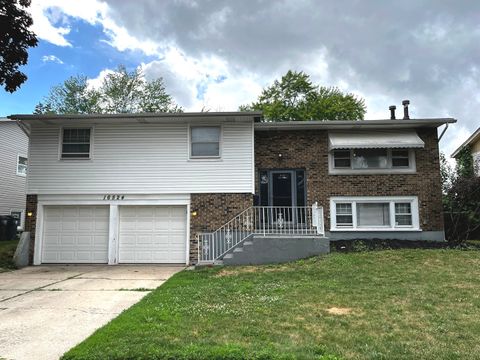
Active
$283,000
3
bds
|
2
ba
|
1,375
sqft
|
built
1974
16524 Woodlawn West Ave, South Holland, IL 60473
$-76
Cash flow
-1.4%
Cash-on-Cash Return
5.4%
Cap rate
1.0%
Rent to Value Ratio
Active
$251,000
4
bds
|
2
ba
|
1,025
sqft
|
built
1964
15726 Avalon Ave, South Holland, IL 60473
$-16
Cash flow
-0.3%
Cash-on-Cash Return
5.6%
Cap rate
1.1%
Rent to Value Ratio
Active
$174,000
2
bds
|
1
ba
|
910
sqft
|
built
1973
565 Fairway View Dr, Wheeling, IL 60090
$-150
Cash flow
-4.5%
Cash-on-Cash Return
4.6%
Cap rate
1.1%
Rent to Value Ratio
Active
$315,000
2
bds
|
2
ba
|
0
sqft
|
built
2004
2919 N Harlem Ave, Chicago, IL 60707
$-460
Cash flow
-7.6%
Cash-on-Cash Return
3.9%
Cap rate
0.8%
Rent to Value Ratio
Active
$399,000
3
bds
|
2
ba
|
1,900
sqft
|
built
1931
2109 W Jarvis Ave, Chicago, IL 60645
$-1,015
Cash flow
-13.3%
Cash-on-Cash Return
2.6%
Cap rate
0.6%
Rent to Value Ratio
Active
$328,900
3
bds
|
2
ba
|
1,875
sqft
|
built
1974
150 Lake Blvd, Buffalo Grove, IL 60089
$-923
Cash flow
-14.6%
Cash-on-Cash Return
2.3%
Cap rate
0.6%
Rent to Value Ratio