Cook County Investment Properties for Sale
Browse homes for sale and investment properties in Cook County. Refine your search by price, property type, or more.
Best cash flowing properties in Cook County
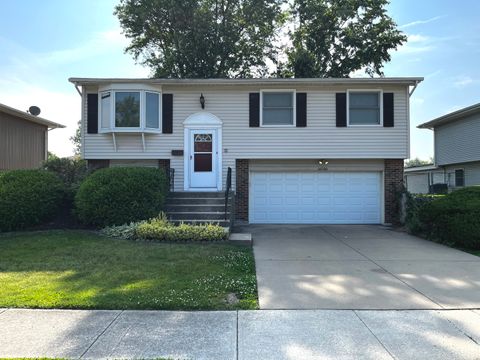
Active
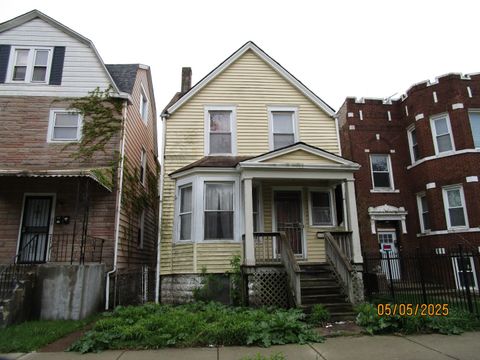
$74,000
3
bds
|
2
ba
|
1,250
sqft
|
built
1905
605 E 92nd Pl, Chicago, IL 60619
$1,271
Cash flow
20.0%
Cash-on-Cash Return
20.6%
Cap rate
2.7%
Rent to Value Ratio
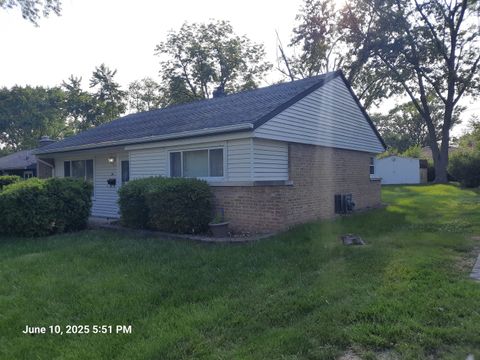
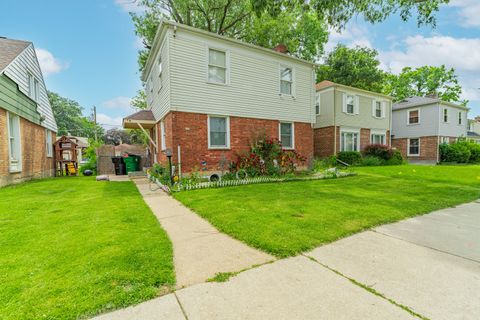
Active
$140,000
2
bds
|
1
ba
|
974
sqft
|
built
1956
6 Marquette Pl, Park Forest, IL 60466
$418
Cash flow
15.6%
Cash-on-Cash Return
9.3%
Cap rate
1.4%
Rent to Value Ratio
4,738 out of 5,507 properties for sale in Cook County
Limited Results Shown
Create a free account, or log in to reveal all property listings and enjoy the complete experience.
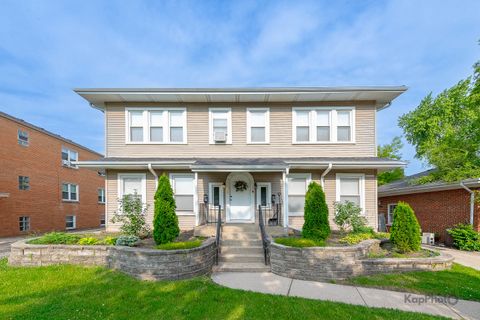
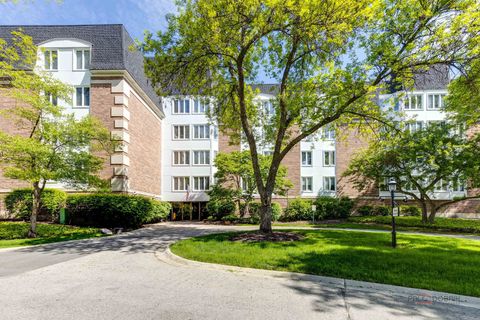
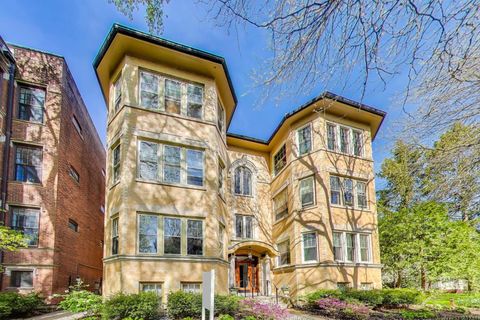
Active
$599,000
4
bds
|
3
ba
|
0
sqft
|
built
1926
818 N La Grange Rd, La Grange Park, IL 60526
$-1,251
Cash flow
-10.9%
Cash-on-Cash Return
3.2%
Cap rate
0.7%
Rent to Value Ratio
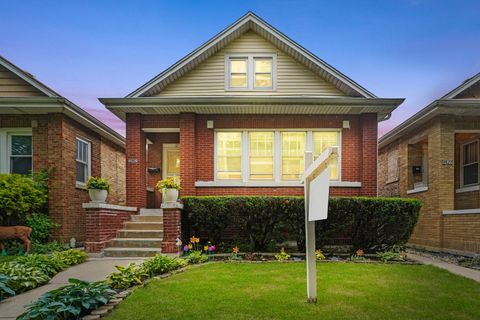
Active
$394,900
4
bds
|
2
ba
|
976
sqft
|
built
1923
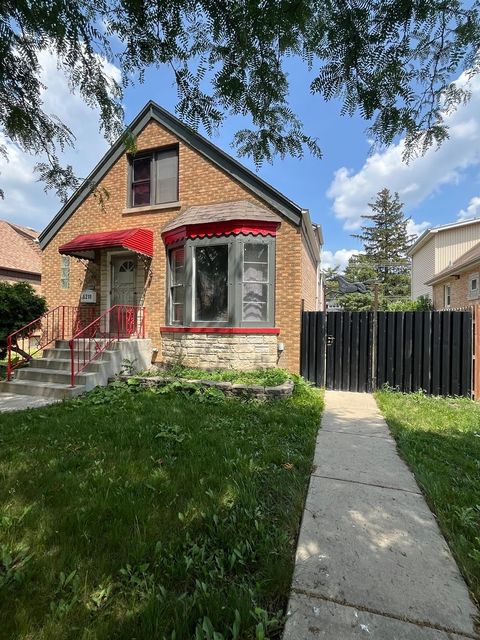
4624 W Montana St, Chicago, IL 60639
$-493
Cash flow
-6.5%
Cash-on-Cash Return
4.2%
Cap rate
0.7%
Rent to Value Ratio
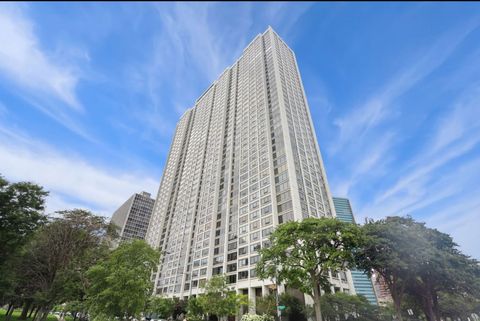
Active
$299,000
1
bds
|
1
ba
|
0
sqft
|
built
2004
1040 W Adams St, Chicago, IL 60607
$-586
Cash flow
-10.2%
Cash-on-Cash Return
3.3%
Cap rate
0.8%
Rent to Value Ratio
Active
$500,000
10
bds
|
4
ba
|
0
sqft
|
built
1928
8012 S Honore St, Chicago, IL 60620
$-1,260
Cash flow
-13.1%
Cash-on-Cash Return
2.7%
Cap rate
0.4%
Rent to Value Ratio
Active
$350,000
4
bds
|
2
ba
|
0
sqft
|
built
1898
2330 S Homan Ave, Chicago, IL 60623
$-581
Cash flow
-8.7%
Cash-on-Cash Return
3.7%
Cap rate
0.5%
Rent to Value Ratio
Active
$224,000
3
bds
|
2
ba
|
1,190
sqft
|
built
1949
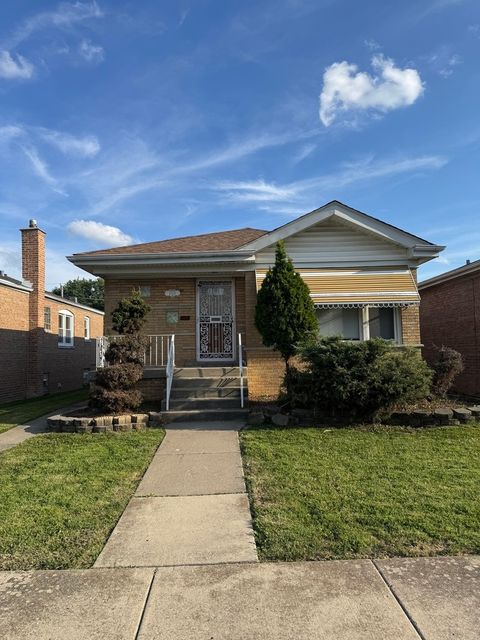
9739 S Ellis Ave, Chicago, IL 60628
$375
Cash flow
8.7%
Cash-on-Cash Return
7.7%
Cap rate
1.0%
Rent to Value Ratio
Active
$234,900
3
bds
|
2
ba
|
1,507
sqft
|
built
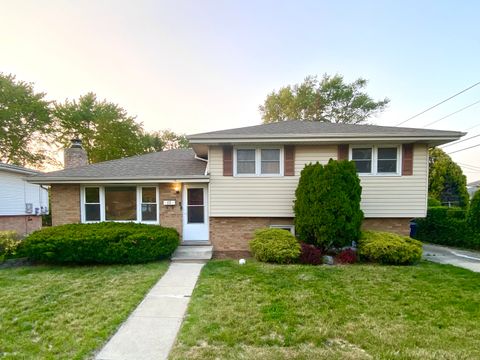
1974
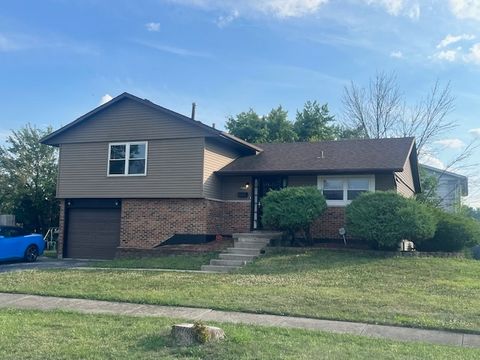
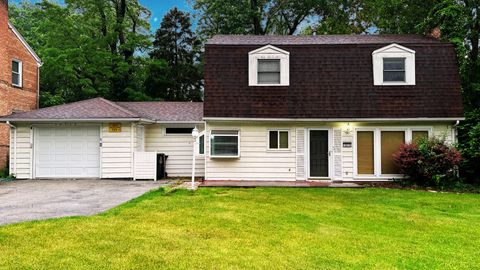
3501 Fountainbleau Dr, Hazel Crest, IL 60429
$-14
Cash flow
-0.3%
Cash-on-Cash Return
5.6%
Cap rate
1.1%
Rent to Value Ratio
Active
$269,000
6
bds
|
2
ba
|
0
sqft
|
built
1925
1721 W Steuben St, Chicago, IL 60643
$215
Cash flow
4.2%
Cash-on-Cash Return
6.6%
Cap rate
0.9%
Rent to Value Ratio

Active
$399,000
3
bds
|
2
ba
|
1,050
sqft
|
built
1968
4534 N Narragansett Ave, Harwood Heights, IL 60706
$-431
Cash flow
-5.6%
Cash-on-Cash Return
4.4%
Cap rate
0.7%
Rent to Value Ratio
Active
$645,000
4
bds
|
3
ba
|
0
sqft
|
built
1924
3247 W Berteau Ave, Chicago, IL 60618
$-2,188
Cash flow
-17.7%
Cash-on-Cash Return
1.6%
Cap rate
0.4%
Rent to Value Ratio
Active
$347,000
3
bds
|
2
ba
|
1,140
sqft
|
built
1925
1307 N 20th Ave, Melrose Park, IL 60160
$-260
Cash flow
-3.9%
Cash-on-Cash Return
4.8%
Cap rate
0.7%
Rent to Value Ratio
Active
$182,000
2
bds
|
1
ba
|
1,012
sqft
|
built
1957
601 E 32nd St, Chicago, IL 60616
$-615
Cash flow
-17.6%
Cash-on-Cash Return
1.6%
Cap rate
1.2%
Rent to Value Ratio
Active
$228,000
2
bds
|
2
ba
|
1,500
sqft
|
built
1972
8815 W Golf Rd, Niles, IL 60714
$-439
Cash flow
-10.0%
Cash-on-Cash Return
3.4%
Cap rate
1.0%
Rent to Value Ratio
Active
$440,000
3
bds
|
3
ba
|
1,549
sqft
|
built
1976
4 Kingsport Dr, Schaumburg, IL 60193
$-657
Cash flow
-7.8%
Cash-on-Cash Return
3.9%
Cap rate
0.7%
Rent to Value Ratio
Active
$219,999
2
bds
|
1
ba
|
1,000
sqft
|
built
1974
8473 Archer Ave, Willow Springs, IL 60480
$-88
Cash flow
-2.1%
Cash-on-Cash Return
5.2%
Cap rate
0.9%
Rent to Value Ratio
Active
$439,900
3
bds
|
2
ba
|
1,896
sqft
|
built
1948
2028 N 72nd Ct, Elmwood Park, IL 60707
$-472
Cash flow
-5.6%
Cash-on-Cash Return
4.4%
Cap rate
0.7%
Rent to Value Ratio
Active
$550,000
2
bds
|
2
ba
|
1,250
sqft
|
built
2000
1301 W Washington Blvd, Chicago, IL 60607
$-1,418
Cash flow
-13.5%
Cash-on-Cash Return
2.6%
Cap rate
0.7%
Rent to Value Ratio
Active
$495,000
4
bds
|
2
ba
|
2,491
sqft
|
built
1921
2733 Wesley Ave, Berwyn, IL 60402
$-1,214
Cash flow
-12.8%
Cash-on-Cash Return
2.7%
Cap rate
0.6%
Rent to Value Ratio
Active
$404,900
4
bds
|
2
ba
|
1,598
sqft
|
built
1953
1937 N Normandy Ave, Chicago, IL 60707
$-123
Cash flow
-1.6%
Cash-on-Cash Return
5.3%
Cap rate
0.8%
Rent to Value Ratio
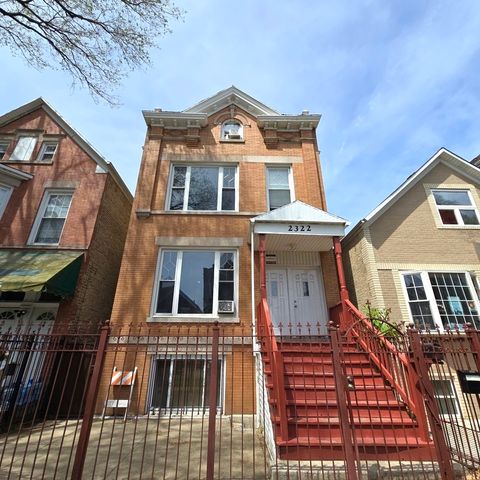
Active
$400,000
6
bds
|
4
ba
|
0
sqft
|
built
1889
2322 S Trumbull Ave, Chicago, IL 60623
$-1,103
Cash flow
-14.4%
Cash-on-Cash Return
2.4%
Cap rate
0.4%
Rent to Value Ratio
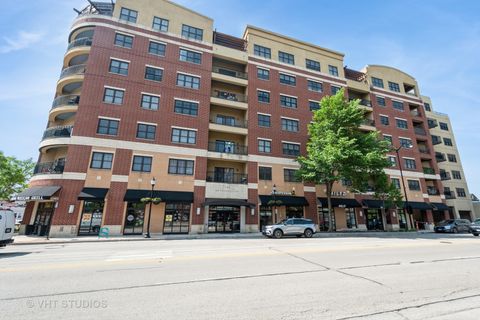
Active
$415,000
2
bds
|
2
ba
|
1,875
sqft
|
built
2007
4953 Oakton St, Skokie, IL 60077
$-1,520
Cash flow
-19.1%
Cash-on-Cash Return
1.3%
Cap rate
0.8%
Rent to Value Ratio
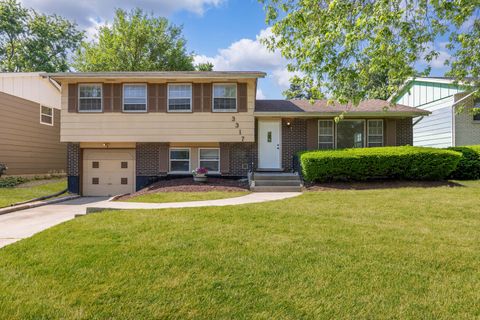
Active
$189,000
3
bds
|
2
ba
|
1,223
sqft
|
built
1971
3317 Birchwood Dr, Hazel Crest, IL 60429
$191
Cash flow
5.3%
Cash-on-Cash Return
6.9%
Cap rate
1.3%
Rent to Value Ratio
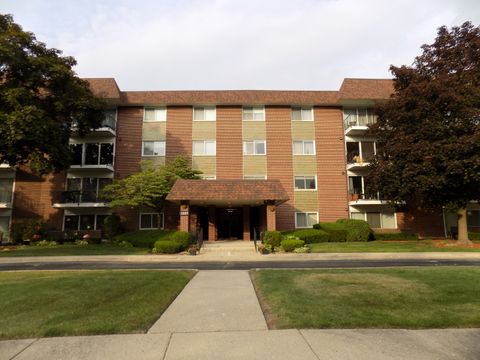
Active
$252,900
2
bds
|
2
ba
|
1,350
sqft
|
built
1974
1025 S Fernandez Ave, Arlington Heights, IL 60005
$-816
Cash flow
-16.8%
Cash-on-Cash Return
1.8%
Cap rate
0.6%
Rent to Value Ratio
Active
$399,900
4
bds
|
1
ba
|
1,600
sqft
|
built
1920
6211 N Harlem Ave, Chicago, IL 60631
$-626
Cash flow
-8.2%
Cash-on-Cash Return
3.8%
Cap rate
0.7%
Rent to Value Ratio
Active
$245,000
3
bds
|
2
ba
|
1,141
sqft
|
built
1967
112 E 160th Pl, South Holland, IL 60473
$82
Cash flow
1.7%
Cash-on-Cash Return
6.1%
Cap rate
1.1%
Rent to Value Ratio
Active
$299,000
2
bds
|
2
ba
|
1,450
sqft
|
built
1976
225 Lake Blvd, Buffalo Grove, IL 60089
$-475
Cash flow
-8.3%
Cash-on-Cash Return
3.8%
Cap rate
1.0%
Rent to Value Ratio
Active
$275,000
3
bds
|
2
ba
|
1,008
sqft
|
built
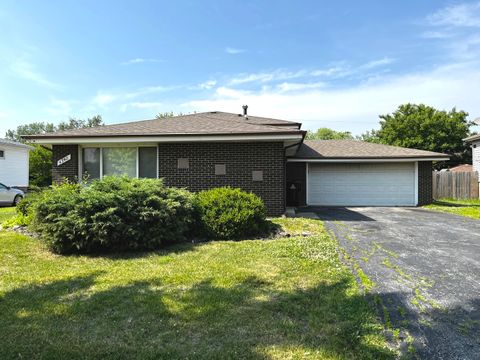
1967
4348 Mann St, Oak Forest, IL 60452
$-203
Cash flow
-3.9%
Cash-on-Cash Return
4.8%
Cap rate
0.9%
Rent to Value Ratio
Active
$337,000
3
bds
|
2
ba
|
1,400
sqft
|
built
1973
16500 76th Ave, Tinley Park, IL 60477
$-323
Cash flow
-5.0%
Cash-on-Cash Return
4.5%
Cap rate
0.8%
Rent to Value Ratio
Active
$305,000
2
bds
|
2
ba
|
1,020
sqft
|
built
1944
759 Norfolk Ave, Westchester, IL 60154
$-130
Cash flow
-2.2%
Cash-on-Cash Return
5.2%
Cap rate
0.9%
Rent to Value Ratio
Active
$599,000
3
bds
|
2
ba
|
2,238
sqft
|
built
1925
918 Michigan Ave, Evanston, IL 60202
$-1,988
Cash flow
-17.3%
Cash-on-Cash Return
1.7%
Cap rate
0.6%
Rent to Value Ratio
Active
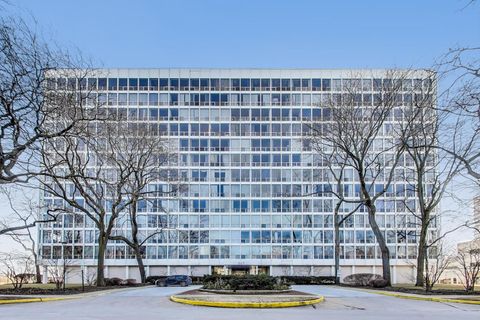
$524,900
2
bds
|
2
ba
|
1,350
sqft
|
built
1969
2800 N Lake Shore Dr, Chicago, IL 60657
$-1,617
Cash flow
-16.1%
Cash-on-Cash Return
2.0%
Cap rate
0.7%
Rent to Value Ratio
Active
$290,000
2
bds
|
2
ba
|
1,038
sqft
|
built
1956
2115 W 82nd Pl, Chicago, IL 60620
$-205
Cash flow
-3.7%
Cash-on-Cash Return
4.8%
Cap rate
0.7%
Rent to Value Ratio
Active
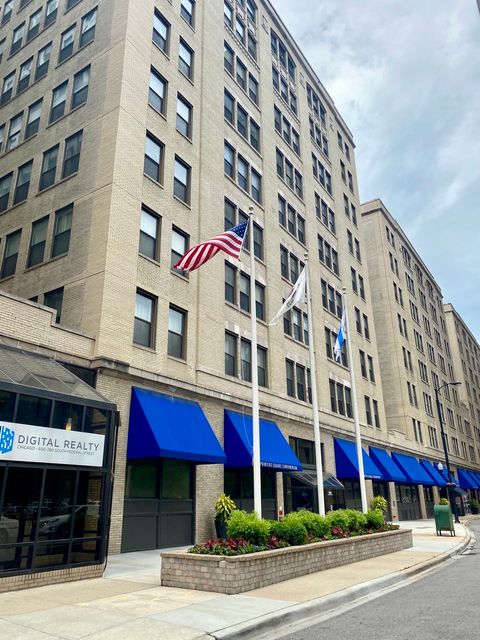
$122,500
bds
|
1
ba
|
594
sqft
|
built
1913
640 S Federal St, Chicago, IL 60605
$19
Cash flow
0.8%
Cash-on-Cash Return
5.9%
Cap rate
1.5%
Rent to Value Ratio
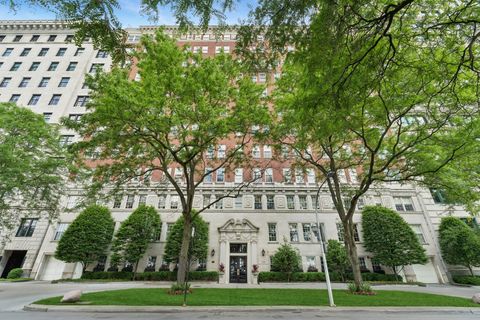
Active
$1,525,000
3
bds
|
3
ba
|
2,200
sqft
|
built
1922
219 E Lake Shore Dr, Chicago, IL 60611
$-8,199
Cash flow
-28.1%
Cash-on-Cash Return
-0.8%
Cap rate
0.4%
Rent to Value Ratio
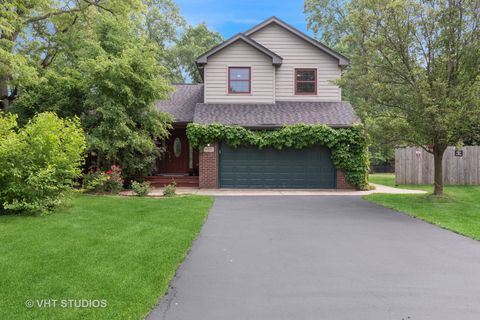
Active
$495,000
3
bds
|
4
ba
|
1,739
sqft
|
built
2005
4335 Dewey Ave, Matteson, IL 60443
$-1,239
Cash flow
-13.1%
Cash-on-Cash Return
2.7%
Cap rate
0.5%
Rent to Value Ratio
Active
$276,000
4
bds
|
2
ba
|
1,950
sqft
|
built
1954
18210 Perth Ave, Homewood, IL 60430
$-295
Cash flow
-5.6%
Cash-on-Cash Return
4.4%
Cap rate
0.9%
Rent to Value Ratio
Active
$268,000
3
bds
|
1
ba
|
1,150
sqft
|
built
1922
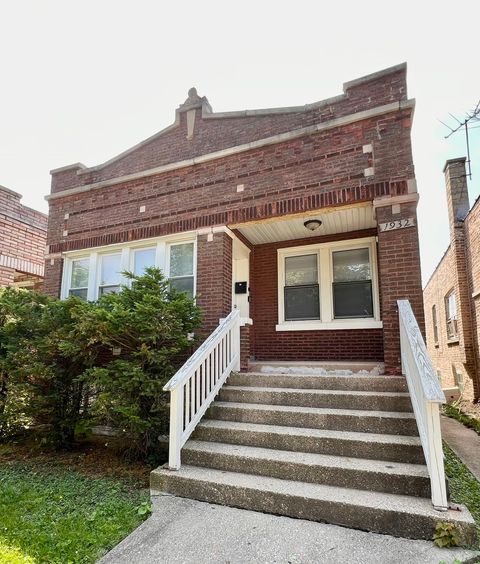
1932 S 59th Ave, Cicero, IL 60804
$-257
Cash flow
-5.0%
Cash-on-Cash Return
4.5%
Cap rate
0.8%
Rent to Value Ratio
Active
$229,900
3
bds
|
2
ba
|
1,471
sqft
|
built
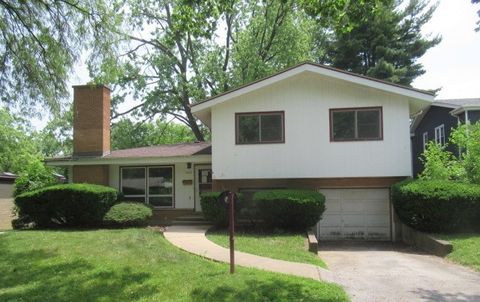
1959
3636 Elm Ct, Flossmoor, IL 60422
$-76
Cash flow
-1.7%
Cash-on-Cash Return
5.3%
Cap rate
1.2%
Rent to Value Ratio