Cook County Investment Properties for Sale
Browse homes for sale and investment properties in Cook County. Refine your search by price, property type, or more.
Best cash flowing properties in Cook County
Active
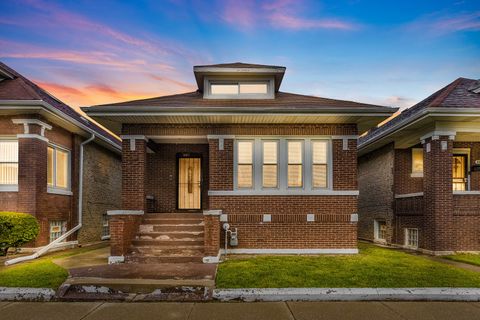
$185,000
4
bds
|
1
ba
|
1,250
sqft
|
built
1920
8011 S Ada St, Chicago, IL 60620
$586
Cash flow
16.5%
Cash-on-Cash Return
9.5%
Cap rate
1.4%
Rent to Value Ratio
Active
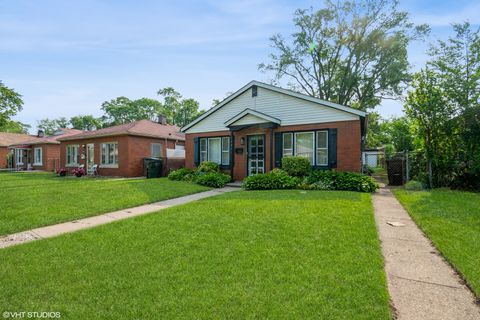
$110,000
2
bds
|
1
ba
|
975
sqft
|
built
1950
14841 Langley Ave, Dolton, IL 60419
$454
Cash flow
21.5%
Cash-on-Cash Return
10.6%
Cap rate
1.8%
Rent to Value Ratio
5,285 out of 6,119 properties for sale in Cook County
Limited Results Shown
Create a free account, or log in to reveal all property listings and enjoy the complete experience.
Active
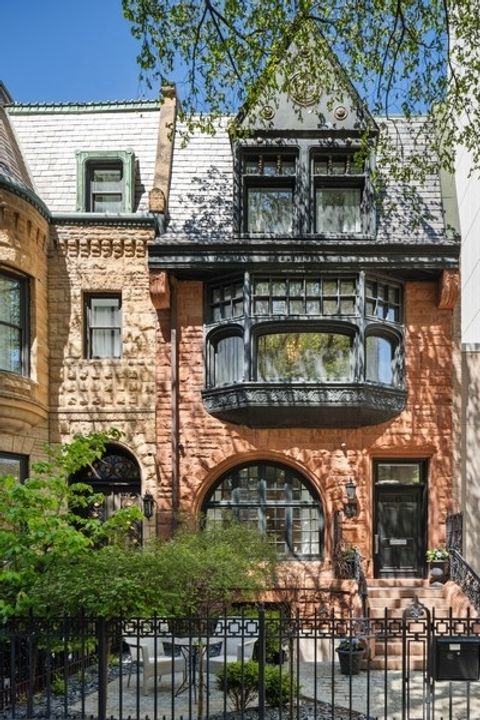
$3,500,000
5
bds
|
7
ba
|
6,500
sqft
|
built
1885
34 E Bellevue Pl, Chicago, IL 60611
$-16,481
Cash flow
-24.6%
Cash-on-Cash Return
0.0%
Cap rate
0.3%
Rent to Value Ratio
Active
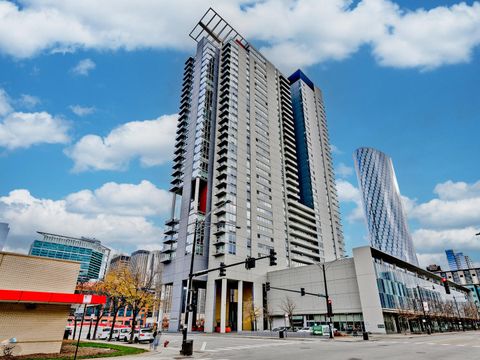
$669,000
2
bds
|
3
ba
|
1,512
sqft
|
built
2004
737 W Washington Blvd, Chicago, IL 60661
$-2,468
Cash flow
-19.2%
Cash-on-Cash Return
1.3%
Cap rate
0.7%
Rent to Value Ratio
Active
$84,900
4
bds
|
2
ba
|
0
sqft
|
built
1902
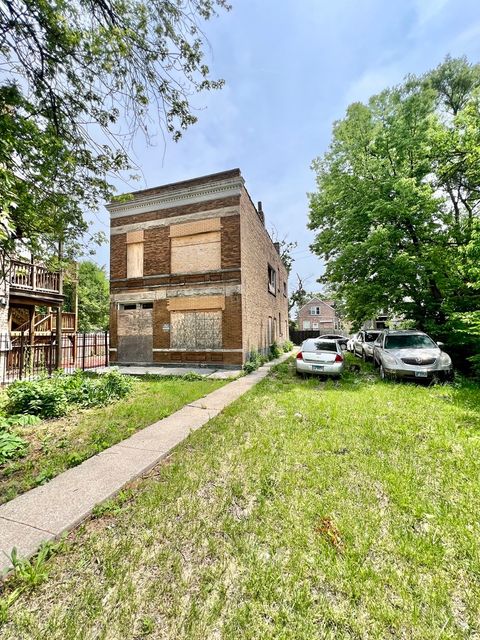
1539 S Harding Ave, Chicago, IL 60623
$353
Cash flow
21.7%
Cash-on-Cash Return
10.7%
Cap rate
1.6%
Rent to Value Ratio
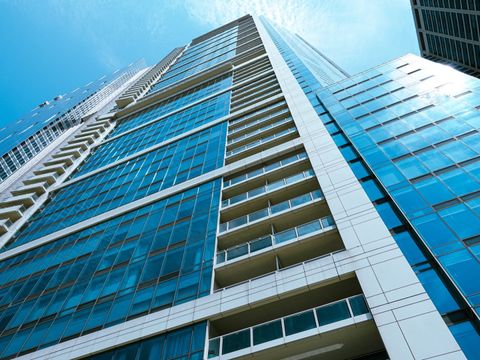
Active
$565,000
1
bds
|
2
ba
|
1,244
sqft
|
built
2007
340 E Randolph St, Chicago, IL 60601
$-1,808
Cash flow
-16.7%
Cash-on-Cash Return
1.8%
Cap rate
0.7%
Rent to Value Ratio
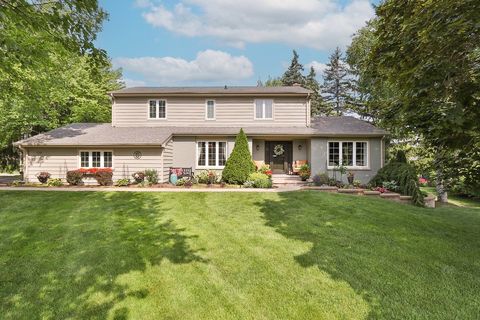
Active
$675,000
4
bds
|
3
ba
|
2,537
sqft
|
built
1978
110 Tudor Dr, Barrington, IL 60010
$-1,431
Cash flow
-11.1%
Cash-on-Cash Return
3.1%
Cap rate
0.5%
Rent to Value Ratio
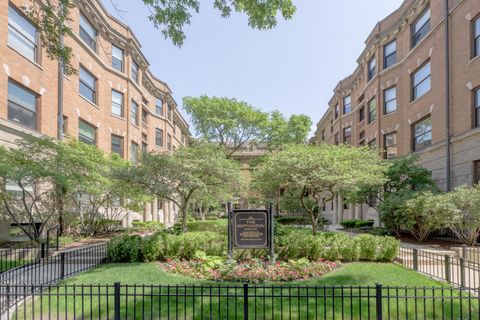
Active
$430,000
4
bds
|
3
ba
|
2,400
sqft
|
built
1904
668 W Irving Park Rd, Chicago, IL 60613
$-2,231
Cash flow
-27.1%
Cash-on-Cash Return
-0.5%
Cap rate
0.7%
Rent to Value Ratio
Active
$206,000
2
bds
|
2
ba
|
1,468
sqft
|
built
1956
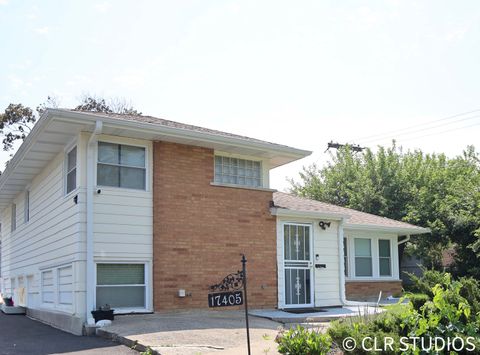
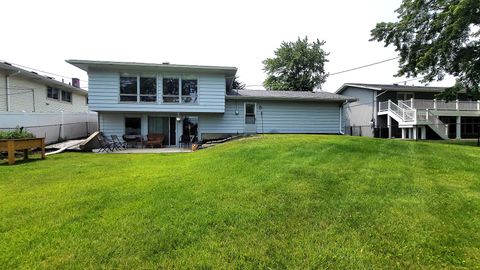
17405 Longfellow Ave, Hazel Crest, IL 60429
$80
Cash flow
2.0%
Cash-on-Cash Return
6.1%
Cap rate
1.2%
Rent to Value Ratio
Active
$510,000
4
bds
|
3
ba
|
2,200
sqft
|
built
1966
1360 Devonshire Ln, Hoffman Estates, IL 60169
$-1,179
Cash flow
-12.1%
Cash-on-Cash Return
2.9%
Cap rate
0.6%
Rent to Value Ratio
Active
$524,900
2
bds
|
2
ba
|
1,460
sqft
|
built
2008
8 E Randolph St, Chicago, IL 60601
$-1,962
Cash flow
-19.5%
Cash-on-Cash Return
1.2%
Cap rate
0.7%
Rent to Value Ratio
Active
$369,900
5
bds
|
3
ba
|
0
sqft
|
built
1925
7544 S Sangamon St, Chicago, IL 60620
$-636
Cash flow
-9.0%
Cash-on-Cash Return
3.6%
Cap rate
0.6%
Rent to Value Ratio
Active
$135,000
2
bds
|
2
ba
|
1,123
sqft
|
built
1968
9740 S Pulaski Rd, Oak Lawn, IL 60453
$48
Cash flow
1.9%
Cash-on-Cash Return
6.1%
Cap rate
1.3%
Rent to Value Ratio
Active
$279,900
4
bds
|
2
ba
|
2,404
sqft
|
built
1947
9303 W 119th St, Palos Park, IL 60464
$194
Cash flow
3.6%
Cash-on-Cash Return
6.5%
Cap rate
1.1%
Rent to Value Ratio

Active
$729,000
4
bds
|
5
ba
|
3,586
sqft
|
built
2005
105 Black Hill Dr, Streamwood, IL 60107
$-1,960
Cash flow
-14.0%
Cash-on-Cash Return
2.5%
Cap rate
0.5%
Rent to Value Ratio
Active
$364,900
1
bds
|
1
ba
|
1,138
sqft
|
built
1910
400 S Green St, Chicago, IL 60607
$-714
Cash flow
-10.2%
Cash-on-Cash Return
3.3%
Cap rate
0.8%
Rent to Value Ratio
Active
$209,990
bds
|
1
ba
|
642
sqft
|
built
1991
474 N Lake Shore Dr, Chicago, IL 60611
$-628
Cash flow
-15.6%
Cash-on-Cash Return
2.1%
Cap rate
0.9%
Rent to Value Ratio
Active
$649,900
3
bds
|
3
ba
|
2,800
sqft
|
built
1977
903 Jarvis Ave, Des Plaines, IL 60018
$-1,800
Cash flow
-14.5%
Cash-on-Cash Return
2.4%
Cap rate
0.4%
Rent to Value Ratio
Active
$200,000
3
bds
|
2
ba
|
1,267
sqft
|
built
1978
14327 Lincoln Ave, Dolton, IL 60419
$84
Cash flow
2.2%
Cash-on-Cash Return
6.2%
Cap rate
1.3%
Rent to Value Ratio
Active
$439,900
2
bds
|
2
ba
|
1,050
sqft
|
built
1991
111 W Maple St, Chicago, IL 60610
$-1,071
Cash flow
-12.7%
Cash-on-Cash Return
2.8%
Cap rate
0.8%
Rent to Value Ratio
Active
$554,900
3
bds
|
5
ba
|
2,600
sqft
|
built
2012
4355 S Lake Park Ave, Chicago, IL 60653
$-827
Cash flow
-7.8%
Cash-on-Cash Return
3.9%
Cap rate
0.7%
Rent to Value Ratio
Active
$829,900
4
bds
|
3
ba
|
0
sqft
|
built
1952
8318 Kilbourn Ave, Skokie, IL 60076
$-2,675
Cash flow
-16.8%
Cash-on-Cash Return
1.8%
Cap rate
0.4%
Rent to Value Ratio
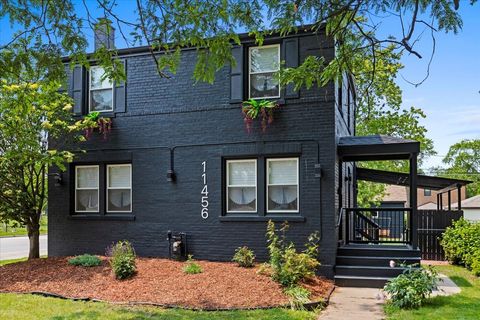
Active
$425,000
4
bds
|
2
ba
|
1,727
sqft
|
built
1942
11456 S Talman Ave, Chicago, IL 60655
$-363
Cash flow
-4.5%
Cash-on-Cash Return
4.7%
Cap rate
0.7%
Rent to Value Ratio
Active
$84,999
2
bds
|
2
ba
|
0
sqft
|
built
1923
18340 Glen Oak Ave, Lansing, IL 60438
$157
Cash flow
9.6%
Cash-on-Cash Return
7.9%
Cap rate
1.6%
Rent to Value Ratio
Active
$185,000
2
bds
|
2
ba
|
1,270
sqft
|
built
1976
7234 W North Ave, Elmwood Park, IL 60707
$-140
Cash flow
-3.9%
Cash-on-Cash Return
4.8%
Cap rate
1.4%
Rent to Value Ratio
Active
$559,900
2
bds
|
3
ba
|
2,244
sqft
|
built
2001
26 Laughry Ln, Palos Park, IL 60464
$-1,545
Cash flow
-14.4%
Cash-on-Cash Return
2.4%
Cap rate
0.6%
Rent to Value Ratio
Active
$145,000
3
bds
|
2
ba
|
1,209
sqft
|
built
1959
333 Illinois St, Park Forest, IL 60466
$-118
Cash flow
-4.2%
Cash-on-Cash Return
4.7%
Cap rate
1.4%
Rent to Value Ratio
Active
$750,000
3
bds
|
2
ba
|
1,345
sqft
|
built
1908
1531 Wilmette Ave, Wilmette, IL 60091
$-1,064
Cash flow
-7.4%
Cash-on-Cash Return
4.0%
Cap rate
0.6%
Rent to Value Ratio
Active
$124,900
3
bds
|
1
ba
|
1,000
sqft
|
built
1952
142 Marquette St, Park Forest, IL 60466
$57
Cash flow
2.4%
Cash-on-Cash Return
6.2%
Cap rate
1.6%
Rent to Value Ratio
Active
$575,000
5
bds
|
3
ba
|
2,100
sqft
|
built
1928
2950 N Lowell Ave, Chicago, IL 60641
$-1,230
Cash flow
-11.2%
Cash-on-Cash Return
3.1%
Cap rate
0.5%
Rent to Value Ratio
Active
$850,000
3
bds
|
3
ba
|
2,600
sqft
|
built
2004
334 N Jefferson St, Chicago, IL 60661
$-1,538
Cash flow
-9.4%
Cash-on-Cash Return
3.5%
Cap rate
0.8%
Rent to Value Ratio
Active
$238,000
1
bds
|
1
ba
|
765
sqft
|
built
1983
10 E Ontario St, Chicago, IL 60611
$-602
Cash flow
-13.2%
Cash-on-Cash Return
2.6%
Cap rate
0.8%
Rent to Value Ratio
Active
$355,500
2
bds
|
4
ba
|
1,801
sqft
|
built
1996
18324 Pond View Ct, Tinley Park, IL 60477
$-367
Cash flow
-5.4%
Cash-on-Cash Return
4.4%
Cap rate
0.9%
Rent to Value Ratio
Active
$185,000
2
bds
|
2
ba
|
1,000
sqft
|
built
1977
10210 Washington Ave, Oak Lawn, IL 60453
$34
Cash flow
1.0%
Cash-on-Cash Return
5.9%
Cap rate
1.2%
Rent to Value Ratio
Active
$169,500
1
bds
|
1
ba
|
0
sqft
|
built
1979
5117 N East River Rd, Chicago, IL 60656
$-197
Cash flow
-6.1%
Cash-on-Cash Return
4.3%
Cap rate
0.8%
Rent to Value Ratio
Active
$399,999
8
bds
|
4
ba
|
0
sqft
|
built
1920
1044 W 34th Pl, Chicago, IL 60608
$-1,008
Cash flow
-13.1%
Cash-on-Cash Return
2.7%
Cap rate
0.6%
Rent to Value Ratio
Active
$275,000
3
bds
|
2
ba
|
2,000
sqft
|
built
1968
6833 N Kedzie Ave, Chicago, IL 60645
$-788
Cash flow
-15.0%
Cash-on-Cash Return
2.2%
Cap rate
0.9%
Rent to Value Ratio
Active
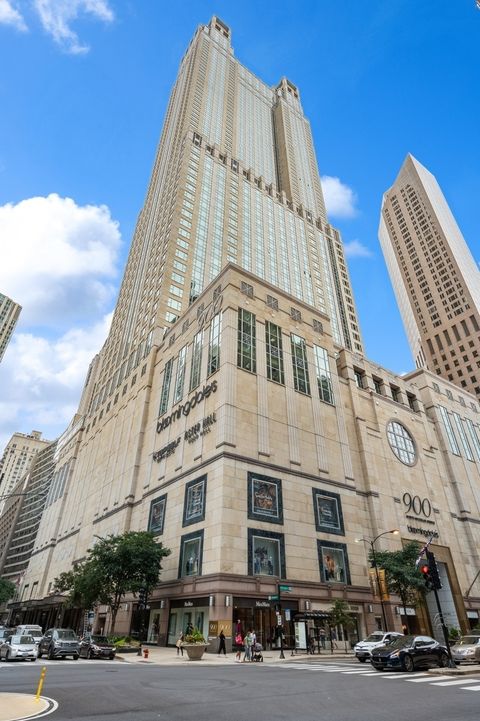
$1,900,000
3
bds
|
3
ba
|
2,746
sqft
|
built
1989
132 E Delaware Pl, Chicago, IL 60611
$-7,976
Cash flow
-21.9%
Cash-on-Cash Return
0.6%
Cap rate
0.5%
Rent to Value Ratio
Active
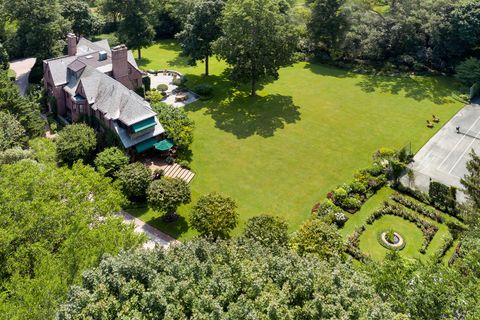
$4,599,000
6
bds
|
6
ba
|
6,639
sqft
|
built
1927
22 Indian Hill Rd, Winnetka, IL 60093
$-21,380
Cash flow
-24.3%
Cash-on-Cash Return
0.1%
Cap rate
0.2%
Rent to Value Ratio
Active
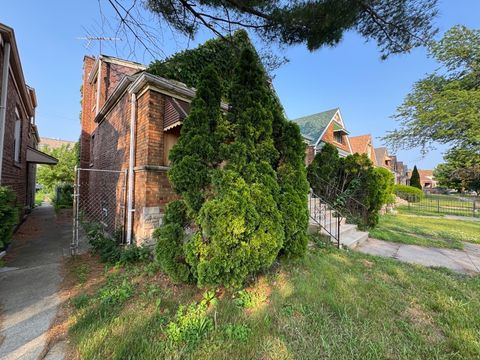
$150,000
4
bds
|
2
ba
|
948
sqft
|
built
1952
8371 S Baltimore Ave, Chicago, IL 60617
$383
Cash flow
13.3%
Cash-on-Cash Return
8.7%
Cap rate
1.2%
Rent to Value Ratio