Cook County Investment Properties for Sale
Browse homes for sale and investment properties in Cook County. Refine your search by price, property type, or more.
Best cash flowing properties in Cook County
Active
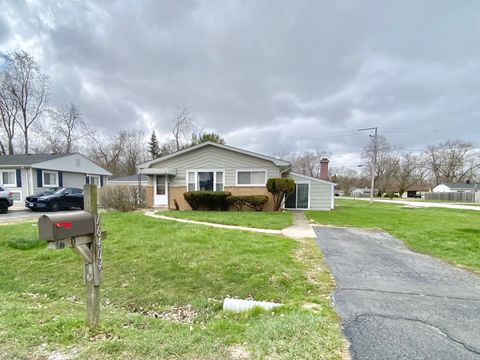
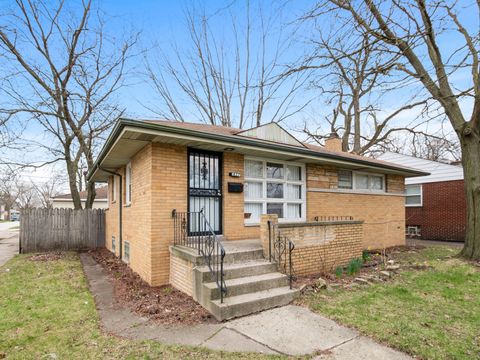
$81,000
3
bds
|
1
ba
|
1,044
sqft
|
built
1923
620 W 111th St, Chicago, IL 60628
$979
Cash flow
63.1%
Cash-on-Cash Return
20.2%
Cap rate
2.5%
Rent to Value Ratio
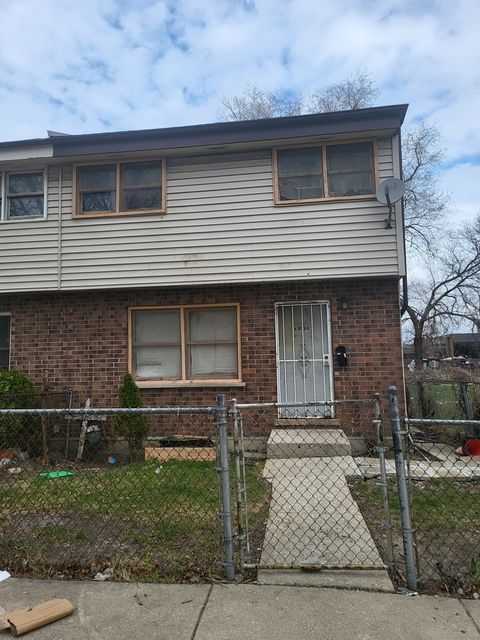
Active
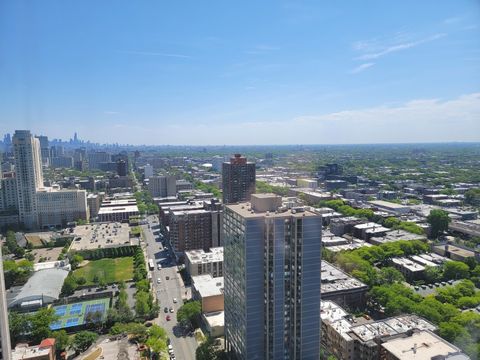
$158,900
3
bds
|
1
ba
|
1,650
sqft
|
built
1959
16641 Honore Ave, Markham, IL 60428
$934
Cash flow
30.7%
Cash-on-Cash Return
12.7%
Cap rate
1.6%
Rent to Value Ratio
4,766 out of 5,543 properties for sale in Cook County
Limited Results Shown
Create a free account, or log in to reveal all property listings and enjoy the complete experience.
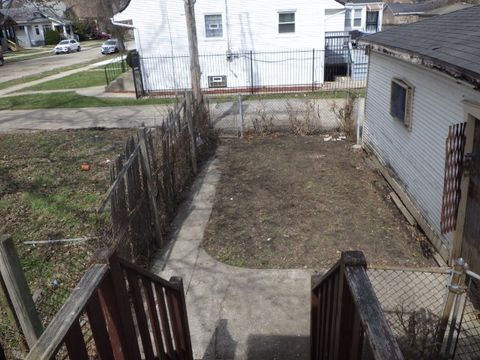
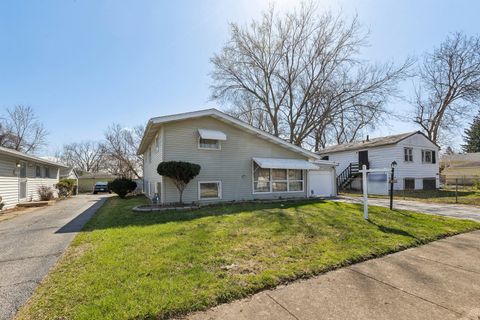
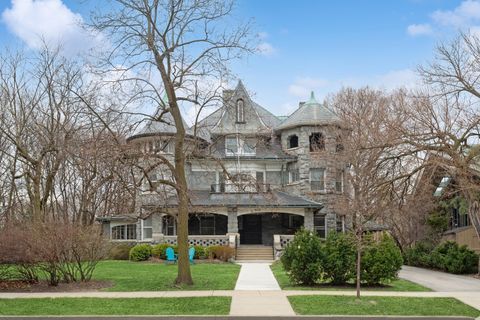
Active
$1,270,000
4
bds
|
4
ba
|
0
sqft
|
built
1889
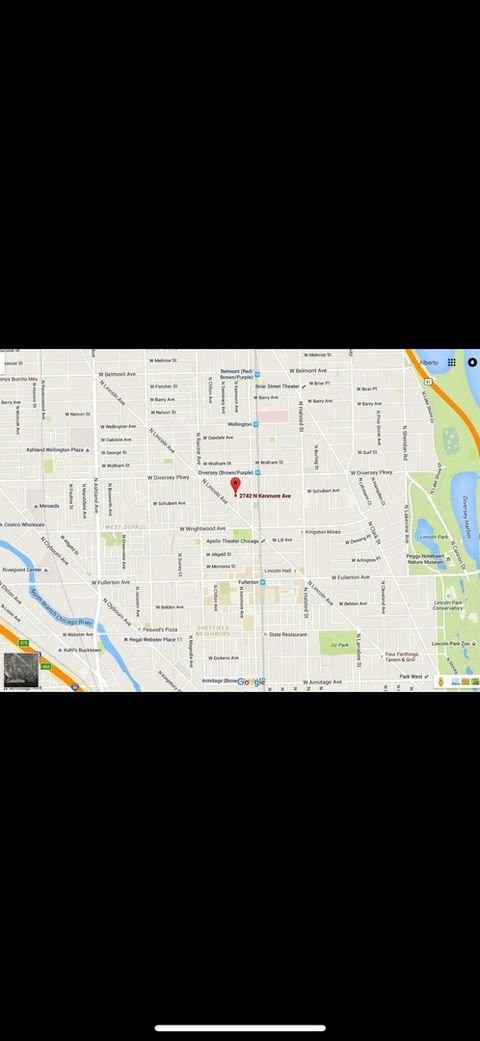
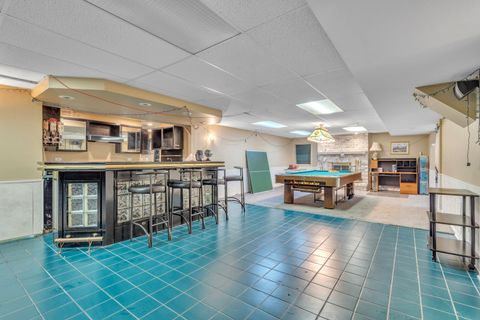
2742 N Kenmore Ave, Chicago, IL 60614
$-4,062
Cash flow
-16.7%
Cash-on-Cash Return
1.8%
Cap rate
0.4%
Rent to Value Ratio
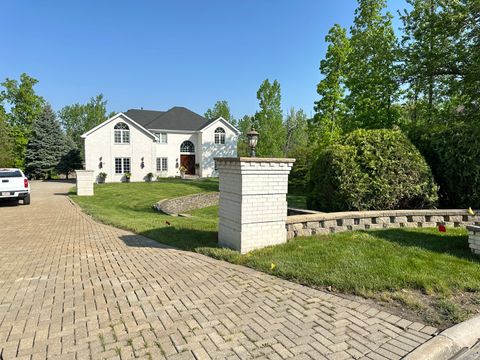
Active
$799,000
6
bds
|
5
ba
|
4,468
sqft
|
built
1992
8005 Trafalgar Ct, Orland Park, IL 60462
$-1,530
Cash flow
-10.0%
Cash-on-Cash Return
3.4%
Cap rate
0.6%
Rent to Value Ratio
Active
$430,000
8
bds
|
4
ba
|
0
sqft
|
built
1905
5729 S Michigan Ave, Chicago, IL 60637
$-971
Cash flow
-11.8%
Cash-on-Cash Return
3.0%
Cap rate
0.5%
Rent to Value Ratio
Active
$575,000
4
bds
|
4
ba
|
4,080
sqft
|
built
1983
8850 W 101st Pl, Palos Hills, IL 60465
$-952
Cash flow
-8.6%
Cash-on-Cash Return
3.7%
Cap rate
0.8%
Rent to Value Ratio
Active
$115,000
5
bds
|
2
ba
|
0
sqft
|
built
1888
15544 Turlington Ave, Harvey, IL 60426
$346
Cash flow
15.7%
Cash-on-Cash Return
9.3%
Cap rate
1.7%
Rent to Value Ratio
Active
$185,000
2
bds
|
2
ba
|
1,100
sqft
|
built
1988
4924 Circle Ct, Crestwood, IL 60418
$-121
Cash flow
-3.4%
Cash-on-Cash Return
4.9%
Cap rate
1.0%
Rent to Value Ratio
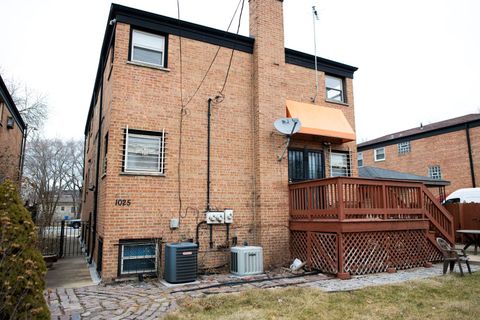
Active
$329,900
5
bds
|
4
ba
|
0
sqft
|
built
1963
1025 E 93rd St, Chicago, IL 60619
$-334
Cash flow
-5.3%
Cash-on-Cash Return
4.5%
Cap rate
0.7%
Rent to Value Ratio
Active
$749,900
4
bds
|
3
ba
|
3,200
sqft
|
built
2008
2609 Eisenhower Dr, Des Plaines, IL 60018
$-1,118
Cash flow
-7.8%
Cash-on-Cash Return
3.9%
Cap rate
0.6%
Rent to Value Ratio
Active
$439,000
1
bds
|
2
ba
|
1,135
sqft
|
built
2000
57 E Delaware Pl, Chicago, IL 60611
$-1,692
Cash flow
-20.1%
Cash-on-Cash Return
1.1%
Cap rate
0.7%
Rent to Value Ratio
Active
$299,000
3
bds
|
3
ba
|
1,148
sqft
|
built
1964
612 Maple Ct, Mount Prospect, IL 60056
$-508
Cash flow
-8.9%
Cash-on-Cash Return
3.6%
Cap rate
0.7%
Rent to Value Ratio
Active
$399,900
4
bds
|
3
ba
|
1,150
sqft
|
built
1949
5417 S New England Ave, Chicago, IL 60638
$-395
Cash flow
-5.2%
Cash-on-Cash Return
4.5%
Cap rate
0.7%
Rent to Value Ratio
Active
$7,900,000
4
bds
|
9
ba
|
7,523
sqft
|
built
1884
79 E Cedar St, Chicago, IL 60611
$-36,568
Cash flow
-24.2%
Cash-on-Cash Return
0.1%
Cap rate
0.1%
Rent to Value Ratio
Active
$399,000
1
bds
|
2
ba
|
1,071
sqft
|
built
2008
160 E Illinois St, Chicago, IL 60611
$-1,452
Cash flow
-19.0%
Cash-on-Cash Return
1.3%
Cap rate
0.7%
Rent to Value Ratio
Active
$512,070
2
bds
|
2
ba
|
1,395
sqft
|
built
1988
474 N Lake Shore Dr, Chicago, IL 60611
$-2,079
Cash flow
-21.2%
Cash-on-Cash Return
0.8%
Cap rate
0.8%
Rent to Value Ratio
Active
$258,900
1
bds
|
1
ba
|
700
sqft
|
built
2002
222 N Columbus Dr, Chicago, IL 60601
$-754
Cash flow
-15.2%
Cash-on-Cash Return
2.2%
Cap rate
0.8%
Rent to Value Ratio
Active
$4,395,000
7
bds
|
8
ba
|
7,607
sqft
|
built
1886
1425 N State Pkwy, Chicago, IL 60610
$-23,815
Cash flow
-28.3%
Cash-on-Cash Return
-0.8%
Cap rate
0.2%
Rent to Value Ratio
Active
$424,500
3
bds
|
3
ba
|
2,080
sqft
|
built
1964
14602 Beech St, Orland Park, IL 60462
$-48
Cash flow
-0.6%
Cash-on-Cash Return
5.5%
Cap rate
0.9%
Rent to Value Ratio
Active
$889,900
9
bds
|
6
ba
|
0
sqft
|
built
1985
6520 W Gunnison St, Harwood Heights, IL 60706
$-3,837
Cash flow
-22.5%
Cash-on-Cash Return
0.5%
Cap rate
0.3%
Rent to Value Ratio
Active
$135,000
3
bds
|
2
ba
|
1,524
sqft
|
built
1961
16404 Homan Ave, Markham, IL 60428
$226
Cash flow
8.7%
Cash-on-Cash Return
7.7%
Cap rate
1.7%
Rent to Value Ratio
Active
$159,900
1
bds
|
1
ba
|
0
sqft
|
built
1973
5415 N Sheridan Rd, Chicago, IL 60640
$-433
Cash flow
-14.1%
Cash-on-Cash Return
2.4%
Cap rate
1.1%
Rent to Value Ratio
Active
$184,900
3
bds
|
1
ba
|
1,200
sqft
|
built
1954
451 Clyde Ave, Calumet City, IL 60409
$-119
Cash flow
-3.4%
Cash-on-Cash Return
4.9%
Cap rate
1.1%
Rent to Value Ratio
Active
$125,000
2
bds
|
2
ba
|
1,400
sqft
|
built
2007
5316 S Kenneth Ave, Chicago, IL 60632
$389
Cash flow
16.2%
Cash-on-Cash Return
9.4%
Cap rate
1.3%
Rent to Value Ratio
Active
$949,500
2
bds
|
2
ba
|
1,852
sqft
|
built
2007
600 N Fairbanks Ct, Chicago, IL 60611
$-4,489
Cash flow
-24.7%
Cash-on-Cash Return
0.0%
Cap rate
0.5%
Rent to Value Ratio

Active
$1,325,000
5
bds
|
4
ba
|
3,300
sqft
|
built
2017
2733 N Maplewood Ave, Chicago, IL 60647
$-2,987
Cash flow
-11.8%
Cash-on-Cash Return
3.0%
Cap rate
0.5%
Rent to Value Ratio
Active
$249,900
2
bds
|
2
ba
|
710
sqft
|
built
1961
5750 W 65th St, Chicago, IL 60638
$71
Cash flow
1.5%
Cash-on-Cash Return
6.0%
Cap rate
0.9%
Rent to Value Ratio
Active
$79,900
4
bds
|
2
ba
|
1,538
sqft
|
built
1940
15622 Millard Ave, Markham, IL 60428
$356
Cash flow
23.2%
Cash-on-Cash Return
11.0%
Cap rate
2.8%
Rent to Value Ratio
Active
$2,675,000
3
bds
|
4
ba
|
3,000
sqft
|
built
1996
45 E Cedar St, Chicago, IL 60611
$-9,210
Cash flow
-18.0%
Cash-on-Cash Return
1.5%
Cap rate
0.3%
Rent to Value Ratio
Active
$189,900
3
bds
|
1
ba
|
1,025
sqft
|
built
1959
427 Clyde Ave, Calumet City, IL 60409
$-107
Cash flow
-2.9%
Cash-on-Cash Return
5.0%
Cap rate
1.1%
Rent to Value Ratio
Active
$120,000
4
bds
|
2
ba
|
1,200
sqft
|
built
1982
4024 W Washington Blvd, Chicago, IL 60624
$485
Cash flow
21.1%
Cash-on-Cash Return
10.5%
Cap rate
1.6%
Rent to Value Ratio
Active
$599,900
5
bds
|
4
ba
|
5,100
sqft
|
built
1998
319 Royal Oak Ct, Steger, IL 60475
$-613
Cash flow
-5.3%
Cash-on-Cash Return
4.5%
Cap rate
0.8%
Rent to Value Ratio
Active
$2,890,000
11
bds
|
8
ba
|
8,600
sqft
|
built
1896
1232 Ridge Ave, Evanston, IL 60202
$-17,201
Cash flow
-31.1%
Cash-on-Cash Return
-1.5%
Cap rate
0.1%
Rent to Value Ratio
Active
$1,090,000
2
bds
|
3
ba
|
2,022
sqft
|
built
2008
401 N Wabash Ave, Chicago, IL 60611
$-4,837
Cash flow
-23.2%
Cash-on-Cash Return
0.4%
Cap rate
0.5%
Rent to Value Ratio
Active
$229,900
3
bds
|
2
ba
|
1,622
sqft
|
built
1965
656 W 14th Pl, Chicago Heights, IL 60411
$154
Cash flow
3.5%
Cash-on-Cash Return
6.5%
Cap rate
0.9%
Rent to Value Ratio
Active
$1,140,000
7
bds
|
4
ba
|
0
sqft
|
built
1925
2451 N Campbell Ave, Chicago, IL 60647
$-4,482
Cash flow
-20.5%
Cash-on-Cash Return
1.0%
Cap rate
0.2%
Rent to Value Ratio
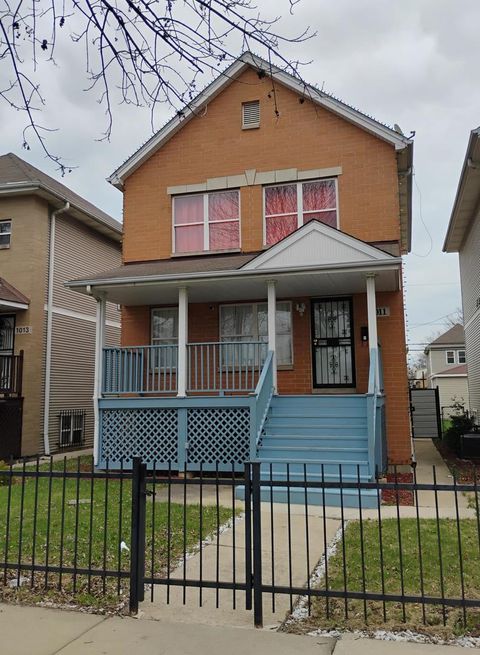
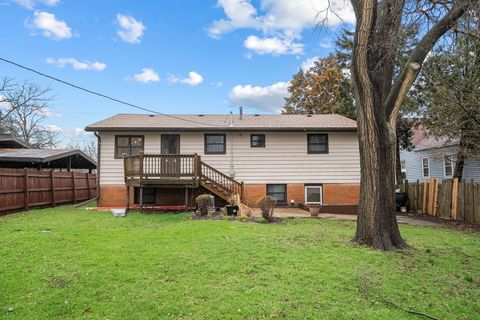
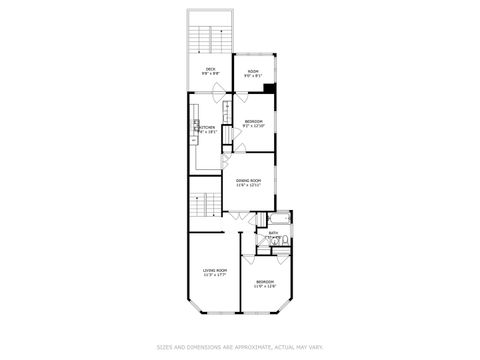
Active
$358,000
3
bds
|
3
ba
|
1,426
sqft
|
built
1995
1011 N Keeler Ave, Chicago, IL 60651
$-445
Cash flow
-6.5%
Cash-on-Cash Return
4.2%
Cap rate
0.7%
Rent to Value Ratio
Active
$200,000
3
bds
|
3
ba
|
2,400
sqft
|
built
2007
5316 S Kenneth Ave, Chicago, IL 60632
$332
Cash flow
8.7%
Cash-on-Cash Return
7.7%
Cap rate
1.1%
Rent to Value Ratio
Active
$252,500
4
bds
|
2
ba
|
1,700
sqft
|
built
1962
919 Dartmouth Ave, Matteson, IL 60443
$81
Cash flow
1.7%
Cash-on-Cash Return
6.1%
Cap rate
1.0%
Rent to Value Ratio
Active
$460,000
4
bds
|
2
ba
|
2,200
sqft
|
built
1904
1336 Grove Ave, Berwyn, IL 60402
$-322
Cash flow
-3.7%
Cash-on-Cash Return
4.8%
Cap rate
0.8%
Rent to Value Ratio