Cook County Investment Properties for Sale
Browse homes for sale and investment properties in Cook County. Refine your search by price, property type, or more.
Best cash flowing properties in Cook County
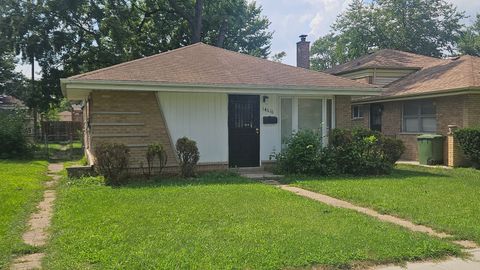
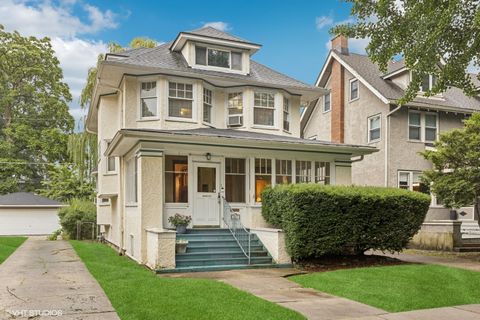
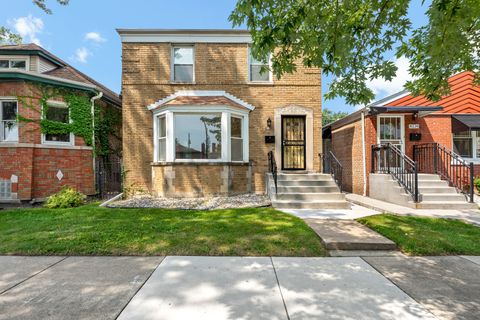
Active
$110,000
3
bds
|
1
ba
|
1,017
sqft
|
built
1957
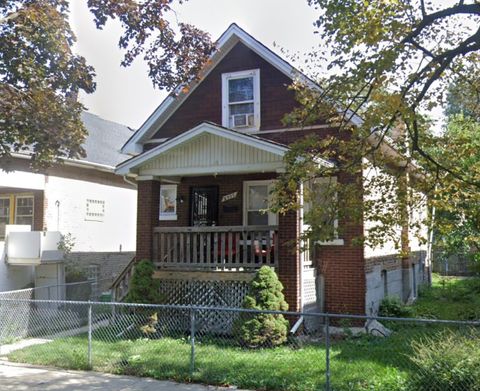
14616 Kimbark Ave, Dolton, IL 60419
$596
Cash flow
28.3%
Cash-on-Cash Return
12.2%
Cap rate
2.1%
Rent to Value Ratio
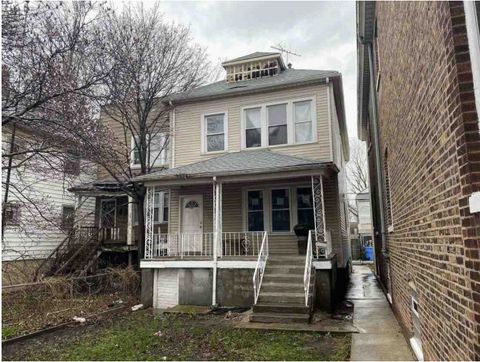
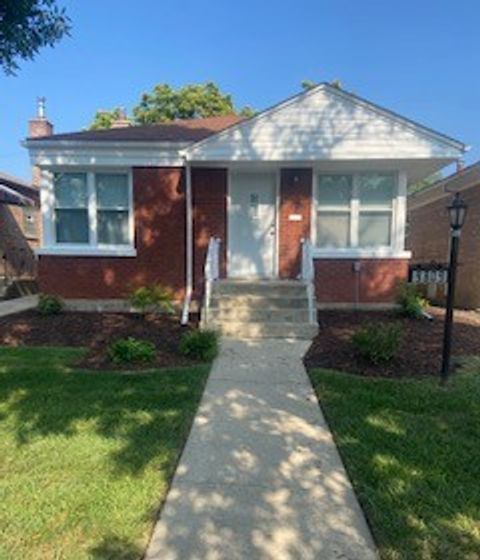
Active
$99,000
4
bds
|
2
ba
|
1,400
sqft
|
built
1917
8613 S Houston Ave, Chicago, IL 60617
$556
Cash flow
29.3%
Cash-on-Cash Return
12.4%
Cap rate
1.6%
Rent to Value Ratio
4,654 out of 5,416 properties for sale in Cook County
Limited Results Shown
Create a free account, or log in to reveal all property listings and enjoy the complete experience.
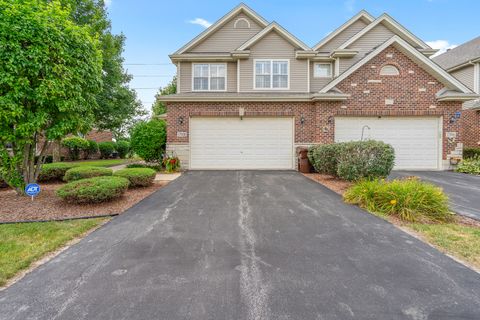
Active
$495,000
4
bds
|
3
ba
|
2,440
sqft
|
built
1974
1324 Parker Pl, Elk Grove Village, IL 60007
$-748
Cash flow
-7.9%
Cash-on-Cash Return
3.9%
Cap rate
0.7%
Rent to Value Ratio
Active
$274,900
4
bds
|
2
ba
|
1,611
sqft
|
built
1981
5838 Woodgate Dr, Matteson, IL 60443
$-163
Cash flow
-3.1%
Cash-on-Cash Return
5.0%
Cap rate
1.0%
Rent to Value Ratio
Active
$384,900
3
bds
|
3
ba
|
2,040
sqft
|
built
2009
17908 Iroquois Trce, Tinley Park, IL 60477
$-674
Cash flow
-9.1%
Cash-on-Cash Return
3.6%
Cap rate
0.8%
Rent to Value Ratio
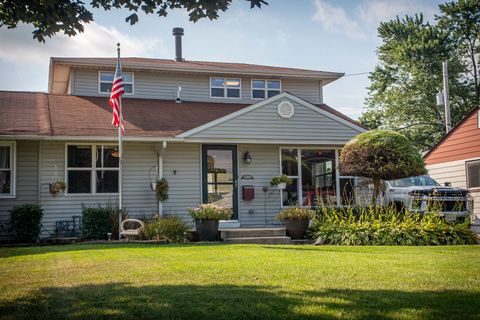
Active
$314,900
4
bds
|
3
ba
|
1,888
sqft
|
built
1950
8925 S Main St, Hometown, IL 60456
$-525
Cash flow
-8.7%
Cash-on-Cash Return
3.7%
Cap rate
0.6%
Rent to Value Ratio
Active
$270,000
3
bds
|
2
ba
|
972
sqft
|
built
1968
4918 S Marshfield Ave, Chicago, IL 60609
$-358
Cash flow
-6.9%
Cash-on-Cash Return
4.1%
Cap rate
0.6%
Rent to Value Ratio
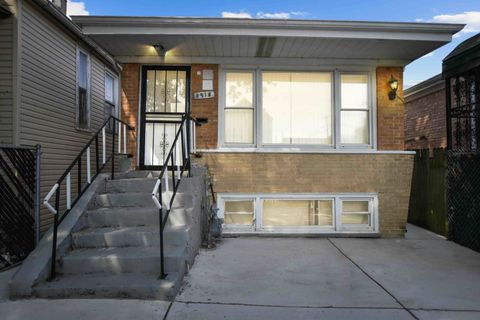
Active
$99,000
4
bds
|
2
ba
|
0
sqft
|
built
1910
8417 S Escanaba Ave, Chicago, IL 60617
$427
Cash flow
22.5%
Cash-on-Cash Return
10.9%
Cap rate
1.4%
Rent to Value Ratio
Active
$99,000
4
bds
|
2
ba
|
0
sqft
|
built
1913
8527 S Colfax Ave, Chicago, IL 60617
$521
Cash flow
27.5%
Cash-on-Cash Return
12.0%
Cap rate
1.6%
Rent to Value Ratio
Active
$579,000
3
bds
|
3
ba
|
2,600
sqft
|
built
2016
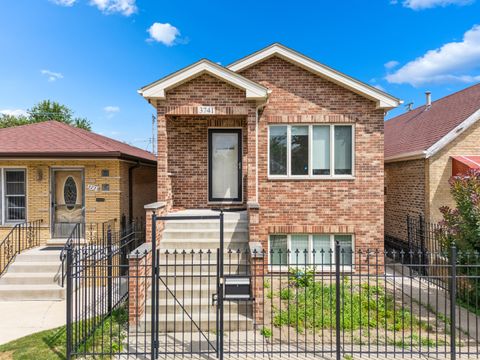
3741 S Wolcott Ave, Chicago, IL 60609
$-689
Cash flow
-6.2%
Cash-on-Cash Return
4.3%
Cap rate
0.7%
Rent to Value Ratio
Active
$339,999
3
bds
|
2
ba
|
1,176
sqft
|
built
1969
8433 S Karlov Ave, Chicago, IL 60652
$-50
Cash flow
-0.8%
Cash-on-Cash Return
5.5%
Cap rate
0.8%
Rent to Value Ratio
Active
$350,000
1
bds
|
1
ba
|
850
sqft
|
built
1987
3660 N Lake Shore Dr, Chicago, IL 60613
$-590
Cash flow
-8.8%
Cash-on-Cash Return
3.7%
Cap rate
0.9%
Rent to Value Ratio
Active
$250,000
1
bds
|
1
ba
|
607
sqft
|
built
1973
455 W Grant Pl, Chicago, IL 60614
$67
Cash flow
1.4%
Cash-on-Cash Return
6.0%
Cap rate
1.0%
Rent to Value Ratio
Active
$145,000
1
bds
|
1
ba
|
0
sqft
|
built
1927
6214 N Mozart St, Chicago, IL 60659
$-85
Cash flow
-3.1%
Cash-on-Cash Return
5.0%
Cap rate
1.0%
Rent to Value Ratio
Active
$240,000
2
bds
|
1
ba
|
963
sqft
|
built
1942
8136 W 26th St, North Riverside, IL 60546
$-175
Cash flow
-3.8%
Cash-on-Cash Return
4.8%
Cap rate
0.9%
Rent to Value Ratio
Active
$385,000
3
bds
|
2
ba
|
0
sqft
|
built
1944
3730 Blanchan Ave, Brookfield, IL 60513
$-683
Cash flow
-9.3%
Cash-on-Cash Return
3.6%
Cap rate
0.6%
Rent to Value Ratio
Active
$246,900
2
bds
|
2
ba
|
1,200
sqft
|
built
1982
4128 Cove Ln, Glenview, IL 60025
$-146
Cash flow
-3.1%
Cash-on-Cash Return
5.0%
Cap rate
0.9%
Rent to Value Ratio
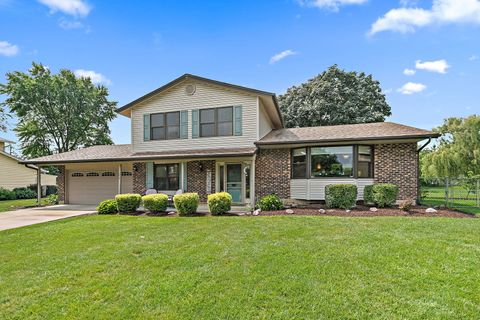
Active
$539,000
4
bds
|
2
ba
|
2,000
sqft
|
built
1968
2300 Sherman Ave, Evanston, IL 60201
$-1,503
Cash flow
-14.5%
Cash-on-Cash Return
2.3%
Cap rate
0.6%
Rent to Value Ratio
Active
$310,000
2
bds
|
2
ba
|
1,475
sqft
|
built
1980
3500 Church St, Evanston, IL 60203
$-312
Cash flow
-5.3%
Cash-on-Cash Return
4.5%
Cap rate
0.8%
Rent to Value Ratio
Active
$949,900
5
bds
|
4
ba
|
4,400
sqft
|
built
1935
9709 S Leavitt St, Chicago, IL 60643
$-2,847
Cash flow
-15.6%
Cash-on-Cash Return
2.1%
Cap rate
0.3%
Rent to Value Ratio
Active
$465,000
2
bds
|
2
ba
|
1,225
sqft
|
built
1991
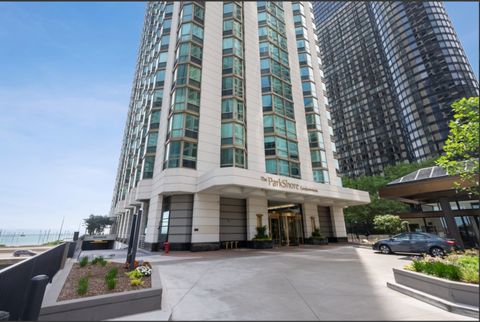
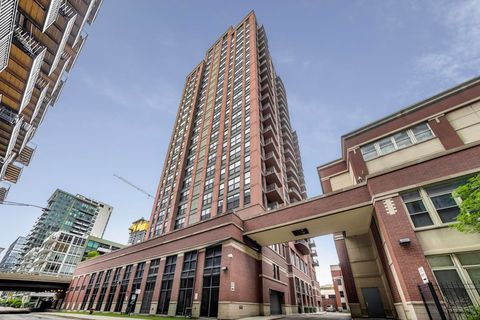
195 N Harbor Dr, Chicago, IL 60601
$-1,384
Cash flow
-15.5%
Cash-on-Cash Return
2.1%
Cap rate
0.9%
Rent to Value Ratio
Active
$259,900
3
bds
|
2
ba
|
1,234
sqft
|
built
1954
10201 S California Ave, Chicago, IL 60655
$289
Cash flow
5.8%
Cash-on-Cash Return
7.0%
Cap rate
1.1%
Rent to Value Ratio
Active
$319,000
3
bds
|
2
ba
|
0
sqft
|
built
1962
8044 W Lyons St, Niles, IL 60714
$-322
Cash flow
-5.3%
Cash-on-Cash Return
4.5%
Cap rate
0.8%
Rent to Value Ratio
Active
$525,000
4
bds
|
3
ba
|
0
sqft
|
built
1927
5918 W Eddy St, Chicago, IL 60634
$-545
Cash flow
-5.4%
Cash-on-Cash Return
4.4%
Cap rate
0.7%
Rent to Value Ratio
Active
$500,000
4
bds
|
2
ba
|
1,968
sqft
|
built
1910
632 S Elmwood Ave, Oak Park, IL 60304
$33
Cash flow
0.3%
Cash-on-Cash Return
5.8%
Cap rate
0.9%
Rent to Value Ratio
Active
$282,000
2
bds
|
2
ba
|
4,125
sqft
|
built
1948
9809 S Union Ave, Chicago, IL 60628
$-122
Cash flow
-2.3%
Cash-on-Cash Return
5.2%
Cap rate
0.7%
Rent to Value Ratio
Active
$474,900
3
bds
|
3
ba
|
1,772
sqft
|
built
1978
7218 Sandy Ln, Tinley Park, IL 60477
$-818
Cash flow
-9.0%
Cash-on-Cash Return
3.6%
Cap rate
0.7%
Rent to Value Ratio
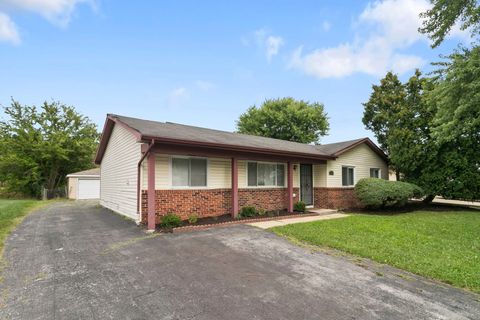
Active
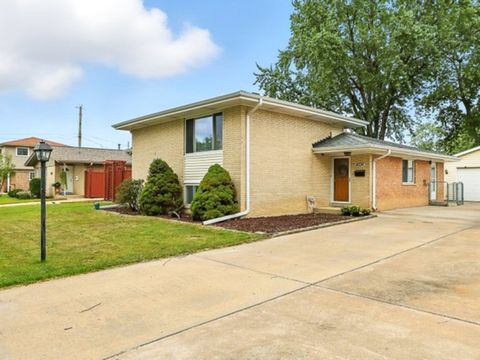
$155,000
2
bds
|
1
ba
|
0
sqft
|
built
1977
4931 W 87th St, Oak Lawn, IL 60453
$-18
Cash flow
-0.6%
Cash-on-Cash Return
5.5%
Cap rate
0.9%
Rent to Value Ratio
Active
$289,000
2
bds
|
2
ba
|
1,044
sqft
|
built
1954
333 Wesley Ave, Oak Park, IL 60302
$-305
Cash flow
-5.5%
Cash-on-Cash Return
4.4%
Cap rate
0.9%
Rent to Value Ratio
Active
$379,999
3
bds
|
3
ba
|
1,800
sqft
|
built
1961
9322 S Euclid Ave, Chicago, IL 60617
$-404
Cash flow
-5.5%
Cash-on-Cash Return
4.4%
Cap rate
0.6%
Rent to Value Ratio
Active
$350,000
2
bds
|
2
ba
|
1,007
sqft
|
built
1927
3437 N Overhill Ave, Chicago, IL 60634
$-148
Cash flow
-2.2%
Cash-on-Cash Return
5.2%
Cap rate
0.7%
Rent to Value Ratio
Active
$725,000
2
bds
|
2
ba
|
1,100
sqft
|
built
1971
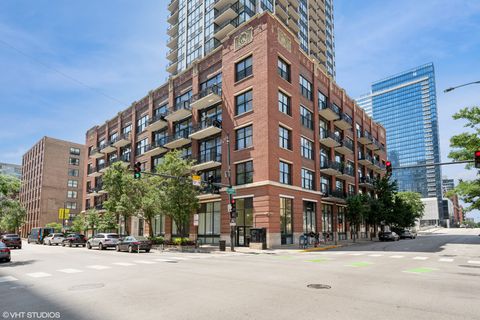
1030 N State St, Chicago, IL 60610
$-2,548
Cash flow
-18.3%
Cash-on-Cash Return
1.5%
Cap rate
0.6%
Rent to Value Ratio
Active
$195,000
1
bds
|
1
ba
|
800
sqft
|
built
1958
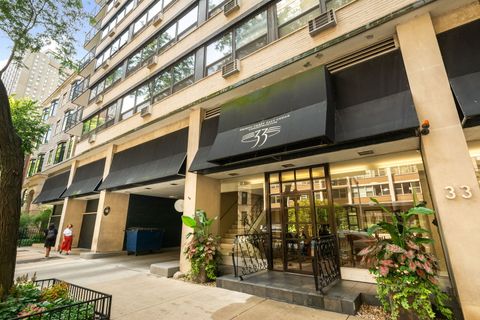
33 E Cedar St, Chicago, IL 60611
$-667
Cash flow
-17.8%
Cash-on-Cash Return
1.6%
Cap rate
1.2%
Rent to Value Ratio
Active
$699,000
2
bds
|
2
ba
|
0
sqft
|
built
2003
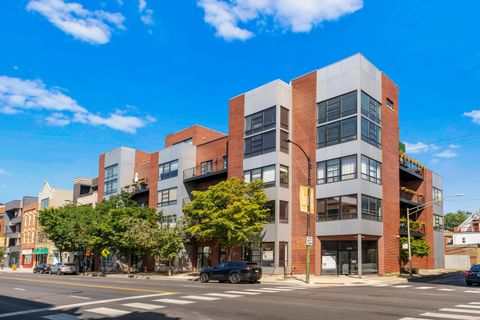
808 N Greenview Ave, Chicago, IL 60642
$-1,635
Cash flow
-12.2%
Cash-on-Cash Return
2.9%
Cap rate
0.6%
Rent to Value Ratio
Active
$245,999
3
bds
|
2
ba
|
1,100
sqft
|
built
1921
3314 W 62nd Pl, Chicago, IL 60629
$21
Cash flow
0.4%
Cash-on-Cash Return
5.8%
Cap rate
0.8%
Rent to Value Ratio
Active
$370,000
3
bds
|
1
ba
|
1,400
sqft
|
built
1913
3424 W 64th Pl, Chicago, IL 60629
$-721
Cash flow
-10.2%
Cash-on-Cash Return
3.3%
Cap rate
0.5%
Rent to Value Ratio
Active
$250,000
3
bds
|
1
ba
|
1,208
sqft
|
built
1948
8228 S La Salle St, Chicago, IL 60620
$229
Cash flow
4.8%
Cash-on-Cash Return
6.8%
Cap rate
0.9%
Rent to Value Ratio
Active
$550,000
2
bds
|
2
ba
|
1,300
sqft
|
built
2000
330 N Jefferson St, Chicago, IL 60661
$-1,440
Cash flow
-13.7%
Cash-on-Cash Return
2.5%
Cap rate
0.8%
Rent to Value Ratio
Active
$495,000
2
bds
|
2
ba
|
1,520
sqft
|
built
2005
210 S Desplaines St, Chicago, IL 60661
$-1,284
Cash flow
-13.5%
Cash-on-Cash Return
2.6%
Cap rate
0.8%
Rent to Value Ratio
Active
$275,000
3
bds
|
3
ba
|
1,346
sqft
|
built
1967
4336 Scott St, Oak Forest, IL 60452
$96
Cash flow
1.8%
Cash-on-Cash Return
6.1%
Cap rate
1.0%
Rent to Value Ratio