Cook County Investment Properties for Sale
Browse homes for sale and investment properties in Cook County. Refine your search by price, property type, or more.
Best cash flowing properties in Cook County
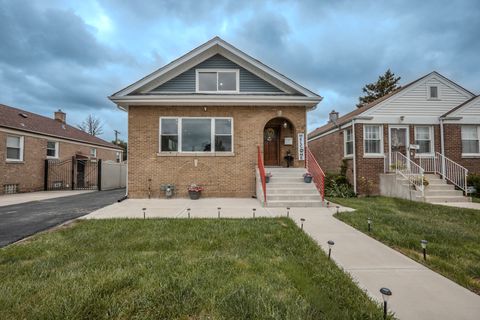
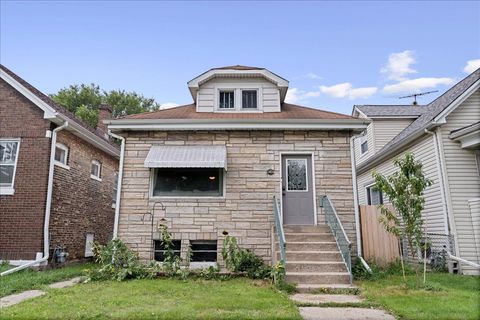
Active
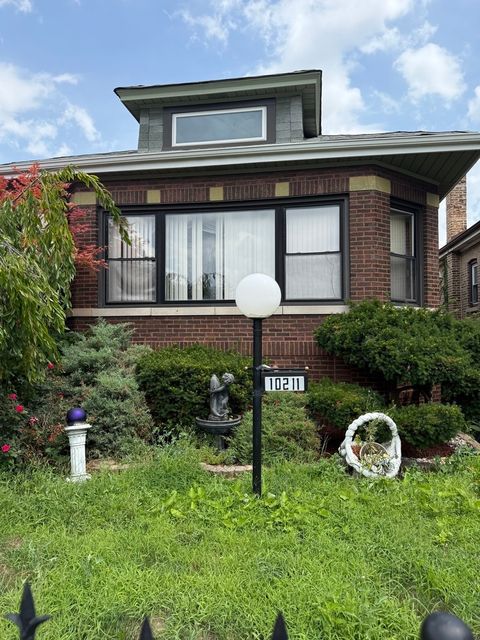
$115,000
2
bds
|
2
ba
|
1,150
sqft
|
built
1925
10211 S Peoria St, Chicago, IL 60643
$1,025
Cash flow
46.5%
Cash-on-Cash Return
16.4%
Cap rate
2.0%
Rent to Value Ratio
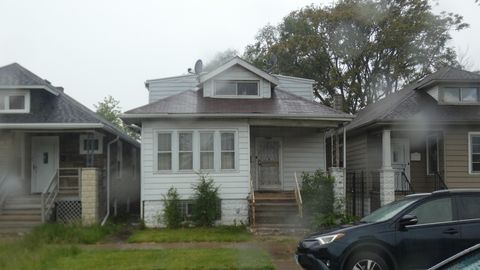
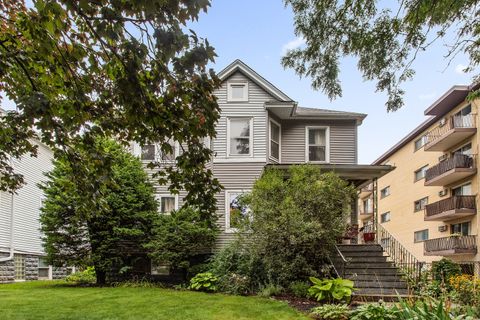
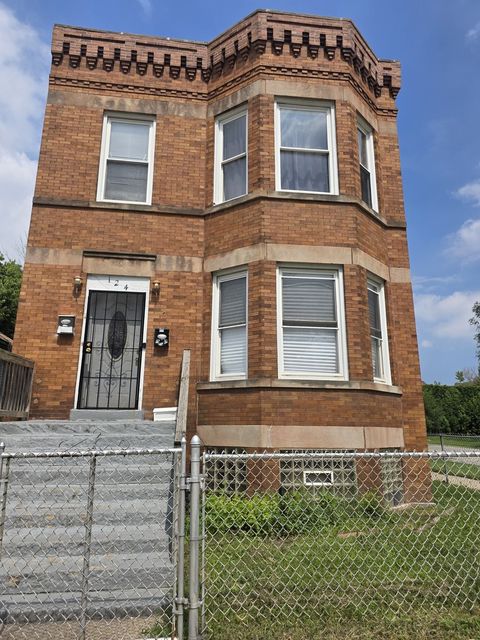
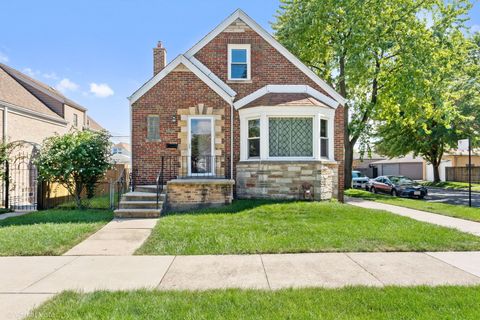
Active
$124,000
5
bds
|
3
ba
|
1,195
sqft
|
built
1924
10012 S Lafayette Ave, Chicago, IL 60628
$834
Cash flow
35.1%
Cash-on-Cash Return
13.8%
Cap rate
1.8%
Rent to Value Ratio
4,699 out of 5,467 properties for sale in Cook County
Limited Results Shown
Create a free account, or log in to reveal all property listings and enjoy the complete experience.
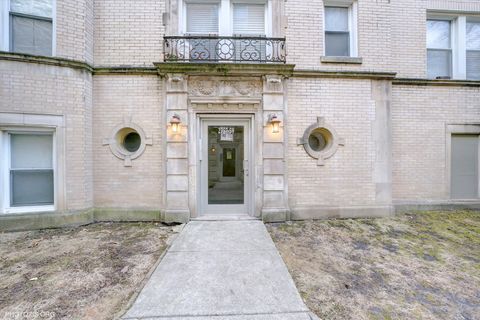
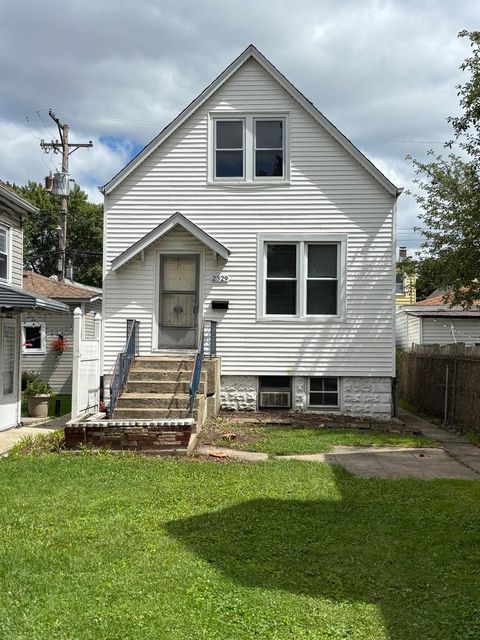
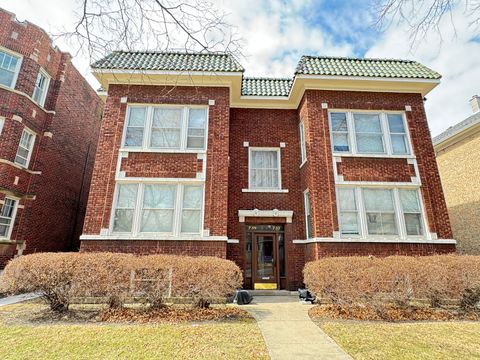
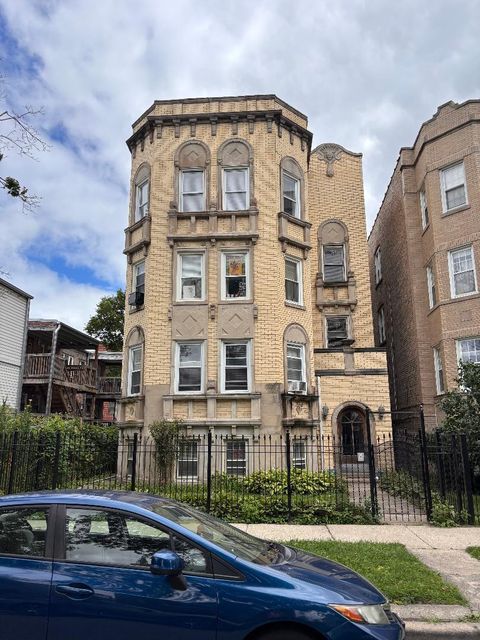
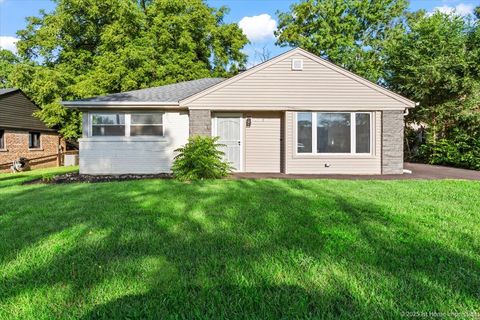
Active
$189,900
3
bds
|
1
ba
|
726
sqft
|
built
1926
2759 W Arthur Ave, Chicago, IL 60645
$-260
Cash flow
-7.1%
Cash-on-Cash Return
4.0%
Cap rate
0.9%
Rent to Value Ratio
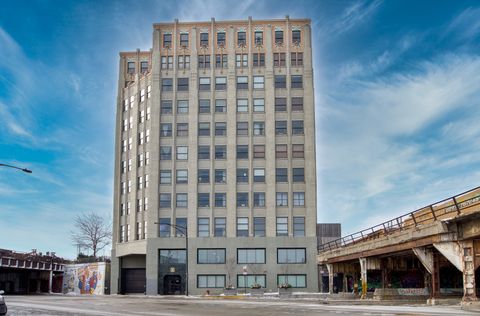
Active
$235,000
1
bds
|
1
ba
|
785
sqft
|
built
1927
1550 S Blue Island Ave, Chicago, IL 60608
$-586
Cash flow
-13.0%
Cash-on-Cash Return
2.7%
Cap rate
0.9%
Rent to Value Ratio
Active
$199,900
3
bds
|
2
ba
|
0
sqft
|
built
1918
2329 N Monitor Ave, Chicago, IL 60639
$482
Cash flow
12.6%
Cash-on-Cash Return
8.6%
Cap rate
1.2%
Rent to Value Ratio
Active
$164,900
3
bds
|
1
ba
|
0
sqft
|
built
1898
4055 S Calumet Ave, Chicago, IL 60653
$-30
Cash flow
-0.9%
Cash-on-Cash Return
5.5%
Cap rate
1.1%
Rent to Value Ratio
Active
$1,550,000
12
bds
|
8
ba
|
0
sqft
|
built
1930
5759 N Washtenaw Ave, Chicago, IL 60659
$-6,239
Cash flow
-21.0%
Cash-on-Cash Return
0.8%
Cap rate
0.2%
Rent to Value Ratio
Active
$679,000
4
bds
|
3
ba
|
2,868
sqft
|
built
1994
6916 W Forest Preserve Dr, Harwood Heights, IL 60706
$-1,367
Cash flow
-10.5%
Cash-on-Cash Return
3.3%
Cap rate
0.5%
Rent to Value Ratio
Active
$425,000
4
bds
|
2
ba
|
0
sqft
|
built
1924
3832 Saint Charles Rd, Bellwood, IL 60104
$-1,271
Cash flow
-15.6%
Cash-on-Cash Return
2.1%
Cap rate
0.5%
Rent to Value Ratio
Active
$625,000
5
bds
|
3
ba
|
0
sqft
|
built
1923
7415 Dixon St, Forest Park, IL 60130
$-2,276
Cash flow
-19.0%
Cash-on-Cash Return
1.3%
Cap rate
0.4%
Rent to Value Ratio
Active
$835,000
4
bds
|
4
ba
|
0
sqft
|
built
1913
737 Clarence Ave, Oak Park, IL 60304
$-3,770
Cash flow
-23.6%
Cash-on-Cash Return
0.3%
Cap rate
0.3%
Rent to Value Ratio
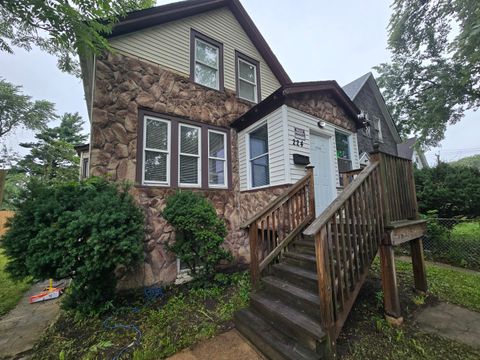
Active
$149,000
2
bds
|
1
ba
|
1,231
sqft
|
built
1886
224 W 105th Pl, Chicago, IL 60628
$631
Cash flow
22.1%
Cash-on-Cash Return
10.8%
Cap rate
1.3%
Rent to Value Ratio
Active
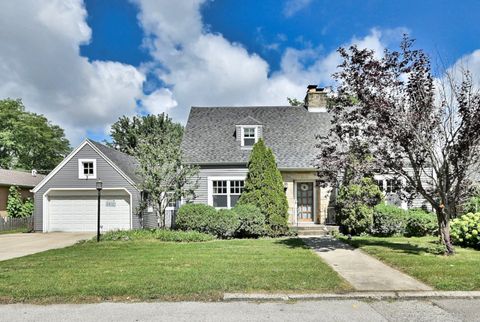
$450,000
3
bds
|
1
ba
|
1,394
sqft
|
built
1949
9014 W 123rd St, Palos Park, IL 60464
$-1,066
Cash flow
-12.4%
Cash-on-Cash Return
2.8%
Cap rate
0.6%
Rent to Value Ratio
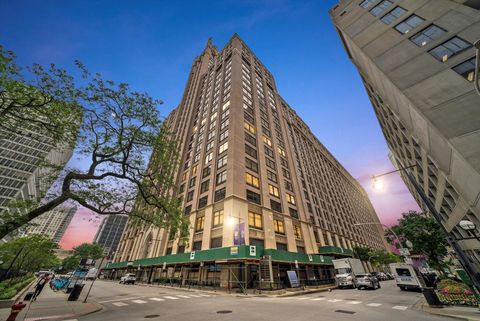
Active
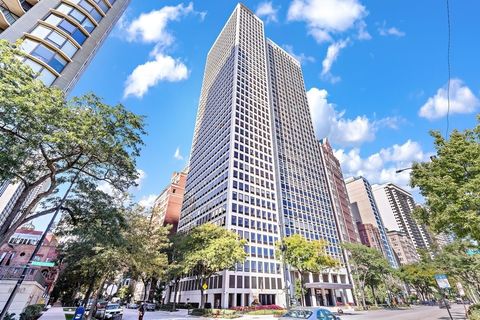
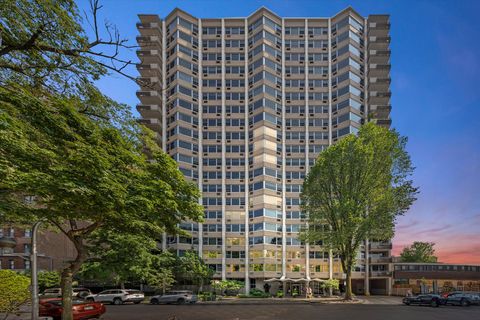
$697,750
3
bds
|
3
ba
|
2,012
sqft
|
built
1979
1100 N Lake Shore Dr, Chicago, IL 60611
$-3,585
Cash flow
-26.8%
Cash-on-Cash Return
-0.5%
Cap rate
0.6%
Rent to Value Ratio
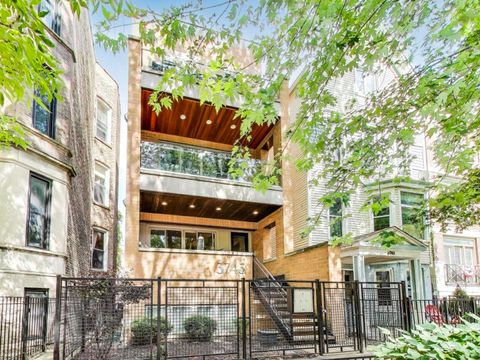
Active
$1,199,000
5
bds
|
4
ba
|
0
sqft
|
built
1908
3572 W Medill Ave, Chicago, IL 60647
$-4,384
Cash flow
-19.1%
Cash-on-Cash Return
1.3%
Cap rate
0.3%
Rent to Value Ratio
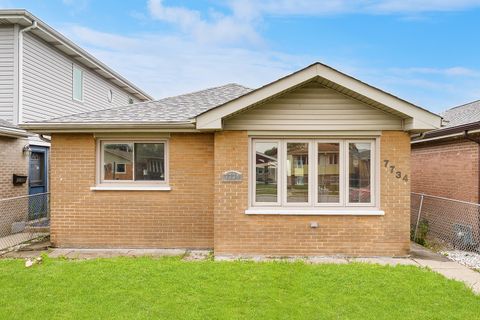
Active
$285,000
3
bds
|
1
ba
|
1,010
sqft
|
built
1962
7734 Melvina Ave, Burbank, IL 60459
$-348
Cash flow
-6.4%
Cash-on-Cash Return
4.2%
Cap rate
0.8%
Rent to Value Ratio
Active
$585,000
3
bds
|
2
ba
|
2,427
sqft
|
built
1950
6610 Palma Ln, Morton Grove, IL 60053
$-998
Cash flow
-8.9%
Cash-on-Cash Return
3.6%
Cap rate
0.7%
Rent to Value Ratio
Active
$850,000
10
bds
|
4
ba
|
0
sqft
|
built
1927
6151 N Mozart St, Chicago, IL 60659
$-2,921
Cash flow
-17.9%
Cash-on-Cash Return
1.6%
Cap rate
0.4%
Rent to Value Ratio
Active
$425,000
2
bds
|
3
ba
|
1,500
sqft
|
built
1960
555 W Cornelia Ave, Chicago, IL 60657
$-2,021
Cash flow
-24.8%
Cash-on-Cash Return
0.0%
Cap rate
0.8%
Rent to Value Ratio
Active
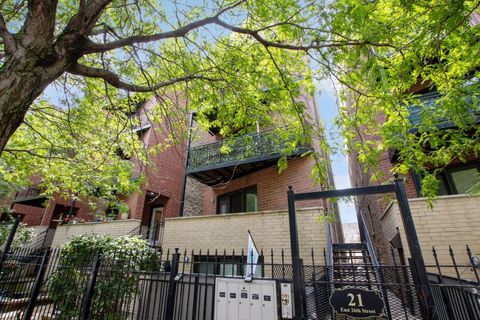
$339,900
2
bds
|
2
ba
|
1,500
sqft
|
built
2005
21 E 26th St, Chicago, IL 60616
$-456
Cash flow
-7.0%
Cash-on-Cash Return
4.1%
Cap rate
0.8%
Rent to Value Ratio
Active
$509,900
9
bds
|
6
ba
|
0
sqft
|
built
1916
3626 W Grenshaw St, Chicago, IL 60624
$-1,094
Cash flow
-11.2%
Cash-on-Cash Return
3.1%
Cap rate
0.5%
Rent to Value Ratio
Active
$229,000
1
bds
|
1
ba
|
0
sqft
|
built
2005
1061 W 16th St, Chicago, IL 60608
$-351
Cash flow
-8.0%
Cash-on-Cash Return
3.8%
Cap rate
0.8%
Rent to Value Ratio
Active
$899,900
3
bds
|
4
ba
|
3,100
sqft
|
built
1882
1000 W Washington Blvd, Chicago, IL 60607
$-734
Cash flow
-4.3%
Cash-on-Cash Return
4.7%
Cap rate
0.7%
Rent to Value Ratio
Active
$250,000
4
bds
|
2
ba
|
1,000
sqft
|
built
1951
8955 S Corcoran Rd, Hometown, IL 60456
$-49
Cash flow
-1.0%
Cash-on-Cash Return
5.4%
Cap rate
0.7%
Rent to Value Ratio
Active
$675,000
5
bds
|
3
ba
|
3,100
sqft
|
built
1928
5253 Cleveland St, Skokie, IL 60077
$-1,703
Cash flow
-13.2%
Cash-on-Cash Return
2.7%
Cap rate
0.5%
Rent to Value Ratio
Active
$197,500
4
bds
|
3
ba
|
1,546
sqft
|
built
1895
5948 S Throop St, Chicago, IL 60636
$599
Cash flow
15.8%
Cash-on-Cash Return
9.3%
Cap rate
1.2%
Rent to Value Ratio
Active
$160,000
2
bds
|
2
ba
|
1,000
sqft
|
built
1969
9720 S Pulaski Rd, Oak Lawn, IL 60453
$-88
Cash flow
-2.9%
Cash-on-Cash Return
5.0%
Cap rate
1.1%
Rent to Value Ratio
Active
$599,000
3
bds
|
3
ba
|
2,158
sqft
|
built
2001
717 Sarah Ln, Northbrook, IL 60062
$-1,536
Cash flow
-13.4%
Cash-on-Cash Return
2.6%
Cap rate
0.7%
Rent to Value Ratio
Active
$225,000
5
bds
|
2
ba
|
0
sqft
|
built
1908
124 E 110th St, Chicago, IL 60628
$80
Cash flow
1.9%
Cash-on-Cash Return
6.1%
Cap rate
0.8%
Rent to Value Ratio
Active
$799,000
2
bds
|
3
ba
|
2,100
sqft
|
built
1925
680 N Lake Shore Dr, Chicago, IL 60611
$-3,196
Cash flow
-20.9%
Cash-on-Cash Return
0.9%
Cap rate
0.6%
Rent to Value Ratio
Active
$174,900
2
bds
|
1
ba
|
968
sqft
|
built
1951
326 Nassau St, Park Forest, IL 60466
$-257
Cash flow
-7.7%
Cash-on-Cash Return
3.9%
Cap rate
1.0%
Rent to Value Ratio
Active
$1,100,000
4
bds
|
3
ba
|
2,416
sqft
|
built
2014
3743 N Kenmore Ave, Chicago, IL 60613
$-2,728
Cash flow
-12.9%
Cash-on-Cash Return
2.7%
Cap rate
0.5%
Rent to Value Ratio
Active
$499,000
2
bds
|
2
ba
|
1,596
sqft
|
built
2010
2811 N Bell Ave, Chicago, IL 60618
$-1,196
Cash flow
-12.5%
Cash-on-Cash Return
2.8%
Cap rate
0.7%
Rent to Value Ratio
Active
$899,000
3
bds
|
3
ba
|
0
sqft
|
built
2003
1155 N Dearborn St, Chicago, IL 60610
$-3,771
Cash flow
-21.9%
Cash-on-Cash Return
0.6%
Cap rate
0.7%
Rent to Value Ratio
Active
$350,000
2
bds
|
1
ba
|
0
sqft
|
built
1906
801 S Wells St, Chicago, IL 60607
$-631
Cash flow
-9.4%
Cash-on-Cash Return
3.5%
Cap rate
0.8%
Rent to Value Ratio
Active
$125,000
4
bds
|
2
ba
|
1,749
sqft
|
built
1947
8252 S Marshfield Ave, Chicago, IL 60620
$647
Cash flow
27.0%
Cash-on-Cash Return
11.9%
Cap rate
1.6%
Rent to Value Ratio
Active
$749,000
5
bds
|
4
ba
|
3,500
sqft
|
built
1980
2100 N 77th Ct, Elmwood Park, IL 60707
$-1,635
Cash flow
-11.4%
Cash-on-Cash Return
3.1%
Cap rate
0.6%
Rent to Value Ratio
Active
$299,900
3
bds
|
1
ba
|
1,200
sqft
|
built
1920
1426 Harvey Ave, Berwyn, IL 60402
$-269
Cash flow
-4.7%
Cash-on-Cash Return
4.6%
Cap rate
0.8%
Rent to Value Ratio
Active
$367,000
3
bds
|
3
ba
|
2,400
sqft
|
built
1951
3757 W 65th St, Chicago, IL 60629
$-496
Cash flow
-7.1%
Cash-on-Cash Return
4.1%
Cap rate
0.6%
Rent to Value Ratio
Active
$420,000
3
bds
|
2
ba
|
1,500
sqft
|
built
2007
5300 N Lincoln Ave, Chicago, IL 60625
$-783
Cash flow
-9.7%
Cash-on-Cash Return
3.4%
Cap rate
0.7%
Rent to Value Ratio