Cook County Investment Properties for Sale
Browse homes for sale and investment properties in Cook County. Refine your search by price, property type, or more.
Best cash flowing properties in Cook County
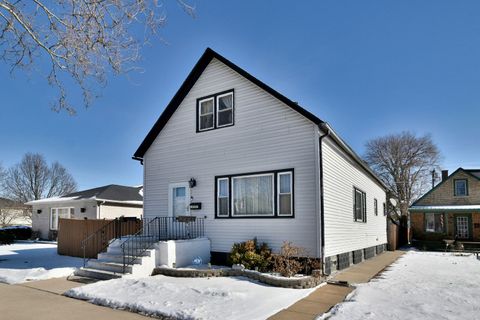
Active
$134,999
4
bds
|
2
ba
|
1,400
sqft
|
built
1941
12249 S Perry Ave, Chicago, IL 60628
$805
Cash flow
31.1%
Cash-on-Cash Return
12.8%
Cap rate
1.6%
Rent to Value Ratio

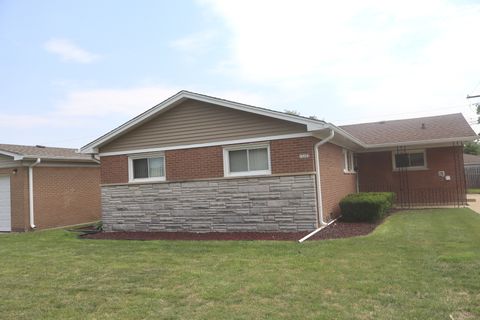
Active
$255,000
2
bds
|
3
ba
|
3,750
sqft
|
built
2004
5645 W 64th St, Chicago, IL 60638
$536
Cash flow
11.0%
Cash-on-Cash Return
8.2%
Cap rate
1.1%
Rent to Value Ratio
5,022 out of 5,820 properties for sale in Cook County
Limited Results Shown
Create a free account, or log in to reveal all property listings and enjoy the complete experience.
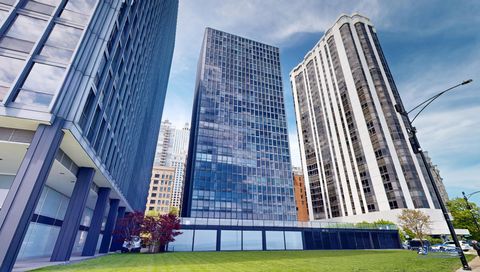
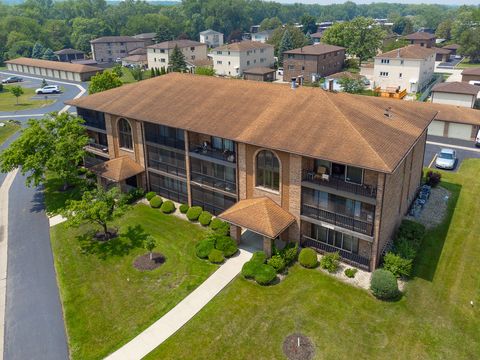
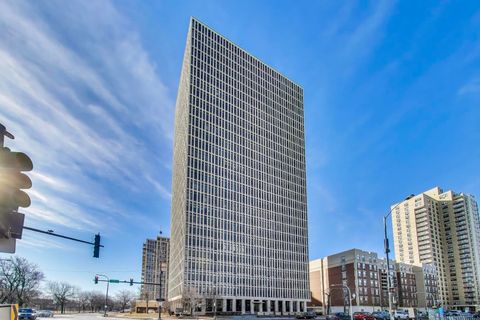
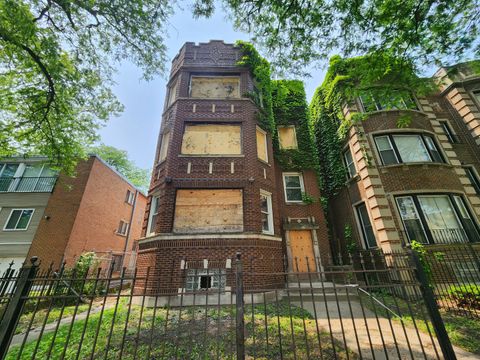
Active
$495,000
2
bds
|
2
ba
|
1,140
sqft
|
built
1955
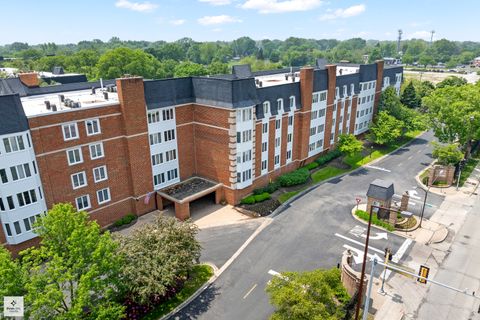
910 N Lake Shore Dr, Chicago, IL 60611
$-2,020
Cash flow
-21.3%
Cash-on-Cash Return
0.8%
Cap rate
0.7%
Rent to Value Ratio

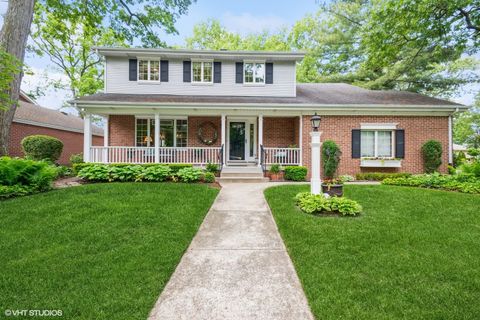
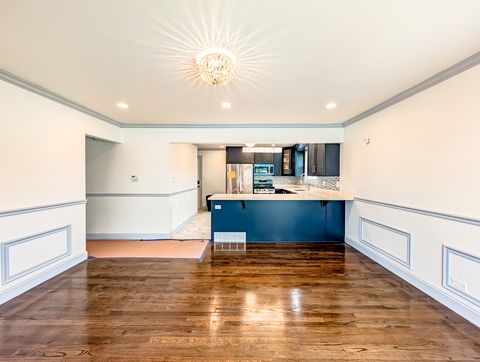
Active
$674,500
4
bds
|
3
ba
|
2,423
sqft
|
built
1964
401 Dewey Ave, Evanston, IL 60202
$-1,117
Cash flow
-8.6%
Cash-on-Cash Return
3.7%
Cap rate
0.7%
Rent to Value Ratio
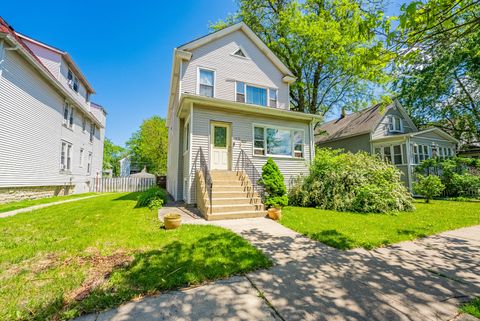
Active
$298,000
4
bds
|
3
ba
|
2,000
sqft
|
built
1890
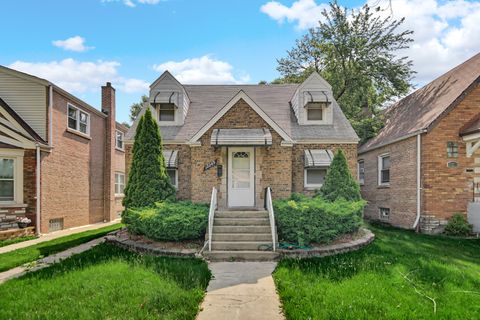
8807 S Lowe Ave, Chicago, IL 60620
$39
Cash flow
0.7%
Cash-on-Cash Return
5.8%
Cap rate
0.7%
Rent to Value Ratio
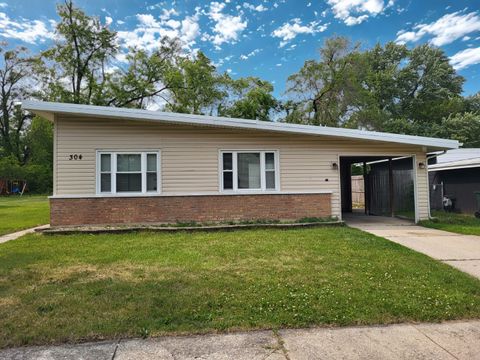
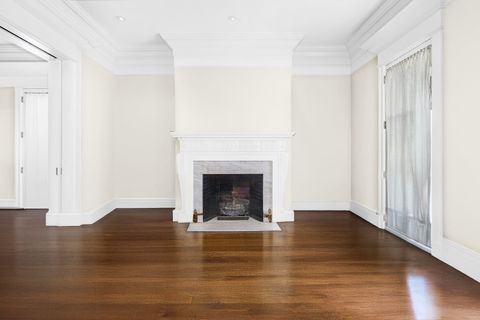
Active
$123,000
3
bds
|
1
ba
|
1,092
sqft
|
built
1955
304 Shawnee St, Park Forest, IL 60466
$68
Cash flow
2.9%
Cash-on-Cash Return
6.3%
Cap rate
1.6%
Rent to Value Ratio
Active
$233,000
3
bds
|
2
ba
|
1,065
sqft
|
built
1959
55 E Craig Dr, Chicago Heights, IL 60411
$-226
Cash flow
-5.1%
Cash-on-Cash Return
4.5%
Cap rate
0.9%
Rent to Value Ratio
Active
$270,000
3
bds
|
3
ba
|
2,300
sqft
|
built
1971
17804 Pebblewood Ln, Hazel Crest, IL 60429
$-344
Cash flow
-6.6%
Cash-on-Cash Return
4.2%
Cap rate
1.1%
Rent to Value Ratio
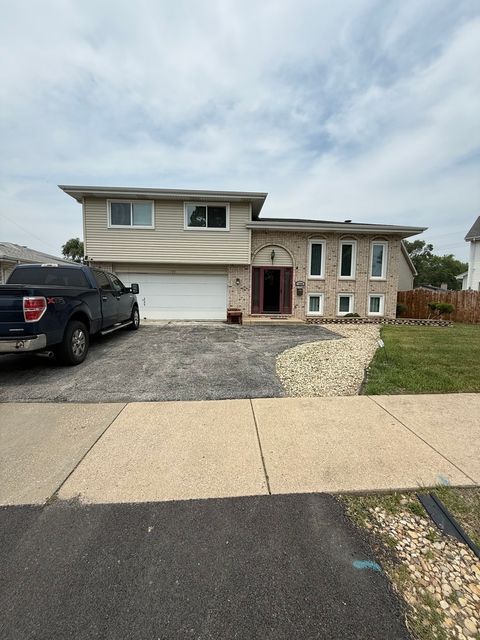
Active
$348,900
3
bds
|
2
ba
|
1,401
sqft
|
built
1956
700 Cumberland St, Hoffman Estates, IL 60169
$-274
Cash flow
-4.1%
Cash-on-Cash Return
4.7%
Cap rate
0.8%
Rent to Value Ratio

Active
$201,000
3
bds
|
2
ba
|
1,383
sqft
|
built
1956
658 Mackinaw Ave, Calumet City, IL 60409
$-185
Cash flow
-4.8%
Cash-on-Cash Return
4.6%
Cap rate
1.1%
Rent to Value Ratio

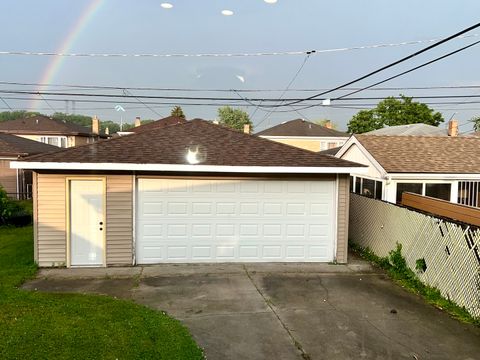
Active
$135,000
3
bds
|
2
ba
|
968
sqft
|
built
1920
1519 E 76th Pl, Chicago, IL 60619
$332
Cash flow
12.8%
Cash-on-Cash Return
8.6%
Cap rate
1.2%
Rent to Value Ratio
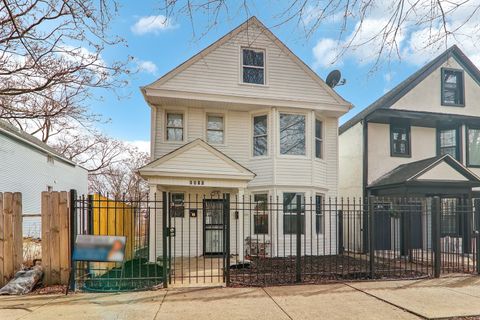
Active
$603,000
4
bds
|
3
ba
|
1,709
sqft
|
built
1890
2058 W Washington Blvd, Chicago, IL 60612
$-883
Cash flow
-7.6%
Cash-on-Cash Return
3.9%
Cap rate
0.7%
Rent to Value Ratio
Active
$245,000
2
bds
|
2
ba
|
1,100
sqft
|
built
1989
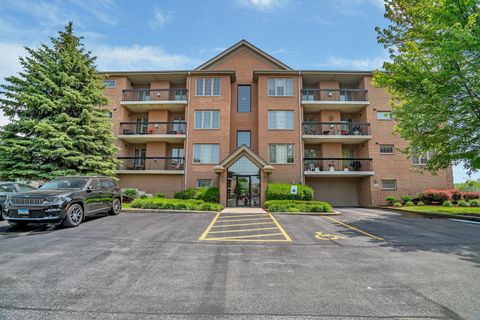
11114 Heritage Dr, Palos Hills, IL 60465
$-259
Cash flow
-5.5%
Cash-on-Cash Return
4.4%
Cap rate
0.8%
Rent to Value Ratio
Active
$260,000
3
bds
|
2
ba
|
1,396
sqft
|
built
1993
1208 E 154th St, South Holland, IL 60473
$-249
Cash flow
-5.0%
Cash-on-Cash Return
4.5%
Cap rate
1.0%
Rent to Value Ratio
Active
$525,000
5
bds
|
3
ba
|
0
sqft
|
built
1908
1032 S Maple Ave, Oak Park, IL 60304
$-1,332
Cash flow
-13.2%
Cash-on-Cash Return
2.6%
Cap rate
0.5%
Rent to Value Ratio
Active
$5,300,000
4
bds
|
7
ba
|
7,252
sqft
|
built
1997
401 W Dickens Ave, Chicago, IL 60614
$-25,701
Cash flow
-25.3%
Cash-on-Cash Return
-0.1%
Cap rate
0.2%
Rent to Value Ratio
Active
$135,000
1
bds
|
1
ba
|
850
sqft
|
built
1968
6700 S South Shore Dr, Chicago, IL 60649
$-282
Cash flow
-10.9%
Cash-on-Cash Return
3.2%
Cap rate
1.0%
Rent to Value Ratio
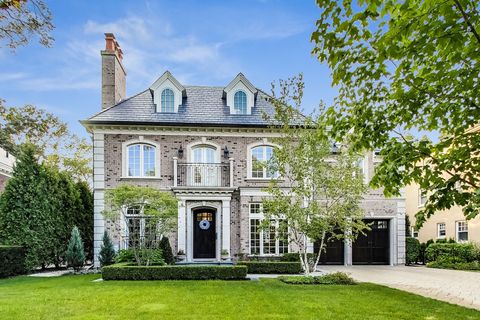
Active
$3,199,000
6
bds
|
6
ba
|
6,600
sqft
|
built
2014
159 Abingdon Ave, Kenilworth, IL 60043
$-12,428
Cash flow
-20.3%
Cash-on-Cash Return
1.0%
Cap rate
0.3%
Rent to Value Ratio
Active
$389,900
3
bds
|
3
ba
|
1,866
sqft
|
built
1985
18038 Whitman Ln, Lansing, IL 60438
$-1,156
Cash flow
-15.5%
Cash-on-Cash Return
2.1%
Cap rate
0.6%
Rent to Value Ratio
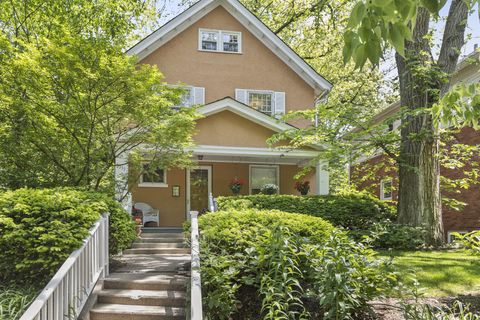
Active
$675,000
4
bds
|
2
ba
|
1,795
sqft
|
built
1908
2353 Ridge Ave, Evanston, IL 60201
$-1,319
Cash flow
-10.2%
Cash-on-Cash Return
3.3%
Cap rate
0.6%
Rent to Value Ratio
Active
$149,999
2
bds
|
1
ba
|
1,100
sqft
|
built
1970
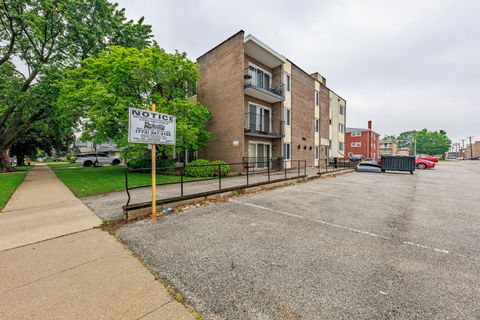
9516 S Kildare Ave, Oak Lawn, IL 60453
$-83
Cash flow
-2.9%
Cash-on-Cash Return
5.0%
Cap rate
1.2%
Rent to Value Ratio
Active
$499,999
6
bds
|
3
ba
|
3,532
sqft
|
built
1923
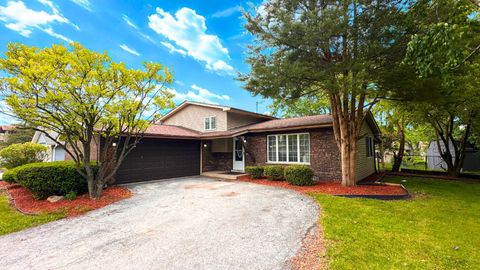
9712 W Shore Dr, Oak Lawn, IL 60453
$-345
Cash flow
-3.6%
Cash-on-Cash Return
4.9%
Cap rate
0.8%
Rent to Value Ratio
Active
$262,000
2
bds
|
2
ba
|
1,650
sqft
|
built
2003
6743 S Pointe Dr, Tinley Park, IL 60477
$-422
Cash flow
-8.4%
Cash-on-Cash Return
3.7%
Cap rate
1.0%
Rent to Value Ratio
Active
$269,000
3
bds
|
2
ba
|
1,700
sqft
|
built
1977
5303 Arquilla Dr, Richton Park, IL 60471
$-202
Cash flow
-3.9%
Cash-on-Cash Return
4.8%
Cap rate
0.9%
Rent to Value Ratio
Active
$337,000
2
bds
|
2
ba
|
1,450
sqft
|
built
1980
50 Lake Blvd, Buffalo Grove, IL 60089
$-607
Cash flow
-9.4%
Cash-on-Cash Return
3.5%
Cap rate
0.8%
Rent to Value Ratio

Active
$289,900
1
bds
|
1
ba
|
0
sqft
|
built
2008
8 E Randolph St, Chicago, IL 60601
$-1,036
Cash flow
-18.6%
Cash-on-Cash Return
1.4%
Cap rate
0.9%
Rent to Value Ratio

Active
$195,000
3
bds
|
1
ba
|
0
sqft
|
built
1946
446 Warren St, Calumet City, IL 60409
$-329
Cash flow
-8.8%
Cash-on-Cash Return
3.7%
Cap rate
0.7%
Rent to Value Ratio
Active
$264,000
3
bds
|
3
ba
|
2,450
sqft
|
built
1979
327 Marquette Ave, Calumet City, IL 60409
$-674
Cash flow
-13.3%
Cash-on-Cash Return
2.6%
Cap rate
0.8%
Rent to Value Ratio
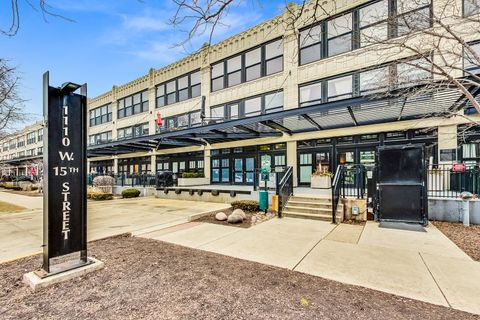
Active
$375,000
2
bds
|
2
ba
|
1,226
sqft
|
built
1925
1110 W 15th St, Chicago, IL 60608
$-1,282
Cash flow
-17.8%
Cash-on-Cash Return
1.6%
Cap rate
0.7%
Rent to Value Ratio
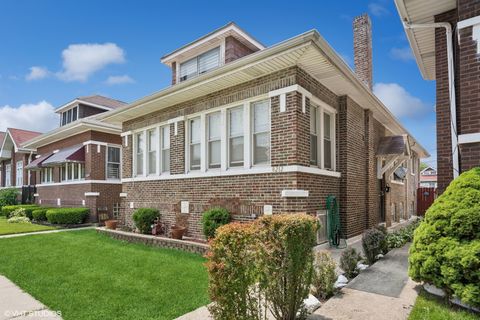
Active
$210,000
4
bds
|
2
ba
|
1,325
sqft
|
built
1928
8212 S Bishop St, Chicago, IL 60620
$388
Cash flow
9.6%
Cash-on-Cash Return
7.9%
Cap rate
1.1%
Rent to Value Ratio
Active
$239,900
4
bds
|
3
ba
|
1,700
sqft
|
built
1922
14505 S Mc Kinley Ave, Posen, IL 60469
$325
Cash flow
7.1%
Cash-on-Cash Return
7.3%
Cap rate
1.0%
Rent to Value Ratio

Active
$324,900
3
bds
|
2
ba
|
0
sqft
|
built
1978
1316 S Quail Walk, Mount Prospect, IL 60056
$-1,042
Cash flow
-16.7%
Cash-on-Cash Return
1.8%
Cap rate
0.7%
Rent to Value Ratio

Active
$198,500
4
bds
|
1
ba
|
1,300
sqft
|
built
1925
8129 S Princeton Ave, Chicago, IL 60620
$182
Cash flow
4.8%
Cash-on-Cash Return
6.8%
Cap rate
0.9%
Rent to Value Ratio

Active
$325,000
4
bds
|
2
ba
|
2,434
sqft
|
built
1988
19205 Ada St, Lansing, IL 60438
$-601
Cash flow
-9.6%
Cash-on-Cash Return
3.5%
Cap rate
0.9%
Rent to Value Ratio
Active
$209,900
9
bds
|
3
ba
|
0
sqft
|
built
1923
7952 S Langley Ave, Chicago, IL 60619
$351
Cash flow
8.7%
Cash-on-Cash Return
7.7%
Cap rate
1.2%
Rent to Value Ratio
Active
$214,900
3
bds
|
2
ba
|
0
sqft
|
built
1963
15153 Harding Ave, Midlothian, IL 60445
$329
Cash flow
8.0%
Cash-on-Cash Return
7.5%
Cap rate
1.2%
Rent to Value Ratio
Active
$268,700
3
bds
|
2
ba
|
988
sqft
|
built
1955
401 W 14th Pl, Chicago Heights, IL 60411
$-272
Cash flow
-5.3%
Cash-on-Cash Return
4.5%
Cap rate
0.7%
Rent to Value Ratio
Active
$569,000
2
bds
|
1
ba
|
1,063
sqft
|
built
1948
625 N County Line Rd, Hinsdale, IL 60521
$-1,072
Cash flow
-9.8%
Cash-on-Cash Return
3.4%
Cap rate
0.6%
Rent to Value Ratio
Active
$164,900
3
bds
|
2
ba
|
1,490
sqft
|
built
1952
36 Monee Rd, Park Forest, IL 60466
$232
Cash flow
7.3%
Cash-on-Cash Return
7.4%
Cap rate
1.5%
Rent to Value Ratio

Active
$650,000
2
bds
|
2
ba
|
1,739
sqft
|
built
2003
737 W Washington Blvd, Chicago, IL 60661
$-2,979
Cash flow
-23.9%
Cash-on-Cash Return
0.2%
Cap rate
0.8%
Rent to Value Ratio